 Open Access Article
Creative Commons Attribution 3.0 Unported Licence
Anisotropic phonon transport and lattice thermal conductivities in tin dichalcogenides SnS2 and SnSe2
Haifeng Wang *a,
Yan Gaoa and
Gang Liu
 b
b
aDepartment of Physics, College of Science, Shihezi University, Xinjiang 832003, China. E-mail: whfeng@shzu.edu.cn
bSchool of Physics and Engineering, Henan University of Science and Technology, Luoyang 471023, China
First published on 23rd January 2017
Abstract
In recent years, layered semiconductor tin dichalcogenides, SnX2 (X = S and Se), have received great attention owing to their wide applications in numerous fields. However, theoretical studies on their phonon transport properties and lattice thermal conductivities are very rare. Herein, we carry out comprehensive investigations on the phonon transport properties and heat transfer phenomena in tin dichalcogenides using first-principles calculations combined with the Boltzmann transport theory, and compare them with the recent popular thermoelectric materials SnS (SnSe) and widely studied typical TMD MoS2 (MoSe2). The obtained total thermal conductivities of SnS2 and SnSe2 agree well with the experimental measured values. The ultralow out-of-plane thermal conductivities of both materials may be useful for thermoelectric applications. The contributions of different phonon branches to the total lattice thermal conductivities are evaluated, and the results suggest that it would be difficult for alloying to reduce κL because the contribution of the optical branches is rather small compared with SnS and SnSe. Subsequently, we investigated the size dependence of the thermal conductivities and found that nanostructuring may be efficient to further reduce κL since the mean free paths of the dominant phonon modes are relatively long. This conclusion is consistent with recent experimental findings, where the κL of SnS2 was found to evidently decrease with a decrease in the thickness of SnS2 films. We believe that this phenomenon may also exist in SnSe2, which may demonstrate a much better thermoelectric performance than that of SnS2 because of its higher anharmonicity than that of SnS2, leading to much lower thermal conductivity.
1. Introduction
Transition metal dichalcogenides (TMDs) (MX2, where M denotes a transition metal and X denotes a chalcogen) are currently attracting increasing interest as a group of mostly semiconducting two-dimensional (2D) and few-layer materials that complement other 2D systems, such as graphene1,2 or h-BN.3,4 Among all the TMDs, tin dichalcogenides (SnS2 and SnSe2) (hereafter denoted as SnX2) are more earth-abundant and environmentally-friendly. Recently, they have attracted much attention due to their great potential in a wide spectrum of applications, e.g., thin film solar cells, optoelectronic devices, field-effect transistors (FETs), lithium-ion batteries and portable electronic information storage devices.5–12 In spite of the large amount of research on their structural, electronic and optical properties,11–16 only limited information is now available concerning the thermoelectric performances of SnS2 and SnSe2.17–19 In the recent theoretical study by B. Sun et al.,18 it was shown that the peak ZT can reach as high as 0.96 for SnS2 and 0.88 for SnSe2 at room temperature, which shows their potential for TE applications. Moreover, in another recent experimental study,19 the authors suggest that SnS2 nanosheets are negatively correlated thermoelectric materials with a negative correlation between electrical and thermal conductivity, that is, as the thickness of SnS2 decreases, s increases, whereas κ decreases. Naturally, this is an important finding since most TE materials demonstrate decreased thermal conductivity when their electrical conductivity increases. Although the lattice thermal conductivity is crucial to the thermoelectric performance of TE materials, to date, theoretical reports that discuss the lattice thermal conductivity of SnX2 are still lacking, with the exception of one recent study18 that considered the theoretically minimum lattice thermal conductivity (κmin). On the other hand, several of the experimentally measured values of thermal conductivity differ enormously.19–23 Furthermore, a complete and comparative prediction and understanding of the underlying phonon transport properties of SnS2 and SnSe2 are key to expanding the range of their application in nanoelectronics, optoelectronics and thermoelectrics; however, thus far, the phonon transport properties of these two dichalcogenides are still less known. Therefore, it is necessary to give a detailed study of their phonon transport and accurately predict their intrinsic thermal conductivity. Another fact that should be noted is that the present materials have several similarities with SnS and SnSe, which have been recently found to display high thermoelectric efficiencies with great potential for the conversion of heat to electricity.24,25 For example, they all are constituted of Sn and S (Se) that tend to form weak atomic bonds and usually lead to strong anharmonicity. In addition, they all have anisotropic (orthorhombic) layered structures and the interplanar van der Waals forces usually bring ultralow out-of-plane thermal conductivity. Then, the question arises of whether SnX2 could perform well as thermal insulators similar to SnS and SnSe.Herein, we conduct comprehensive investigations into the anisotropic phonon transport properties and intrinsic thermal conductivities of SnX2 based on first-principles calculations. A systematic study of the lattice dynamics are performed and related properties, including Born effective charge (BEC), dielectric constant (DC) and frequencies of optical modes, together with their irreducible representation are given. Then, the lattice thermal transports of both materials are calculated by solving the phonon Boltzmann transport equation. The obtained thermal conductivities of SnS2 and SnSe2 are close to the experimental measured values. The contributions of each phonon branch to the total thermal conductivities, phonon lifetimes and the dependence of thermal conductivities for both materials are evaluated, and the underlying mechanism governing their diverse thermal transport behavior are analyzed and discussed in detail.
2. Computational details
First-principles calculations were performed using the density functional theory as implemented in the Vienna ab initio simulation package (VASP)26–28 with a plane wave energy of up to 500 eV in the expansion of the electronic wave function. The local density approximation (LDA),29 which is typically used for layered structures where van der Waals interactions are important, was chosen as the exchange–correlation functional of DFT. The valence electron configurations considered in this calculation are Sn (4d105s25p2), S (3s23p4), and Se (4s24p4). The internal coordinates and lattice constants were optimized until the Hellmann–Feynman forces acting on each atom became less than 10−3 eV Å−1. The convergence for energy was chosen as 10−6 eV between two steps, and a Monkhorst–Pack k-mesh of 7 × 7 × 5 was used to sample the Brillouin zone in the structure optimization. Phonon frequencies and the corresponding thermodynamic properties were obtained using the PHONOPY30 program. Moreover, an iterative self-consistent method was used for solving the phonon Boltzmann transport equation to calculate the lattice thermal conductivity with the ShengBTE31 code, which is based on the second-order (harmonic) and third-order (anharmonic) interatomic force constants (IFCs) combined with an iterative self-consistent algorithm to solve the BTE, and has also successfully predicted the thermal conductivities of many materials.32–38 We used 4 × 4 × 2 supercells containing 96 atoms with 3 × 3 × 3 k-mesh for calculations of second-order and third-order IFCs for both SnS2 and SnSe2. In the calculations of the third-order IFCs, we considered third-order interatomic force constants up to the fourth shell of neighbors. Well-converged 20 × 20 × 11 q-meshes were used in the calculation of the lattice thermal conductivity of SnX2.3. Results and discussion
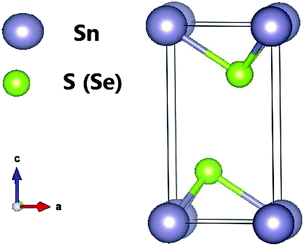
Tin dichalcogenides (SnS2 and SnSe2) crystallize in the hexagonal closed packed CdI2-type structure with P![[3 with combining macron]](https://www.rsc.org/images/entities/char_0033_0304.gif) m1 symmetry (space group 164). They have three atoms in the unit cell, which extends over only one sandwich layer as seen in Fig. 1. The intralayer metal (Sn)–chalcogenide (S or Se) bonds are predominantly covalent in nature, whereas the layers themselves are coupled by weak van der Waals bonds. The Sn atoms provide four electrons to fill the bonding states of SnX2 such that the oxidation states of the Sn and S (or Se) atoms are +4 and −2, respectively. Our relaxed lattice constants resulting from LDA are a = 3.63 Å and c = 5.71 Å for SnS2, and a = 3.80 Å and c = 5.90 Å for SnSe2, which agree well with previous ab initio calculations13 but are slightly underestimated compared with the experimental results.39 This is reasonable because of the overbinding effect of LDA.
m1 symmetry (space group 164). They have three atoms in the unit cell, which extends over only one sandwich layer as seen in Fig. 1. The intralayer metal (Sn)–chalcogenide (S or Se) bonds are predominantly covalent in nature, whereas the layers themselves are coupled by weak van der Waals bonds. The Sn atoms provide four electrons to fill the bonding states of SnX2 such that the oxidation states of the Sn and S (or Se) atoms are +4 and −2, respectively. Our relaxed lattice constants resulting from LDA are a = 3.63 Å and c = 5.71 Å for SnS2, and a = 3.80 Å and c = 5.90 Å for SnSe2, which agree well with previous ab initio calculations13 but are slightly underestimated compared with the experimental results.39 This is reasonable because of the overbinding effect of LDA.
3.1 Lattice dynamics properties
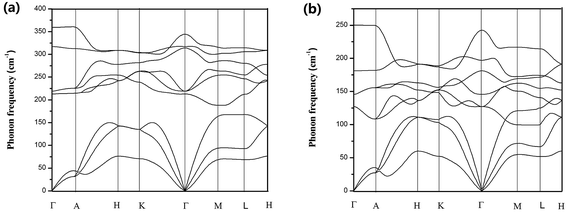
The harmonic phonon dispersions of SnX2 as obtained from the force constants and considering the longitudinal optical–transverse optical (LO–TO) splitting are shown in Fig. 2. The LO–TO splitting is predicted by incorporating the effects of long-range Coulomb interactions based on the Born effective charges and high-frequency dielectric constants calculated by first-principles. Our calculated Born effective charges and dielectric constants are illustrated in Table 1. It is worth noting that the ionic contribution to the dielectric constant of SnS2 along the out-of-plane (c axis) direction is very small (0.69), which indicates that SnS2 holds more two-dimensional characteristics than SnSe2. This is consistent with the fact that the out-of-plane thermal conductivity of SnS2 is much lower than that of SnSe2, which will be discussed later.In general, SnS2 and SnSe2 show very similar dispersion curves along different high symmetry lines except (1) the frequencies of the optical branches of SnS2 are significantly higher, which is mainly due to the smaller atomic mass of S. (2) There exists an evident phonon gap (about 30 cm−1) between the acoustic branches and optical branches for SnS2 owing to its larger cation/anion mass ratio, whereas there is no similar gap for SnSe2.
In comparison with the phonon dispersions of SnS and SnSe,34 a big difference is that the phonon spectrum of SnS and SnSe are characterized by markedly dispersive optical phonon branches, which result in significant group velocities of the optical phonon branches, whereas there are no similar phenomena for SnS2 and SnSe2. Another important feature of the phonon spectra of SnX2 is that along the Γ–A high-symmetry k-paths, the phonon dispersion curves of both materials are almost flat, particularly for SnS2. This means that the phonon group velocities along the out-of-plane direction are very low, which can be attributed to ultra weak interactions between the layers. In fact, as revealed by Babu Ram et al.,41 the interlayer coupling of SnS2 is much weaker than that of MoS2.
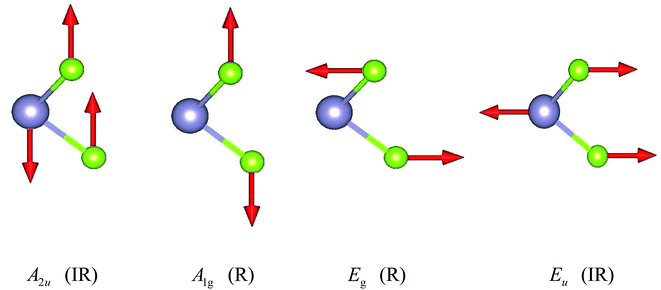
The unit cell of SnX2 contains three atoms, and therefore there are total of nine vibrational modes. Group theoretical symmetry analysis yields the irreducible representations of the Γ-point phonon modes: Γ = A1g + 2A2u + Eg + 2Eu. The acoustic modes are A2u + Eu. Thus, there are four optical modes, of which A1g + Eg are Raman active and the other two A2u + Eu are infrared active. Note that the double degenerate Eu mode has two orthogonal eigenvectors, which result in LO–TO splitting when the phonon propagates in the ab plane, that is, Eu(LO) and Eu(TO) modes. The electrostatic interaction between the ions pushes the longitudinal optical (LO) phonons to high frequency, whereas the transversal optical (TO) phonons are unaffected. Similarly, the LO–TO splitting effect also separate the A2u mode into A2u(LO) and A2u(TO) modes. In Table 2 we list the calculated frequencies of the optical vibrational modes considering the LO–TO splitting and compare experimentally measured Raman values since the A1g and Eg symmetries are easily distinguished experimentally.
The specific oscillation patterns of the optical modes are shown in Fig. 3. We can find that Eg and Eu correspond to in-plane vibration modes, whilst A2u and A1g are out-of-plane vibration modes. In addition, the Raman mode A1g and Eg species involve exclusively chalcogen atom vibrations.
3.2 Lattice thermal conductivity
Fig. 4 shows the temperature-dependent κL of SnS2 and SnSe2 along the in-plane (a axis) and out-of-plane (c axis) directions in comparison with the experimental measured data at 300 K.19–21 We can see that the lattice thermal conductivities decrease with an increase in temperature following the T−1 relationship, which implies that the thermal conductivity is given by the anharmonic phonon–phonon interactions. In addition, the thermal conductivities of both materials are extremely anisotropic; for example, the ratio of κin-planeL/κout-planeL for SnSe2 at 300 K is as large as 7.1, which is much higher than that of MoSe2 (∼5.0)33 and SnSe (∼2.5),34 showing much larger anisotropy of the present materials. The large anisotropy between the in-plane and out-of-plane thermal conductivity is largely due to the much smaller group velocities in the c direction. This is the result of the interlayer (vdW) interactions being much weaker than the intralayer Sn-X covalent bonding. The average lattice thermal conductivity of bulk SnS2 and SnSe2 can be evaluated as 2/3κin-planeL + 1/3κout-planeL.33 Our calculated average κL values at room temperature (8.2 W mK−1 for SnS2 and 5.6 W mK−1 for SnSe2) are close to the historically measured κL of bulk single crystals (10 W mK−1 (ref. 20) for SnS2 and 7.29 W mK−1 (ref. 21) for SnSe2 at 300 K). Although the calculated thermal conductivity for SnS2 is much larger than the experimental value for 22 nm-thick nanosheets (4.63 W mK−1),19 it is perfectly reasonable since in 2D SnS2, the surface phonon scattering may be greatly enhanced and thus possibly decrease the lattice thermal conductivity. In comparison with other typical layer materials, the lattice thermal conductivities of SnX2 are much larger than that of SnS (∼1.6 W mK−1 (ref. 34) at 300 K calculated using the same iterative self-consistent method with the ShengBTE code and the experimental value of ∼1.7 W mK−1 (ref. 43)) and SnSe (∼1.5 W mK−1 (ref. 34) at 300 K calculated with the ShengBTE code and the experimental value of ∼0.67 W mK−1 (ref. 24)), but greatly lower than that of MoS2 (∼67 W mK−1 (ref. 36)) at 300 K calculated with the ShengBTE code and the experimental value of 110 ± 20 W mK−1 (ref. 44)) and MoSe2 (∼60 W mK−1 (ref. 33) at 300 K) calculated using the ShengBTE code.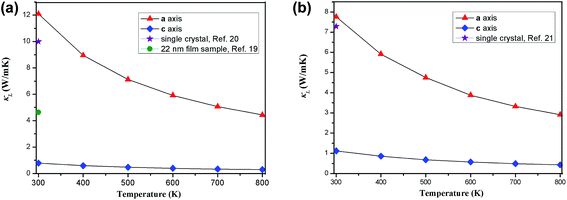 | ||
| Fig. 4 Calculated temperature dependent lattice thermal conductivities of (a) SnS2 and (b) SnSe2 along the a axis and c axis, in comparison with the experimental data at 300 K. | ||
What is even more important is that the out-of-plane thermal conductivities for both materials are found to be unexpectedly low; for example, the calculated room-temperature κL of SnS2 along the out-of-plane direction is 0.78 W mK−1, which approaches the predicted amorphous limit (0.47 W mK−1)18 and is even lower than that of SnS (0.8 W mK−1 along the out-of-plane direction at room temperature).34 Furthermore, these values are remarkably low among most of the TMDs; for example, the calculated out-of-plane thermal conductivity using the same method for MoS2 is 2.3 W mK−1 (ref. 36) (the experimental out-of-plane thermal conductivity of bulk MoS2 at 300 K is 1.05 W mK−1 (ref. 45)) and that of WTe2 is 1.04 W mK−1.38 This implies that the thermoelectric performance of SnS2 along the out-of-plane direction may be as good as that of SnS. In fact, it is difficult to definitely say how its thermoelectric performance would be because the thermoelectric figure of merit is determined by several strongly coupled quantities and the lattice thermal conductivity is only one of them, but at least, we can conclude that the present material is a good thermal insulator in the out-of-plane direction. Unfortunately, the experimentally measured thermal conductivity values of the out-of-plane direction are not yet available in the literature.
Using the obtained thermal conductivity values of SnX2, its thermal diffusivity can be derived from the formula α = κL/Cpρ (κL is thermal conductivity, Cp is heat capacity and ρ is density). Thermal diffusivity is one of the crucial parameters to investigate the thermal transportation process, which indicates that the rate of temperature changes and reflects the correlation between thermal conductivity and heat capacity.46–49 The TAPP software50 gives heat capacity values of CSp = 252 J kg K−1 for SnS2 and CSep = 261 J kg K−1 for SnSe2 at room temperature. The density of SnX2 is easily calculated as ρS = 4700 kg m−3 for SnS2 and ρSe = 6200 kg m−3. Then, we derive the thermal diffusivity αS = 6.9 × 10⁻⁶ m2 s−1 for SnS2 and αSe = 3.4 × 10⁻⁶ m2 s−1 for SnSe2. Clearly, the thermal diffusivity of SnS2 is much larger than that of SnSe2 mainly due to its larger thermal conductivity and smaller mass density. Our calculated thermal diffusivity for SnSe2 is close to the historically calculated value (αSe = 5.4 × 10⁻⁶ m2 s−1 at 300 K);22 however, the thermal diffusivity of bulk SnS2 was not found in the literature.
We then determined the contribution of the different phonon modes to the total lattice thermal conductivities for the two materials, as illustrated in Table 3. It is found that along the in-plane direction, the contribution of the optical branches to the total thermal conductivity at room temperature for both SnS2 and SnSe2 is small, whereas along the out-of-plane direction, the contribution of the optical branches is relatively large, particularly for SnS2, where the contribution of the optical branches is as large as 22%. This may be one of the reasons for the ultralow out-of-plane thermal conductivity since the optical branches usually possess much smaller group velocities and much shorter phonon lifetimes than those of the acoustic branches. The small contributions of the optical phonons of SnX2 is an obvious difference with SnX, for instance, the optical phonon branches contribute ∼60% to the total thermal conductivity of SnSe.34 Therefore, alloying may not be an effective strategy for further reducing the κL of SnX2.
| TA1 | TA2 | LA | Optic | ||
|---|---|---|---|---|---|
| SnS2 | In-plane | 16% | 35% | 43% | 6% |
| Out-of-plane | 30% | 24% | 24% | 22% | |
| SnSe2 | In-plane | 14% | 36% | 41% | 9% |
| Out-of-plane | 28% | 22% | 35% | 15% | |
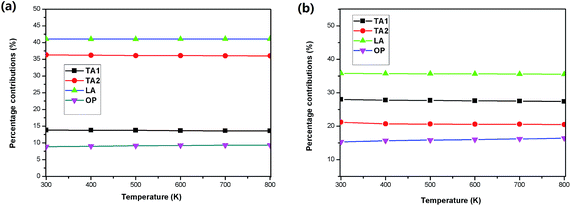
Furthermore, the temperature dependence of contributions from the phonon branches is plotted in Fig. 5 using SnSe2 as an example. One can see that the contributions of all the phonon modes along the in-plane direction are very insensitive to temperature, where the percentage contributions of the acoustic phonon branches slightly decrease with an increase in temperature, and at the same time, the contribution of the optical phonon branches slightly increases with an increase in temperature. While along the out-of-plane direction, the increase tendency of the contributions of the optical branches becomes evident and reaches 16.5% at 800 K, indicating that higher frequency optical phonons are excited at higher temperatures.
Considering the significant difference in the contribution of different phonon branches to the total thermal conductivity in SnX2, it is worthwhile to examine the relaxation times of the phonon modes as functions of phonon frequency, as displayed in Fig. 6. It is found that the relaxation times of the phonon modes for SnS2 and SnSe2 are very close to each other. Otherwise, the relaxation times of the acoustic branch are one order of magnitude bigger than that of the optical branches, which indicates small contributions of optical phonons to the total κL. In comparison with SnX and MoX2, the relaxation times of SnX2 are much shorter than that of MoX2, although slightly longer than that of SnX. For example, the calculated longest relaxation time of acoustic phonons for SnS2 is about 160 ps, whilst that of MoS2 is as large as 104 ps,36 and that of SnS is only about 28 ps.34
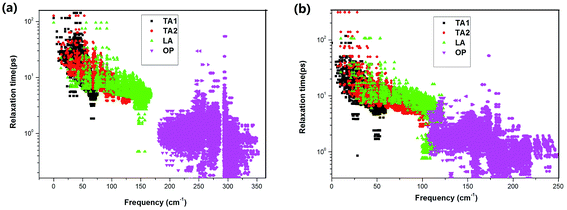 | ||
| Fig. 6 Frequency-dependent phonon relaxation times of the acoustic (AP) and optical phonons (OP) for (a) SnS2 and (b) SnSe2 at 300 K. | ||
Since the phonon lifetimes of these two materials are comparable, what is the main mechanism that leads to the higher κL in SnS2? We next calculated the phonon group velocities of SnX2 around the Γ point. Our calculated sound velocity in the long-wavelength limit of SnS2 is about 5060 m s−1 along the in-plane direction, and that of SnSe2 is only 4050 m s−1. Thus, the conclusion is clear that it is just the relatively larger phonon group velocities combined with the higher phonon frequencies of SnS2 that induce the much higher κL than SnSe2. We also evaluated the anharmonic phase space volume P3, that is, the number of allowed three-phonon processes of the present two compounds, which is usually used to quantify the anharmonicity of a certain material. The obtained P3 of SnS2 is 0.54 × 10⁻² eV−1, and that of SnSe2 is 0.83 × 10⁻² eV−1; therefore it is clear that the anharmonicity of SnSe2 is higher than that of SnS2. In comparison with other low-conductivity compounds, the anharmonic phase space volume P3 is slightly larger than that of Si (0.47 × 10⁻² eV−1),32 but much smaller than that of SnSe (1.9 × 10⁻² eV−1).32 Furthermore, the mode Grüneisen parameters are calculated as 1.18 for SnS2 and 1.21 for SnSe2, which also indicates that the anharmonicity of SnSe2 is higher than that of SnS2.
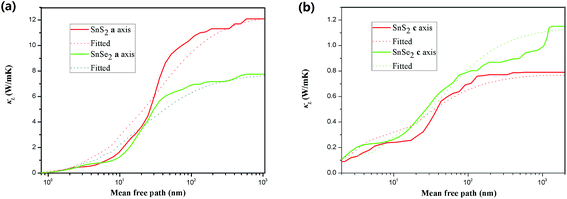
Finally, we investigate the size effects of the present materials by studying the cumulative thermal conductivity κ(l) as a function of phonon mean free path, which is defined as the thermal conductivity contributed by phonons whose mean free path l is smaller than a given value lmax. Fig. 7 shows the cumulative thermal conductivity along the a and c directions with respect to the phonon MPFs at room temperature, 300 K. It can be seen that the cumulative thermal conductivity of both materials continuously increases as MFP increases, until reaching the limit length L, which represents the longest mean free path of the heat carriers. We derived the limit lengths of La ∼ 585 nm and Lc ∼ 400 nm for SnS2, and La ∼ 575 nm and Lc ∼ 1100 nm for SnSe2. It should be noted that the limit lengths L of the present compounds are much larger than that of SnS and SnSe.32,34
Then, we fitted the cumulative κ(l) for SnX2 along the in-plane and out-of-plane directions at 300 K to a single parametric function,51,52  , where, κmax is the ultimate cumulated κ, lmax is the maximal MFP concerned, and l0 is the parameter to be evaluated by the fitting. The fitted curves are plotted in Fig. 7, which reproduce the calculated data well and yield the parameter l0 for the two materials along the in-plane and out-of-plane directions, which could be interpreted as the representative MFP (rMFP). The rMFP is helpful to study the size effect on ballistic or diffusive phonon transport, which is important for thermal design with nanostructuring. Our fitted rMFPs (l0) for SnS2 are 30 nm along the in-plane direction and 20 nm along the out-of-plane direction, and for SnSe2, they are 24 nm along the in-plane direction and 38 nm along the out-of-plane direction. These values are quite larger than that of SnSe (4.30 nm along the armchair direction and 6.86 nm along the zigzag direction).35 Such large representative rMFPs suggest that there are strong size effects in the phonon transport of micro-/nano-sized materials based on these two materials. Our results suggest that to reduce the lattice thermal conductivities of both materials, nanostructuring will be an effective way. This suggestion is consistent with recent experiment findings, where the κL of SnS2 was found to evidently decrease with a decrease in the thickness of SnS2 films.19 Moreover, we believe that such a phenomenon may also exist in SnSe2, that is, this material may also be a negatively correlated thermoelectric material just like SnS2 with a negative correlation between electrical and thermal conductivity. In addition, SnSe2 may demonstrate a much better thermoelectric performance than that of SnS2 because of its higher anharmonicity than that of SnS2, leading to much lower thermal conductivity.
4. Conclusion
In summary, we have systematically investigated the anisotropic phonon transport properties and intrinsic lattice thermal conductivities for tin dichalcogenides (SnS2 and SnSe2) from first principles calculations. The calculated in-plane lattice thermal conductivity of SnS2 is 12.10 W mK−1, whereas that of SnSe2 is much lower (7.76 W mK−1), which mainly originates from its relatively smaller phonon group velocities combined with lower phonon frequencies. The out-of-plane thermal conductivities of both materials are found to be remarkably low (0.78 W mK−1 for SnS2 and 1.12 W mK−1 for SnSe2) due to very weak interlayer forces, which indicates their significance in thermoelectric applications. The obtained total thermal conductivities of SnS2 and SnSe2 agree well with experimental measured values. The phonon lifetimes of all branches are found to be much shorter in comparison with that of MoS2 (MoSe2) but slightly longer than that of SnS (SnSe). The contributions of the optical phonon branches to the total thermal conductivities are found to be rather small, which suggests that it would be difficult for the strategy of alloying to reduce κL. However, nanostructuring may be effective to further reduce κL since the mean free paths of the dominant phonon modes are relatively long. This conclusion is consistent with recent experiment findings, where the κL of SnS2 thin films were found to be much lower than that of bulk SnS2. Our study not only presents comprehensive investigations on the phonon transport properties of SnS2 and SnSe2, but also provides discussions and analyses on the origins of the diverse heat transfer phenomena, which would be of significance for further studies and applications based on these two TMDs.Acknowledgements
This study was supported by the Natural Science Foundation of China (Grant no. 11145004 and 21363019).Notes and references
- J. Gu, X. Yang, Z. Lv, N. Li, C. Liang and Q. Zhang, Int. J. Heat Mass Transfer, 2016, 92, 15–22 CrossRef CAS.
- J. Gu, C. Xie, H. Li, J. Dang, W. Geng and Q. Zhang, Polym. Compos., 2014, 35, 1087–1092 CAS.
- J. Gu, X. Meng, Y. Tang, Y. Li, Q. Zhuang and J. Kong, Composites, Part A, 2017, 92, 27–32 CrossRef CAS.
- J. Gu, C. Liang, J. Dang, W. Dong and Q. Zhang, RSC Adv., 2016, 6, 35809–35814 RSC.
- S. Gedi, V. R. M. Reddy, B. Pejjai, C.-W. Jeon and C. Park, Appl. Surf. Sci., 2016, 372, 116–124 CrossRef CAS.
- X. Jing, D. D. Zhu, L. Wang, B. Huang, X. Huang and X. M. Meng, Adv. Funct. Mater., 2015, 25, 4255–4261 CrossRef.
- X. Zhou, Q. Zhang, L. Gan, H. Li and T. Y. Zhai, Adv. Funct. Mater., 2016, 26, 4405–4413 CrossRef CAS.
- S. Song, S. L. Li, L. Gao, Y. Xu, K. Ueno, J. Tang, Y. B. Chengad and K. Tsukagoshi, Nanoscale, 2013, 5, 9666–9670 RSC.
- F. Zhang, C. Xia, J. Zhu, B. Ahmed, H. Liang, D. B. Velusamy, U. Schwingenschlögl and H. N. Alshareef, Adv. Energy Mater., 2016, 16, 01188 Search PubMed.
- C. KyungMin, D. Wamwangi, M. Woda, M. Wuttig and W. Bensch, J. Appl. Phys., 2008, 103, 083523 CrossRef.
- Z. Sun and H. Chang, ACS Nano, 2014, 8, 4133–4156 CrossRef CAS PubMed.
- H. Zhong, G. Yang, H. Song, Q. Liao, H. Cui, P. Shen and C. Wang, J. Phys. Chem. C, 2012, 116, 9319–9326 CAS.
- X. He and H. Shen, Phys. B, 2012, 407, 1146–1152 CrossRef CAS.
- L. A. Burton, D. Colombara, R. D. Abellon, F. C. Grozema, L. M. Peter, T. J. Savenije, G. Dennler and A. Walsh, Chem. Mater., 2013, 25, 4908–4916 CrossRef CAS.
- S. Mandalidis, J. A. Kalomiros, K. Kambas and A. N. Anagnostopoulos, J. Mater. Sci., 1996, 31, 5975–5978 CrossRef CAS.
- A. Voznyi, V. Kosyak, A. Opanasyuk, N. Tirkusova, L. Grase, A. Medvids and G. Mezinskis, Mater. Chem. Phys., 2016, 173, 52–61 CrossRef CAS.
- A. A. Kozma, M. Y. Sabov, E. Y. Peresh, I. E. Barchiy and V. V. Tsygyka, Inorg. Mater., 2015, 51, 93–97 CrossRef CAS.
- B. Sun, Z. Ma, C. Hea and K. Wu, Phys. Chem. Chem. Phys., 2015, 17, 29844–29853 RSC.
- M. J. Lee, J. H. Ahn, J. H. Sung, H. Heo, S. G. Jeon, W. Lee, J. Y. Song, K. H. Hong, B. Choi, S. H. Lee and M. H. Jo, Nat. Commun., 2016, 7, 12011 CrossRef CAS PubMed.
- C. Khélia, F. Maïz, M. Mnari, T. Ben Nasrallah, M. Amlouk and S. Belgacem, Eur. Phys. J.: Appl. Phys., 2000, 9, 187–193 CrossRef.
- G. Busch, C. Fröhlich, F. Hulliger and E. Steigmeier, Helv. Phys. Acta, 1961, 34, 359 CAS.
- Z. V. Borges, C. M. Poffo, J. C. de Lima, S. M. de Souza, D. M. Triches, T. P. O. Nogueira, L. Manzato and R. S. de Biasi, Mater. Chem. Phys., 2016, 169, 47–54 CrossRef CAS.
- A. A. Kozma, M. Yu. Sabov, E. Yu. Peresh, I. E. Barchiy and V. V. Tsygyka, Inorg. Mater., 2015, 51, 93–97 CrossRef CAS.
- L.-D. Zhao, S.-H. Lo, Y. Zhang, H. Sun, G. Tan, C. Uher, C. Wolverton, V. P. Dravid and M. G. Kanatzidis, Nature, 2014, 508, 373–377 CrossRef CAS PubMed.
- L.-D. Zhao, G. Tan, S. Hao, J. He, Y. Pei, H. Chi, H. Wang, S. Gong, H. Xu and V. P. Dravid, Science, 2016, 351, 141–144 CrossRef CAS PubMed.
- G. Kresse and J. Furthmüller, Comput. Mater. Sci., 1996, 6, 15 CrossRef CAS.
- G. Kresse and J. Furthmüller, Phys. Rev. B: Condens. Matter Mater. Phys., 1996, 54, 11169 CrossRef CAS.
- G. Kresse and D. Joubert, Phys. Rev. B: Condens. Matter Mater. Phys., 1999, 59, 1758 CrossRef CAS.
- J. P. Perdew and A. Zunger, Phys. Rev. B: Condens. Matter Mater. Phys., 1981, 23, 5048 CrossRef CAS.
- A. Togo, F. Oba and I. Tanaka, Phys. Rev. B: Condens. Matter Mater. Phys., 2008, 78, 134106 CrossRef.
- W. Li, J. Carrete, N. A. Katcho and N. Mingo, Comput. Phys. Commun., 2014, 185, 1747 CrossRef CAS.
- J. Carrete, N. Mingo and S. Curtarolo, Appl. Phys. Lett., 2014, 105, 101907 CrossRef.
- S. Kumar and U. Schwingenschlögl, Chem. Mater., 2015, 27, 1278–1284 CrossRef CAS.
- R. Guo, X. Wang, Y. Kuang and B. Huang, Phys. Rev. B: Condens. Matter Mater. Phys., 2015, 92, 115202 CrossRef.
- G. Qin, Z. Qin, W.-Z. Fang, L.-C. Zhang, S.-Y. Yue, Q.-B. Yan, M. Hu and G. Su, Nanoscale, 2016, 8, 11306–11319 RSC.
- A. N. Gandi and U. Schwingenschögl, EPL, 2016, 113, 36002 CrossRef.
- B. Peng, H. Zhang, H. Shao, Y. Xu, X. Zhang and H. Zhu, Ann. Phys., 2016, 528, 504–511 CrossRef CAS.
- G. Liu, H. Y. Sun, J. Zhou, Q. F. Li and X. G. Wan, New J. Phys., 2016, 18, 033017 CrossRef.
- V. G. Hadjiev, D. De, H. B. Peng, J. Manongdo and A. M. Guloy, Phys. Rev. B: Condens. Matter Mater. Phys., 2013, 87, 104302 CrossRef.
- Y. Kumagai, L. A. Burton, A. Walsh and F. Oba, Phys. Rev. Appl., 2016, 6, 014009 CrossRef.
- B. Ram, A. Manjanath and A. K. Singh, 2D Mater., 2016, 3, 015009 CrossRef.
- G. Lucovsky, J. C. Mikkelslen Jr., W. Y. Liang and R. M. White, Phys. Rev. B: Solid State, 1976, 14, 1663–1669 CrossRef CAS.
- J. Wasscher, W. Albers and C. Haas, Solid-State Electron., 1963, 6, 261 CrossRef CAS.
- J. Liu, G. M. Choi and D. G. Cahill, J. Appl. Phys., 2014, 116, 233107 CrossRef.
- H. J. Goldsmid, in Semiconductors and Semimetals, ed. T. M. Tritt, Elsevier, 2001, vol. 69, p. 1 Search PubMed.
- V. Kishore, R. Sharma, V. K. Saraswat, N. S. Saxena, K. Sharma and T. P. Sharma, Appl. Therm. Eng., 2007, 27, 1552–1554 CrossRef CAS.
- J. M. Laskar, S. Bagavathiappan, M. Sardar, T. Jayakumar, J. Philip and B. Raj, Mater. Lett., 2008, 62, 2740–2742 CrossRef CAS.
- K. Zhou and B. Wei, Appl. Phys. A: Mater. Sci. Process., 2016, 122, 248 CrossRef.
- W. Zhai, K. Zhou, L. Hu and B. Wei, J. Chem. Thermodyn., 2016, 95, 159–163 CrossRef CAS.
- O. H. Hamilton, TAPP Software Version 2.2, E. S. Microwave Inc, Wade Court, 1990 Search PubMed.
- W. Li, J. Carrete, N. A. Katcho and N. Mingo, Comput. Phys. Commun., 2014, 185, 1747–1758 CrossRef CAS.
- G. Qin, Q.-B. Yan, Z. Qin, S.-Y. Yue, M. Hu and G. Su, Phys. Chem. Chem. Phys., 2015, 17, 4854 RSC.
| This journal is © The Royal Society of Chemistry 2017 |

