DOI:
10.1039/C6RA27728D
(Paper)
RSC Adv., 2017,
7, 6911-6921
Core–shell superparamagnetic monodisperse nanospheres based on amino-functionalized CoFe2O4@SiO2 for removal of heavy metals from aqueous solutions†
Received
4th December 2016
, Accepted 4th January 2017
First published on 20th January 2017
Abstract
To remove heavy metals from aqueous solutions, amino-functionalized superparamagnetic CoFe2O4@SiO2 (CoFe2O4@SiO2–NH2) core–shell nanospheres were designed and constructed. In particular, well-defined CoFe2O4 nanoparticles (NPs) were synthesized by reverse co-precipitation. The shell of the CoFe2O4 NPs was composed of amorphous silica (SiO2), which had a thickness of ∼35 nm. Monodisperse CoFe2O4@SiO2 nanospheres grafted with more amino groups had a greater adsorption capacity and higher removal efficiency for heavy metal ions (Cd(II): 199.9 mg g−1, 99.96%; Cu(II): 177.8 mg g−1, 88.05%; Pb(II): 181.6 mg g−1, 90.79%). The effects of the pH, initial concentrations, reaction temperature and time on the adsorption of heavy metal ions by CoFe2O4@SiO2–NH2 were analyzed systematically. The adsorption process on the nanospheres was well described by the Langmuir model. The adsorption kinetics can be best fitted by the pseudo-second-order kinetics model. Analysis of a thermodynamic study of Cu(II) showed that the process of adsorption is spontaneous and endothermic in nature. Owing to the superparamagnetic properties with a high saturation magnetization value (32.92 emu g−1) of CoFe2O4@SiO2–NH2, the metal-loaded nanospheres can be quickly removed from an aqueous solution (30 s) by magnetic separation. Moreover, the nanospheres exhibited good reusability for up to five cycles. The results confirm that the monodisperse amino-functionalized CoFe2O4@SiO2 magnetic nanospheres could be a potential adsorbent for the effective and regenerable removal of heavy metals from aqueous solutions.
1 Introduction
Water pollution caused by heavy metals has been one of the most serious worldwide environmental issues in recent years.1–4 Heavy metals can cause a variety of negative effects on human health even at low dosages. A suitable method is needed for the removal and preconcentration of heavy metal ions. Several methods have been developed for the treatment of heavy metals such as membrane separation, ion exchange, chemical precipitation, solvent extraction, adsorption, etc.5–7 Among these, adsorption is considered to be an attractive approach owing to its simplicity, high efficiency and the fact that it does not yield harmful by-products.8–11 Up to now, various adsorbents have been developed for the removal of different heavy metal ions.12–17 However, the development of adsorbents with high adsorption capacity, fast adsorption–desorption kinetics, easy separation and recyclability is extremely challenging. Therefore, the design and fabrication of a novel adsorbent with good adsorption capacity and convenient separation and regeneration are of both scientific and technological importance.
Recently, magnetic separation has been considered to be an effective technique for separating adsorbents from wastewater; therefore, magnetic adsorbents have been investigated widely.18–23 Moreover, magnetic adsorbents with a core–shell structure have attracted much interest owing to their enhanced properties and the synergistic effect between multiple discrete components. Specifically, the magnetic core can facilitate rapid separation, and the functional shell can adsorb heavy metal ions quickly. Many research studies have been carried out on the preparation of diverse core–shell magnetic composites.24–31 For instance, monodisperse Fe3O4/SiO2 magnetic nanoparticles were prepared by a sonochemical method.32,33 An amino-functionalized Fe3O4@SiO2 core–shell magnetic nanomaterial as an effective and recyclable adsorbent was synthesized,34–38 and the method of functionalization was post-modification34–36 or co-condensation.37,38 Venkateswarlu et al.27 presented novel Fe3O4@DAPF core–shell ferromagnetic nanorods for the removal of Pb(II) from aqueous solutions, which had adsorption capacities (83.3 mg g−1) comparable to the highest previous value. Zhang et al.38 fabricated Fe3O4@SiO2–NH2 core–shell nanoparticles via a controllable sol–gel process. The nanoparticles enabled easy recovery by an external magnet and effective removal of Pb(II) (qm = 243.9 mg g−1, 25 °C). Furthermore, Yuan et al.39 prepared a novel multifunctional microsphere with a large-pore-size mesoporous silica shell and a magnetic core (Fe3O4), which can graft more amino groups and adsorb more heavy metals in aqueous solution (Pb(II): 880.6 mg g−1, Cu(II): 628.3 mg g−1, Cd(II): 492.4 mg g−1). Among core–shell magnetic composites, the use of Fe3O4 nanoparticles (NPs) as the core has been widely studied owing to their unique magnetic properties. However, the chemical stability of Fe3O4 is fairly poor, even it is coated by a protective layer.
CoFe2O4 NPs have some advantages such as moderate saturation magnetization,40–42 easy preparation, and rapid separation,43,44 and especially their high chemical and corrosion stability. Recently, Zhao et al.45 introduced a CoFe2O4–zeolite material for adsorbing gallium and indium. Thiol-functionalized silica-coated CoFe2O4 magnetic composites with a core–shell structure have been synthesized and can potentially be applied to remove Pb(II) or Hg(II) ions in water.46,47 However, there are few reports concerning the preparation of monodisperse superparamagnetic CoFe2O4@SiO2 nanocomposites by a simple and low-cost method. Some cobalt–ferrite composites were relatively agglomerated and had larger sizes,48 which restricted their adsorption properties.
Here, we demonstrate a modified method of designing monodisperse magnetic nanospheres with a core–shell structure. The synthesized CoFe2O4@SiO2–NH2 nanospheres were used as an effective adsorbent to remove heavy metal ions (Cu(II), Cd(II), and Pb(II)) from aqueous solutions. The effects of the solution pH, reaction temperature, reaction time and initial concentration of Cu(II) on the adsorption performance were examined. In addition, the adsorption kinetics, thermodynamics and reusability of the adsorbents were also investigated. The adsorption and regeneration processes of the adsorbent are presented in Fig. 1d–i. These novel monodisperse nanospheres show great potential to be used as an excellent, economic, and regenerable adsorbent for the removal of heavy metal ions.
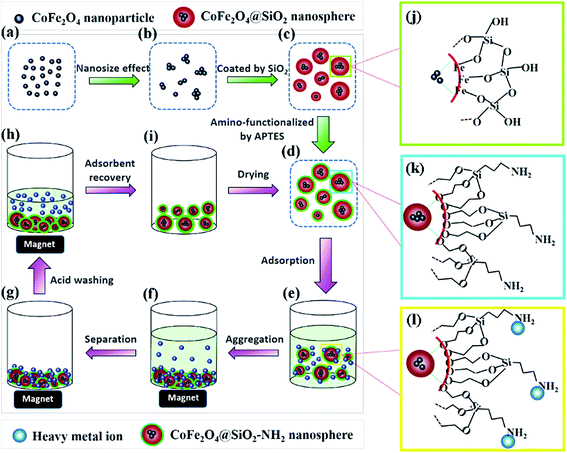 |
| | Fig. 1 Schematic illustration of the synthetic procedure of CoFe2O4@SiO2–NH2 core–shell nanospheres (a–d, j and k) and the adsorption and regeneration process of heavy metals (d–i and l). | |
2 Experiments
2.1 Materials
3-Aminopropyltriethoxysilane (APTES) was obtained from Aladdin Chemical Reagent Co., Ltd. Fe(NO3)3·9H2O, Co(NO3)2·6H2O, Cu(NO3)2·3H2O, Cd(NO3)2·4H2O, Pb(NO3)2, sodium hydroxide (NaOH), polyethylene glycol (PEG), ammonium hydroxide (NH3·H2O, 25%), o-xylene, citric acid, ethanol and tetraethyl orthosilicate (TEOS) were purchased from Sinopharm Chemical Reagent Co., Ltd. All reagents were of analytical grade and were used without further purification. Deionized water was used in all the experiments.
2.2 Preparation of CoFe2O4 (CFO) magnetic nanoparticles
CFO NPs were synthesized via an improved reverse co-precipitation method. Firstly, Fe(NO3)3·9H2O (8.08 g) and Co(NO3)2·6H2O (2.91 g) in a molar ratio of 2![[thin space (1/6-em)]](https://www.rsc.org/images/entities/char_2009.gif) :
:![[thin space (1/6-em)]](https://www.rsc.org/images/entities/char_2009.gif) 1 were dissolved in 100 mL deionized water and stirred at 70 °C. This solution was marked as solution A. Secondly, PEG (6000) as a dispersant was added to 150 mL ammonium hydroxide (NH3·H2O, 2.0 M) under vigorous stirring at 70 °C. This solution was marked as solution B. Thirdly, solution A was added dropwise to solution B under stirring for 1 h. The mixed solutions were refluxed for 2 h under the conditions of a boiling water bath. Fourthly, the resulting black precipitate was magnetically separated, washed with deionized water until the pH reached 7, dried in a vacuum at 80 °C for 12 h, and subsequently sintered at 350 °C for 12 h to drive out residual carbon. Finally, the prepared CFO magnetic NPs (0.3 g) were dispersed via sonication in 200 mL citric acid solution (0.1 M). The magnetic NPs that were modified by citric acid were collected by magnetic separation, washed three times with ethanol, dispersed in a mixture of ethanol (200 mL) and deionized water (50 mL) by sonication for 2 h, and stored in a 500 mL vial until further use. This solution was marked as solution C.
1 were dissolved in 100 mL deionized water and stirred at 70 °C. This solution was marked as solution A. Secondly, PEG (6000) as a dispersant was added to 150 mL ammonium hydroxide (NH3·H2O, 2.0 M) under vigorous stirring at 70 °C. This solution was marked as solution B. Thirdly, solution A was added dropwise to solution B under stirring for 1 h. The mixed solutions were refluxed for 2 h under the conditions of a boiling water bath. Fourthly, the resulting black precipitate was magnetically separated, washed with deionized water until the pH reached 7, dried in a vacuum at 80 °C for 12 h, and subsequently sintered at 350 °C for 12 h to drive out residual carbon. Finally, the prepared CFO magnetic NPs (0.3 g) were dispersed via sonication in 200 mL citric acid solution (0.1 M). The magnetic NPs that were modified by citric acid were collected by magnetic separation, washed three times with ethanol, dispersed in a mixture of ethanol (200 mL) and deionized water (50 mL) by sonication for 2 h, and stored in a 500 mL vial until further use. This solution was marked as solution C.
2.3 Preparation of CoFe2O4@SiO2 (CFO@SiO2) magnetic nanospheres
CFO@SiO2 nanospheres were synthesized according to a previously reported method.48 Typically, NH3·H2O was added to solution C to adjust its pH value. When the pH reached ∼9, TEOS (3 mL) was added dropwise to the suspension slowly under sonication. Afterward, the mixture was mechanically stirred for 12 h at room temperature. The resulting powder was collected by a magnet, washed with deionized water until neutral (pH = 7), and dried in a vacuum at 80 °C for 12 h.
2.4 Preparation of amino-functionalized CoFe2O4@SiO2 (CFO@SiO2–NH2)
In order to ensure anhydrous conditions, CFO@SiO2 (2.0 g) was washed with 80 mL o-xylene. After magnetic separation and dispersion in 150 mL o-xylene, the solution was stirred at 50 °C for 1 h. Subsequently, APTES (8 mL) was added to the above suspension dropwise. The mixture was refluxed at 100 °C for 24 h under mechanical stirring. The resulting black product was isolated by magnetic separation, washed with ethanol, and dried in a vacuum at 80 °C for 12 h.
2.5 Characterization
The structure and morphology of CFO, CFO@SiO2 and CFO@SiO2–NH2 were investigated by scanning electron microscopy (SEM; SU-70), transmission electron microscopy (TEM; Philips CM200), and high-resolution transmission electron microscopy (HRTEM; Tecnai G2 F20 S-TWIN FEI). All samples for TEM measurements were deposited on a carbon film supported by copper grids. The crystal structures of the samples were characterized by powder X-ray diffraction (XRD; PANalytical X'Pert PRO) with Cu Kα radiation (λ = 1.5418 Å). The diffraction data were collected over the angle range of 10–80° with a step size of 0.02°. Fourier transform infrared spectra (FT-IR) were recorded using KBr pellets with a Nicolet 5700 spectrometer. XPS data were obtained with an electron spectrometer (ESCALAB 250Xi) using monochromatized Al Kα radiation (hν = 1486.6 eV). The specific magnetization of the powders was also measured as a function of the applied magnetic field at room temperature using a vibrating-sample magnetometer (VSM 7407). The concentrations of metal ions were determined by atomic adsorption spectroscopy (AAS; AAnalyst 800).
2.6 Batch adsorption experiments
The effects of the pH, initial concentration, reaction time and temperature on the adsorption of heavy metals onto CFO@SiO2–NH2 (0.4 g L−1) were examined using a batch technique. The pH values were adjusted from 4 to 7 using NaOH (0.1 M) or HCl (0.1 M). Meanwhile, the concentrations of Cu(NO3)2 (80 mg L−1) and the adsorbent (20 mg) were kept constant. Cu(NO3)2 solutions with a range of initial ion concentrations of 20–320 mg L−1 were investigated, and the experiment was conducted at a pH of 7 and 35 °C. In order to study the effect of the contact temperature, CFO@SiO2–NH2 (20 mg) was added to 50 mL of 80 mg L−1 Cu(NO3)2 solution (pH 7) at different contact temperatures (25 °C, 35 °C, 45 °C, and 55 °C). The effect of the reaction time on the adsorption of heavy metal ions (Cd(II), Cu(II), and Pb(II)) by CFO@SiO2–NH2 was studied. Solutions of heavy metal ions (50 mL, 80 mg L−1) containing adsorbents (20 mg) were shaken for different periods of time (from 0 to 780 min) at a pH of 7 and 35 °C. The removal efficiency (Re (%)) and the adsorption capacity (mg g−1) of CFO@SiO2–NH2 for heavy metal ions were calculated by the following equations:| |
 | (1) |
| |
 | (2) |
| |
 | (3) |
| |
 | (4) |
where C0, Ct and Ce (mg L−1) are the concentrations of the ions initially, at time t and at equilibrium, respectively, and qt and qe are the adsorption capacities at time t and at equilibrium, respectively. V is the volume of the adsorbate (L), and m is the mass of the adsorbent (g).
2.7 Regeneration studies
Cd(II), Cu(II) and Pb(II) ions were desorbed by washing the adsorbed CoFe2O4@SiO2–NH2 (20 mg) with 50 mL HCl (0.1 M), respectively. The mixture was stirred continuously in a shaker at 100 rpm for 12 h at 35 °C, and then the concentration of each heavy metal ion in the solution was calculated. The resulting CFO@SiO2–NH2 was used in the next adsorption cycle after being washed and dried.
3 Results and discussion
3.1 Formation mechanism of CoFe2O4@SiO2–NH2 nanospheres
Fig. 1 illustrates the synthesis process of CoFe2O4@SiO2–NH2 nanospheres. Firstly, Fe3+ and Co2+ ions co-precipitate to form CoFe2O4 NPs under alkaline conditions (Fig. 1a). The CoFe2O4 nanocrystals aggregate to some extent owing to the nanoeffect (Fig. 1b). After being modified with citric acid, the obtained CoFe2O4 ferrofluids can be dispersed homogeneously in water (Fig. 1b). Secondly, Si–OH groups obtained from the hydrolysis of TEOS can interact with Fe–OH groups on the surface of CoFe2O4 NPs, and then monodisperse CoFe2O4@SiO2 nanospheres with core–shell structures are formed (Fig. 1c and j). Lastly, silanol groups (Si–OH) on the surface of CoFe2O4@SiO2 react with methyl groups (–CH3) from APTES, which results in amino groups exposed to the outside of CoFe2O4@SiO2 (Fig. 1d and k). The proposed structures of CoFe2O4@SiO2 and CoFe2O4@SiO2–NH2 are presented in Fig. 1j and k, respectively. To confirm the above mechanism, the results of SEM, TEM, XRD and FT-IR analyses are shown in Section 3.2.
3.2 Morphological and structural analysis
The detailed morphological and structural features of pure CoFe2O4, CoFe2O4@SiO2, and CoFe2O4@SiO2–NH2 were examined by SEM and TEM (Fig. 2). Bare CoFe2O4 particles with an average diameter of approximately 10 nm were aggregates composed of a few crystalline grains (Fig. 2d). After being coated with a non-porous silica layer, an obvious core–shell structure can be observed for all the CFO@SiO2 nanospheres, with an electron-dense (dark contrast) CoFe2O4 core and an electron-lean amorphous SiO2 shell (light contrast). The shells were homogeneous and uniform with a mean thickness of ∼35 nm (Fig. 2e). The subsequent amino-functionalization process had no influence on the shape and particle size of CoFe2O4@SiO2–NH2 nanospheres (Fig. 2f and g), in comparison with CFO@SiO2. In Fig. 2, panels (a), (b) and (c) display typical SEM images of CFO NPs, CFO@SiO2 and CFO@SiO2–NH2 nanospheres, respectively. They illustrate that the composites were well dispersed with near-spherical morphology. To investigate the structural details of the cores, HRTEM studies were performed for CFO@SiO2–NH2 (Fig. 2h and i). It was found that there were well-resolved lattice planes in the core of the nanospheres. The result of a fast Fourier transform (FFT) showed that the lattice fringes corresponding to an interplanar distance of ∼2.506 Å can be attributed to the (311) planes of a CoFe2O4 phase (Fig. 2i, inset). Hence, it is clear that CFO is located in the central part of the particle and amorphous SiO2 is homogeneously distributed throughout the whole nanosphere.
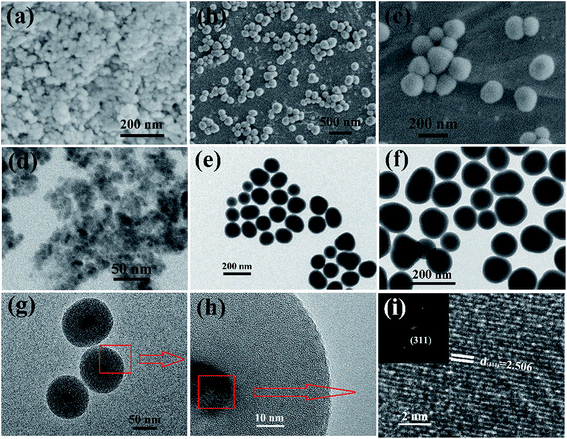 |
| | Fig. 2 SEM and TEM images of (a and d) CFO NPs, (b and e) CFO@SiO2, and (c, f and g) CFO@SiO2–NH2 nanospheres. (h and i) HRTEM images of CFO@SiO2–NH2 nanospheres. (Inset of (i)) fast Fourier transform (FFT) pattern. | |
The phase purity and crystal structure of CFO, CFO@SiO2, and CFO@SiO2–NH2 were determined by XRD (Fig. S1a, ESI†). The diffraction peaks of all samples can be easily indexed to an inverse spinel structure, which matches well with the value in JCPDS no. 01-1121, indicating the formation of a CoFe2O4 phase. The average particle size calculated using the Debye–Scherrer formula from the reflection peak of the (311) planes was about 10 nm, which is consistent with the result measured from the HRTEM image (Fig. 2i). For comparison, an additional broad peak appeared at a 2θ value of 20–28° (red line, blue line), which could correspond to amorphous SiO2. Furthermore, owing to the coating of a silica shell on the surface of CFO NPs,26,49,50 the intensity of the XRD diffraction peaks of CFO@SiO2 and CFO@SiO2–NH2 exhibited a slight decrease. As can be seen, the above results confirm the formation of CoFe2O4 and CoFe2O4@SiO2.
To determine the chemical composition of the samples, FT-IR spectroscopy was carried out (Fig. S1b†). The bands at 882 and 602 cm−1 for bare CoFe2O4 were attributed to Co–O and Fe–O vibrations, respectively, and decreased for CFO@SiO2 and CFO@SiO2–NH2. This demonstrates that CoFe2O4 is in the interior of the composites. The bands at 3440 and 1633 cm−1 in all the spectra were assigned to the stretching and bending vibrations of O–H groups of water.34 In comparison with CFO, new peaks at 1092, 799 and 468 cm−1 were observed in the spectra of CFO@SiO2 and CFO@SiO2–NH2, which correspond to the typical symmetric and bending vibrations of Si–O–Si,51–54 respectively. The spectrum of CFO@SiO2–NH2 nearly possessed the same characteristic bands as CFO@SiO2 except for the decreased intensity of the absorption of free silanol groups at 946 cm−1 (ref. 35 and 55) and the broadened peak at 1092 cm−1. In addition, new bands around 1563–1340 cm−1 were detected for CFO@SiO2–NH2, which can be assigned to the stretching and bending vibrations of amino groups from APTES. X-ray photoelectron spectrometry (XPS) was carried out to further analyze the surface composition of CFO@SiO2 and CFO@SiO2–NH2 nanospheres (Fig. S4†). A N 1s peak was only observed for CFO@SiO2–NH2 at 399.3 eV. All results are in good agreement with the proposed structure of CFO@SiO2 and CFO@SiO2–NH2 (Fig. 1j and k) and also show that the silica shell was amino-functionalized successfully.
3.3 Magnetic properties
Superparamagnetic properties of adsorbents are critical for their practical application. When exposed to a magnetic field, the particles display strong magnetization, but without retaining any magnetism after the removal of the applied magnetic field. Superparamagnetism can prevent them from aggregating in water. Fig. 3b shows magnetic hysteresis loops for CFO NPs, CFO@SiO2 and CFO@SiO2–NH2 core–shell nanospheres. It is apparent that they all displayed superparamagnetic behavior owing to the nanometer-sized CoFe2O4 particles in the core. The saturation magnetization values were measured to be 50.07, 36.10 and 32.92 emu g−1 for CFO NPs, CFO@SiO2 and CFO@SiO2–NH2 core–shell nanospheres, respectively. The decrease in saturation magnetization was related to the surface of CFO being covered by SiO2 and functionalized by APTES. The CFO@SiO2–NH2 core–shell composites can be dispersed in water with slight shaking, which results in a black suspension (0 s). Upon placement of a magnet beside a vial, the materials were quickly attracted to one side of the vial within a few seconds (30 s), leaving the solution transparent. Dynamic pictures are shown in Fig. 3a, and the materials could be well redispersed by shaking once the magnetic field was removed. On the basis of the above magnetism analysis, the amino-functionalized CFO@SiO2 that we prepared would have great potential applications in recycling of the adsorbent.
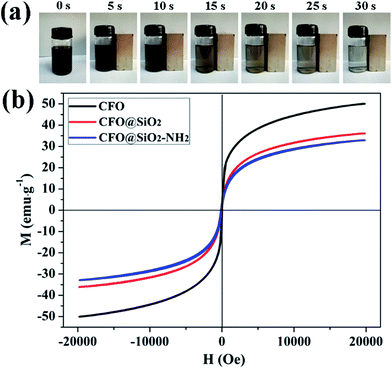 |
| | Fig. 3 (a) Dynamic pictures of magnetic separation process of CFO@SiO2–NH2 and (b) room-temperature (300 K) magnetic hysteresis loops of CFO, CFO@SiO2, and CFO@SiO2–NH2. | |
3.4 Adsorption studies of the amino-functionalized core–shell nanospheres (CFO@SiO2–NH2)
3.4.1 Effect of pH on adsorption of Cu(II) by CFO@SiO2–NH2. The pH is an important factor in the process of adsorption. Experiments were performed at different pH values ranging from 4 to 7, because precipitation of the metal hydroxide may occur when the pH is higher than 7. With an increase in the pH value, the removal efficiency increased from 3.5% to 88.05% (Fig. 4a), and the adsorption capacity increased from 7.0 to 192.02 mg g−1 (Fig. 4b). The results show that the adsorption capacity of CFO@SiO2–NH2 nanospheres toward the heavy metal ions is strong under near-neutral conditions and poor in the highly acidic pH region. At a low pH, H+ ions compete with Cu2+ ions over CFO@SiO2–NH2, which reduces the extent of adsorption. In addition, coulombic repulsion is present between Cu2+ ions and protonated amine groups (–NH3+). As the pH value increased, an increase in the number of –NH2 sites on the surface of the adsorbents resulted in the adsorption of more copper ions. Thus, the maximum adsorption level was observed at a pH of 7 (Fig. 4).
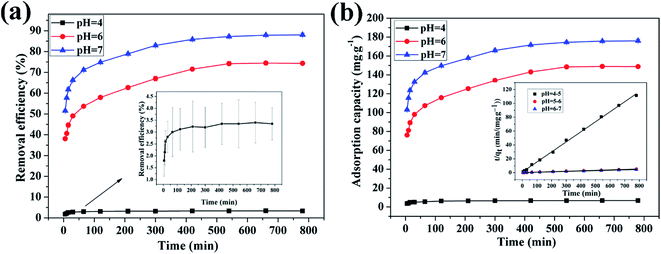 |
| | Fig. 4 Effect of pH on adsorption of Cu(II) by CFO@SiO2–NH2: (a) removal efficiency, (b) adsorption capacity, and (inset of b) pseudo-second-order kinetics plots. | |
3.4.2 Effect of initial concentration on adsorption of Cu(II) by CFO@SiO2–NH2 and study of adsorption isotherms. The effect of the initial concentration of the metal ions on adsorption was investigated via isotherms, which can provide fundamental information on how adsorbents interact with adsorbates.56 Fig. 5 shows the adsorption of Cu(II) on CFO@SiO2–NH2 as a function of its initial concentration (from 20 to 320 mg L−1). With an increase in the initial concentration of Cu(II) ions, the adsorption capacity of CFO@SiO2–NH2 displayed a continuous improvement (Fig. 5a). When the initial concentration was increased to 240 mg L−1, there was no further increase in capacity. The maximum adsorption capacity for Cu(II) was 408.75 mg g−1, which was higher than our previous result. Cu(II) ions could be almost completely removed at an initial concentration of 60 mg L−1 and lower (Fig. 5b). On a further increase in the initial concentration to 320 mg L−1, the removal efficiency gradually decreased. This fact indicates that Cu(II) ions filled the surface space of CoFe2O4@SiO2–NH2 at the critical concentration,31 which resulted in a decline in the removal efficiency at higher concentrations.
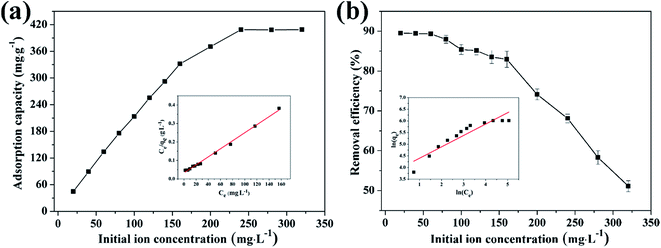 |
| | Fig. 5 Effect of initial concentration on adsorption of Cu(II) by CFO@SiO2–NH2: (a) adsorption capacity, (inset of (a)) Langmuir isotherm plot, (b) removal efficiency, and (inset of (b)) Freundlich isotherm plot. | |
The insets of Fig. 5a and b illustrate the Langmuir and Freundlich isotherm plots, respectively. The corresponding parameters of these models are given in Table 1. The equilibrium sorption data were fitted well to the Langmuir isotherm, yielding a correlation coefficient of R2 = 0.9956. The relation between Ce/qe and Ce displayed good linearity, and thus the adsorption of Cu(II) on CFO@SiO2–NH2 can be regarded as a monolayer adsorption process. In other words, the adsorption process occurred at the sites of amino groups on the surface of CFO@SiO2–NH2. The calculated maximum adsorption capacity for Cu(II) was 410.72 mg g−1, which approximated to the experimental value. The essential characteristic of the Langmuir isotherm can be expressed in terms of the constant separation factor RL, which is also shown in Table 1. The value of RL indicates that the shape of the isotherm is either unfavorable (RL > 1), linear (RL = 1), favorable (0 < RL < 1), or irreversible (RL = 0). The value of RL for the adsorbent was 0.1425 (between 0 and 1), which confirms that the adsorption is a favorable process.
Table 1 Parameters of Langmuir and Freundlich adsorption isotherms for Cu(II) on CFO@SiO2–NH2
| Model |
Equation |
Parameters |
| qm (mg g−1) |
b (L g−1) |
R2 |
RL |
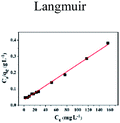 |
 , ,  Ce is the concentration of Cu(II) at equilibrium; qe is the amount of Cu(II) adsorbed at equilibrium; qm is the maximum Langmuir monolayer adsorption capacity; b is the Langmuir constant; C0 is the initial Cu(II) concentration; and RL is a constant separation factor Ce is the concentration of Cu(II) at equilibrium; qe is the amount of Cu(II) adsorbed at equilibrium; qm is the maximum Langmuir monolayer adsorption capacity; b is the Langmuir constant; C0 is the initial Cu(II) concentration; and RL is a constant separation factor |
410.72 |
0.07519 |
0.9956 |
0.1425 |
| Model |
Equation |
Parameters |
| K |
n |
R2 |
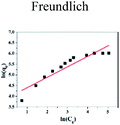 |
 Ce and qe are as above. K and 1/n are the characteristic Freundlich constants Ce and qe are as above. K and 1/n are the characteristic Freundlich constants |
49.91 |
2.05 |
0.8643 |
3.4.3 Effect of reaction temperature on adsorption of Cu(II) by CFO@SiO2–NH2 and study of adsorption thermodynamics. Fig. 6 shows the effect of temperature on the adsorption of Cu(II) by CFO@SiO2–NH2. At the beginning, the adsorption rate increased upon an increase in the reaction temperature. The adsorption capacity increased from 166.94 mg g−1 (35 °C) to 187.48 mg g−1 (55 °C), and the removal efficiency accordingly rose from 83.47% (35 °C) to 93.74% (55 °C). This can be explained by the fact that adsorbed ions move much faster at a high temperature. Then, the contact area between the adsorbent and the metal ions increases, which results in increases in the adsorption capacity and removal efficiency of the adsorbent for metal ions.
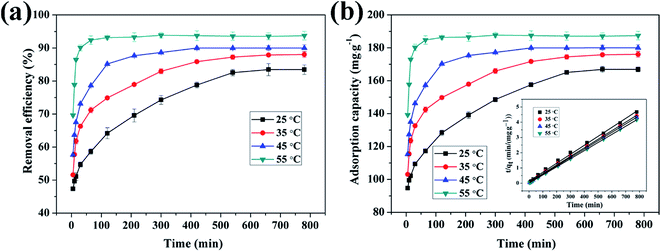 |
| | Fig. 6 Effect of contact temperature on adsorption of Cu(II) by CFO@SiO2–NH2: (a) removal efficiency, (b) adsorption capacity, and (inset of (b)) pseudo-second-order kinetics plots. | |
In order to obtain in-depth information on the inherent energetic changes that are associated with adsorption, the thermodynamic parameters were estimated. The changes in Gibbs energy (ΔG°), enthalpy (ΔH°), and entropy (ΔS°) can be calculated from the following equations:
| |
 | (5) |
| |
 | (6) |
where
Kd is the distribution coefficient,
T (K) is the absolute temperature, and
R is the universal gas constant (8.314 J mol
−1 K
−1). The values of Δ
H° (kJ mol
−1) and Δ
S° (kJ mol
−1) can be calculated from the slope and intercept of a plot of ln
![[thin space (1/6-em)]](https://www.rsc.org/images/entities/char_2009.gif) Kd versus
Kd versus 1/
T, as shown in
Fig. 7. The thermodynamic parameters (Δ
G°, Δ
H° and Δ
S°) are shown in Table S1.
† The value of Δ
H° is positive, which indicates that the adsorption process of the heavy metal on the adsorbent is endothermically driven. When 5 < Δ
H° < 10 kJ mol
−1, it denotes that the adsorption mechanism is physisorption; when 30 < Δ
H° < 70 kJ mol
−1, the adsorption mechanism is chemisorption. As shown in Table S1,
† the value of Δ
H° (36.607 kJ mol
−1) indicated that chemical adsorption was the major process involved in the adsorption of Cu(
II) on the CFO@SiO
2–NH
2 magnetic adsorbent. In addition, the value of Δ
S° was also positive owing to the complexation of amino groups on the surface of the nanospheres with more mobile metal ions, which would cause an increase in entropy during the adsorption process. Furthermore, the Δ
G° values at 298 K, 308 K, 318 K and 328 K were −3.098, −4.431, −5.763 and −7.096 kJ mol
−1, respectively. A negative value of Δ
G° indicates that the adsorption process is spontaneous. It also reveals that a more negative Δ
G° value reflects a greater driving force of adsorption, which results in faster adsorption performance and a higher adsorption capacity. The results were also fitted with the above discussion (
Fig. 6).
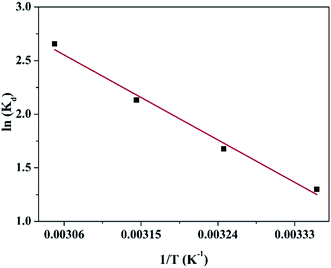 |
| | Fig. 7 Linear dependence of ln![[thin space (1/6-em)]](https://www.rsc.org/images/entities/char_2009.gif) Kd on 1/T based on the adsorption thermodynamics. Kd on 1/T based on the adsorption thermodynamics. | |
3.4.4 Effect of reaction time on adsorption of Cu(II), Cd(II) and Pb(II) ions by CFO@SiO2–NH2. The contact time between the adsorbent and adsorbate is also an important parameter that plays a vital role in the adsorption process. Fig. 8 shows the adsorption of Cu(II), Cd(II), and Pb(II) ions on CFO@SiO2–NH2 as a function of the contact time. The adsorption tendency of the three ions was similar. The removal efficiency for Cu(II) and Cd(II) rose sharply within the initial 60 min and then increased slowly for another 240 min. Finally, it remained constant even when the contact time was extended to 780 min (Fig. 8a). Furthermore, the adsorption of Pb(II) on CFO@SiO2–NH2 reached equilibrium after 30 min, which was faster than Cu(II) and Cd(II). The rapid adsorption rate during the initial stages may mainly be attributed to the unique complexation between the heavy metal ions and the amine functionalities of the SiO2 shell on CoFe2O4 NPs. The adsorption capacities of CFO@SiO2–NH2 for Cd(II), Cu(II) and Pb(II) were 199.9, 177.8 and 181.6 mg g−1, respectively (Fig. 8b), which were comparable to the best reported value. The adsorption capacities for Cd(II), Cu(II) and Pb(II) of other representative materials are summarized in Table 2.23,31,36,57,58
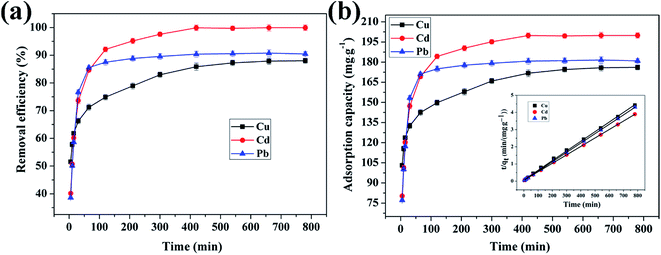 |
| | Fig. 8 Effect of contact time on adsorption of heavy metal ions (Cu(II), Cd(II), and Pb(II)) by CFO@SiO2–NH2: (a) removal efficiency, (b) adsorption capacity, and (inset of (b)) pseudo-second-order kinetics plots. | |
Table 2 Comparison of adsorption capacities of various adsorbents for Cd(II), Cu(II) and Pb(II) ions
| Adsorbent |
Adsorption capacity for heavy metal ions (mg g−1) |
Ref. |
| Cd(II) |
Cu(II) |
Pb(II) |
| Modified magnetic mesoporous silica MCM-18 |
114.08 |
125.80 |
127.24 |
23 |
| Sulfhydryl-functionalized hydrogel |
17.7 |
9.3 |
31.3 |
57 |
| Ni@Mg(OH)2 core–shell nanocomposites |
44.98 |
40.18 |
— |
31 |
| Amino-functionalized Fe3O4@SiO2 magnetic nanomaterial |
— |
29.9 |
76.7 |
36 |
| Magnetic Fe3O4 baker's yeast biomass |
22.5 |
— |
88.2 |
58 |
| CFO@SiO2–NH2 nanospheres |
199.9 |
177.8 |
181.6 |
Present work |
3.4.5 Study of adsorption kinetics. To study the mechanism of adsorption kinetics in depth, two well-known adsorption models, namely, the pseudo-first-order and pseudo-second-order kinetics models, were used to investigate the dynamics of the adsorption process. It was found that the pseudo-second-order model fits the adsorption of heavy metal ions on CFO@SiO2–NH2 better than the pseudo-first-order model. The pseudo-second-order equation is eqn (8):| |
 | (8) |
where qe and qt (mg g−1) are the adsorption capacities at equilibrium and time t, respectively, and k2 in eqn (8) is the pseudo-second-order rate constant (g mg−1 min−1). Linear fits based on eqn (8) have been plotted in the insets of Fig. 4b, 6b and 8b, respectively. The calculated kinetics parameters and correlation coefficients (R2) are given in Table 3. The best fit of the pseudo-second-order model suggests that a chemisorption mechanism was involved in the adsorption,59,60 which is further supported by the adsorption thermodynamics (Section 3.4.3). Furthermore, small differences between the experimental (qe (exp.)) and calculated (qe (cal.)) values of the equilibrium adsorption capacity were also observed, and the pseudo-second-order model gave a better fit with the experimental data (Table 3).
Table 3 Parameters of pseudo-second-order kinetics model for the adsorption of Cu(II), Cd(II) and Pb(II) on CFO@SiO2–NH2
| Metal |
pH |
Temperature (°C) |
Removal efficiency (%) |
qe (exp.) (mg g−1) |
k2 (g mg−1 min−1) |
qe (cal.) (mg g−1) |
R2 |
| Cu(II) |
7 |
35 |
88.05 ± 0.838 |
177.8 ± 1.675 |
0.000401 |
178.891 |
0.99897 |
| Cd(II) |
99.95 ± 0.989 |
199.9 ± 1.978 |
0.000453 |
201.252 |
0.99994 |
| Pb(II) |
90.79 ± 1.184 |
181.6 ± 2.367 |
0.000848 |
183.150 |
0.99997 |
| Cu(II) |
4 |
35 |
3.50 ± 0.672 |
7.0 ± 1.344 |
0.02043 |
6.922 |
0.99864 |
| 6 |
74.50 ± 0.860 |
149.0 ± 1.719 |
0.000306 |
151.975 |
0.99747 |
| 7 |
88.05 ± 0.838 |
177.8 ± 1.675 |
0.000401 |
178.891 |
0.99897 |
| Cu(II) |
7 |
25 |
83.47 ± 0.731 |
166.9 ± 1.462 |
0.000263 |
169.780 |
0.99683 |
| 35 |
88.05 ± 0.838 |
177.8 ± 1.675 |
0.000401 |
178.891 |
0.99897 |
| 45 |
90.00 ± 0.748 |
180.1 ± 1.495 |
0.000885 |
181.818 |
0.99940 |
| 55 |
93.74 ± 1.288 |
187.5 ± 2.575 |
0.004364 |
187.617 |
0.99999 |
3.5 Regeneration and recyclability
The recyclability of adsorbents is highly important for their practical application. On the basis of the analysis of the effect of pH on the adsorption of heavy metal ions, we adopted the method of acid treatment to regenerate the adsorbent. Fig. 9 shows the removal efficiency of CFO@SiO2–NH2 nanospheres for the adsorption of Cd(II), Cu(II) and Pb(II) after five stages of recycling. The removal efficiency in the first cycle was found to be 99.85%, 87.80% and 90.10%, respectively. The adsorption capacities slightly decreased with an increase in the number of cycles: after four cycles of adsorption, the adsorption efficiency for Cd(II), Cu(II) and Pb(II) was around 97.25%, 84.15% and 87.12%, respectively. This indicates that the adsorbent can be used at least five times with high adsorption efficiency. It can be deduced that the CFO@SiO2–NH2 magnetic adsorbent has excellent desorption ability and can be recycled easily from wastewater using a magnetic field owing to its good magnetic response. All these conclusions illustrate that the CFO@SiO2–NH2 core–shell nanospheres can be used as a high-performance adsorbent for application in the field of removal of heavy metal ions.
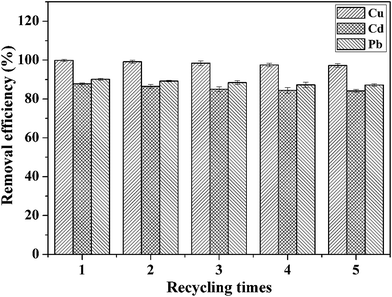 |
| | Fig. 9 Removal efficiency of CFO@SiO2–NH2 for the adsorption of different heavy metal ions over five cycles of use. | |
4 Conclusions
In summary, a monodisperse amino-functionalized magnetic CoFe2O4@SiO2 nanosphere was successfully fabricated. The sphere had a core–shell structure with a magnetic CoFe2O4 core (∼10 nm), a non-porous silica layer (∼35 nm) and an amino-functionalized layer. The monodisperse nanosphere can graft many more amino groups, which can improve its adsorption performance for heavy metal ions. The effects of the pH, initial concentration, reaction temperature and time on the adsorption of heavy metal ions by CoFe2O4@SiO2–NH2 were analyzed systematically. The adsorption process on the nanospheres was well described by the Langmuir model, and the adsorption kinetics can be best fitted by the pseudo-second-order kinetics model. Analysis of a thermodynamic study of Cu(II) showed that the process of adsorption was spontaneous and endothermic in nature. After acid treatment, the as-synthesized adsorbent could be regenerated and reused for up to five cycles with high chemical stability. The superparamagnetism possessed by the adsorbent makes it easy to remove from the reaction system. Therefore, the monodisperse nanospheres can be employed as an adsorbent with excellent performance in the field of the removal of heavy metal ions.
Acknowledgements
This work was supported by the National High-Tech Research and Development Program of China (863 Program) (No. 2015AA034701) and the Fundamental Research Funds for the Central Universities (No. 2008QNA4008).
References
- F. Fu and Q. Wang, J. Environ. Manage., 2011, 92, 407–418 CrossRef CAS PubMed.
- M. Hua, S. Zhang, B. Pan, W. Zhang, L. Lv and Q. Zhang, J. Hazard. Mater., 2012, 211–212, 317–331 CrossRef CAS PubMed.
- V. K. Gupta, I. Ali, T. A. Saleh, A. Nayak and S. Agarwal, RSC Adv., 2012, 2, 6380–6388 RSC.
- D. Kolodyńska, M. Kowalczyk and Z. Hubicki, J. Mater. Sci., 2014, 49, 2483–2495 CrossRef.
- D. Vilela, J. Parmar, Y. F. Zeng, Y. L. Zhao and S. Sánchez, Nano Lett., 2016, 16, 2860–2866 CrossRef CAS PubMed.
- C. J. Madadrang, H. Y. Kim, G. Gao, N. Wang, J. Zhu, H. Feng, M. Gorring, M. L. Kasner and S. Hou, ACS Appl. Mater. Interfaces, 2012, 4, 1186–1193 CAS.
- C. T. Nguyen, P. Loganathan, T. V. Nguyen, S. Vigneswaran, J. Kandasamy and R. Naidu, Chem. Eng. J., 2015, 270, 393–404 CrossRef.
- E. Eren, J. Hazard. Mater., 2008, 159, 235–244 CrossRef CAS PubMed.
- T. Phuengprasop, J. Sittiwong and F. Unob, J. Hazard. Mater., 2011, 186, 502–507 CrossRef CAS PubMed.
- A. T. Paulino, L. A. Belfiore, L. T. Kubota, E. C. Muniz, V. C. Almeida and E. B. Tambourgi, Desalination, 2011, 275, 187–196 CrossRef CAS.
- L. Tang, G. M. Zeng, G. L. Shen, Y. P. Li, Y. Zhang and D. L. Huang, Environ. Sci. Technol., 2008, 42, 1207–1212 CrossRef CAS PubMed.
- K. A. Krishnan, Colloids Surf., A, 2008, 317, 344–351 CrossRef CAS.
- C. S. Sundaram, N. Viswanathan and S. Meenakshi, J. Hazard. Mater., 2009, 163, 618–624 CrossRef PubMed.
- L. M. Nikolenko, A. V. Ivanchihina, S. B. Brichkin and V. F. Razumov, J. Colloid Interface Sci., 2009, 332, 366–372 CrossRef CAS PubMed.
- S. A. Cetinus, E. Sahin and D. Saraydin, Food Chem., 2009, 114, 962–969 CrossRef CAS.
- V. Asokbunyarat, E. D. van Hullebusch, P. N. L. Lens and A. P. Annachhatre, Water, Air, Soil Pollut., 2015, 226, 143 CrossRef.
- D. V. Quang, J. K. Kim, P. B. Sarawade, D. H. Tuan and H. T. Kim, J. Ind. Eng. Chem., 2012, 18, 83–87 CrossRef CAS.
- R. D. Ambashta and M. Sillanpää, J. Hazard. Mater., 2010, 180, 38–49 CrossRef CAS PubMed.
- Y. Q. Tan, M. Chen and Y. M. Hao, Chem. Eng. J., 2012, 191, 104–111 CrossRef CAS.
- H. V. Tran, L. D. Tran and T. N. Nguyen, Mater. Sci. Eng., C, 2010, 30, 304–310 CrossRef CAS.
- X. Chen, K. F. Lam and K. L. Yeung, J. Chem. Eng. Data, 2011, 172, 728–734 CrossRef CAS.
- C. T. Yavuz, A. Prakash, J. T. Mayo and V. L. Colvin, Chem. Eng. Sci., 2009, 64, 2510–2521 CrossRef CAS.
- M. Anbia, K. Kargosha and S. Khoshbooei, Chem. Eng. Res. Des., 2015, 93, 779–788 CrossRef CAS.
- F. Zhang, J. Lan, Z. S. Zhao, Y. Yang, R. Q. Tan and W. J. Song, J. Colloid Interface Sci., 2012, 387, 205–212 CrossRef CAS PubMed.
- Q. Q. Qu, L. Zhou, S. G. Zhao, H. J. Geng, J. J. Hao, Y. Y. Xu, H. L. Chen and X. G. Chen, Chem. Eng. J., 2012, 180, 121–127 CrossRef.
- M. F. Shao, F. Y. Ning, J. W. Zhao, M. Wei, G. E. David and X. Duan, J. Am. Chem. Soc., 2012, 134, 1071–1077 CrossRef CAS PubMed.
- S. Venkateswarlu and M. Yoon, ACS Appl. Mater. Interfaces, 2015, 7, 25362–25372 CAS.
- Z. U. Rahman, Y. L. Dong, L. Su, Y. H. Ma, H. J. Zhang and X. G. Chen, Chem. Eng. J., 2013, 222, 382–390 CrossRef.
- Y. M. Liu, X. J. Ju, Y. Xin, W. C. Zhang, W. Wang, J. Wei, R. Xie, Z. Liu and L. Y. Chu, ACS Appl. Mater. Interfaces, 2014, 6, 9530–9542 CAS.
- T. Wu, Y. Liu, X. Zeng, T. T. Cui, Y. T. Zhao, Y. N. Li and G. X. Tong, ACS Appl. Mater. Interfaces, 2016, 8, 7370–7380 CAS.
- M. Zhang, W. Q. Song, Q. L. Chen, B. J. Miao and W. C. He, ACS Appl. Mater. Interfaces, 2015, 7, 1533–1540 CAS.
- C. Q. Yang, G. Wang, Z. Y. Lu, J. Sun, J. Q. Zhuang and W. S. Yang, J. Mater. Chem., 2005, 15, 4252–4257 RSC.
- A. L. Morel, S. I. Nikitenko, K. Gionnet, A. Wattiaux, J. Lai-Kee-Him, C. Labrugere, B. Chevalier, G. Deleris, C. Petibois, A. Brisson and M. Simonoff, ACS Nano, 2008, 2, 847–856 CrossRef CAS PubMed.
- Z. J. Xu, W. Li, Z. D. Xiong, J. L. Fang, Y. G. Li, Q. Wang and Q. F. Zeng, Desalin. Water Treat., 2015, 57, 7054–7065 CrossRef.
- N. M. Mahmoodi, S. Khorramfar and F. Najafi, Desalination, 2011, 279, 61–68 CrossRef CAS.
- J. H. Wang, S. R. Zheng, Y. Shao, J. L. Liu, Z. Y. Xu and D. Q. Zhu, J. Colloid Interface Sci., 2012, 387, 205–212 CrossRef PubMed.
- J. M. Zhang, S. R. Zhai, B. Zhai, Q. D. An and G. Tian, J. Sol-Gel Sci. Technol., 2012, 64, 347–357 CrossRef CAS.
- J. M. Zhang, S. R. Zhai, S. Li, Z. Y. Xiao, Y. Song, Q. D. An and G. Tian, Chem. Eng. J., 2013, 215–216, 461–471 CrossRef CAS.
- Q. Yuan, N. Li, Y. Chi, W. C. Geng, W. F. Yan, Y. Zhao, X. T. Li and B. Dong, J. Hazard. Mater., 2013, 254–255, 157–165 CrossRef CAS PubMed.
- G. Jacintho, A. G. Brolo, P. Corio, P. Suarez and J. C. Rubim, J. Phys. Chem. C, 2009, 113, 7684–7691 CAS.
- D. Tang, R. Yuan, Y. Chai and H. An, Adv. Funct. Mater., 2007, 17, 976–982 CrossRef CAS.
- X. Z. Ren, J. H. Shi, L. Z. Tong, Q. H. Li and H. Yang, J. Nanopart. Res., 2013, 15, 1–10 Search PubMed.
- L. J. Zhao, H. J. Zhang, L. Zhou, Y. Xing, S. Y. Song and Y. Q. Lei, Chem. Commun., 2008, 30, 3570–3572 RSC.
- J. Hu, I. M. C. Lo and G. H. Chen, Sep. Purif. Technol., 2007, 56, 249–256 CrossRef CAS.
- F. B. Zhao, Y. C. Zou, X. J. Lv, H. W. Liang, Q. Jia and W. K. Ning, J. Chem. Eng. Data, 2015, 60, 1338–1344 CrossRef CAS.
- B. Viltužnik, A. Košak, Y. L. Zub and A. Lobnik, J. Sol-Gel Sci. Technol., 2013, 68, 365–373 CrossRef.
- B. Viltužnik, A. Lobnik and A. Košak, J. Sol-Gel Sci. Technol., 2015, 74, 199–207 CrossRef.
- C. R. Ren, X. G. Ding, H. Q. Fu, C. Meng, J. C. Zhao, W. Q. Li and H. Yang, RSC Adv., 2016, 6, 72479–72486 RSC.
- L. Sun, Y. X. Li, M. D. Sun, H. G. Wang, S. F. Xu, C. Q. Zheng and Q. B. Yang, New J. Chem., 2011, 35, 2697–2704 RSC.
- L. L. Yang, P. Zou, J. Cao, Y. F. Sun, D. L. Han, S. Yang, G. Chen, X. W. Kong and J. H. Yang, Superlattices Microstruct., 2014, 76, 205–212 CrossRef CAS.
- Q. Chang, L. Zhu, C. Yu and H. Tang, J. Lumin., 2008, 128, 1890–1895 CrossRef CAS.
- Q. Wang, W. Gao, Y. Liu, J. Yuan, Z. Xu, Q. Zeng and Y. Li, Chem. Eng. J., 2014, 250, 55–65 CrossRef CAS.
- A. A. Atia, A. M. Donia and W. A. Al-Amrani, Chem. Eng. J., 2009, 150, 55–62 CrossRef CAS.
- S. Lan, X. Wu, L. Li, M. Li, F. Guo and S. Gan, Colloids Surf., A, 2013, 425, 42–50 CrossRef CAS.
- A. M. Donia, A. A. Atia, W. A. Al-amrani and A. M. El-Nahas, J. Hazard. Mater., 2009, 161, 1544–1550 CrossRef CAS PubMed.
- Z. F. Jiang, J. M. Xie, D. L. Jiang, Z. X. Yan, J. J. Jing and D. Liu, Appl. Surf. Sci., 2014, 292, 301–310 CrossRef CAS.
- R. Hua and Z. K. Li, Chem. Eng. J., 2014, 249, 189–200 CrossRef CAS.
- M. Xu, Y. S. Zhang, Z. M. Zhang, Y. O. Shen, M. J. Zhao and G. T. Pan, Chem. Eng. J., 2011, 168, 737–745 CrossRef CAS.
- E. Rosales, M. Pazos, M. A. Sanromán and T. Tavares, Desalination, 2012, 284, 150–156 CrossRef CAS.
- S. Wang, J. Wei, S. S. Lv, Z. Y. Guo and F. Jiang, Clean: Soil, Air, Water, 2013, 41, 992–1001 CAS.
Footnote |
| † Electronic supplementary information (ESI) available. See DOI: 10.1039/c6ra27728d |
|
| This journal is © The Royal Society of Chemistry 2017 |
Click here to see how this site uses Cookies. View our privacy policy here.  Open Access Article
 *ab,
Huiqin Fua,
Wenqi Lia,
Huating Wua and
Hui Yangab

![[thin space (1/6-em)]](https://www.rsc.org/images/entities/char_2009.gif) :
:![[thin space (1/6-em)]](https://www.rsc.org/images/entities/char_2009.gif) 1 were dissolved in 100 mL deionized water and stirred at 70 °C. This solution was marked as solution A. Secondly, PEG (6000) as a dispersant was added to 150 mL ammonium hydroxide (NH3·H2O, 2.0 M) under vigorous stirring at 70 °C. This solution was marked as solution B. Thirdly, solution A was added dropwise to solution B under stirring for 1 h. The mixed solutions were refluxed for 2 h under the conditions of a boiling water bath. Fourthly, the resulting black precipitate was magnetically separated, washed with deionized water until the pH reached 7, dried in a vacuum at 80 °C for 12 h, and subsequently sintered at 350 °C for 12 h to drive out residual carbon. Finally, the prepared CFO magnetic NPs (0.3 g) were dispersed via sonication in 200 mL citric acid solution (0.1 M). The magnetic NPs that were modified by citric acid were collected by magnetic separation, washed three times with ethanol, dispersed in a mixture of ethanol (200 mL) and deionized water (50 mL) by sonication for 2 h, and stored in a 500 mL vial until further use. This solution was marked as solution C.
1 were dissolved in 100 mL deionized water and stirred at 70 °C. This solution was marked as solution A. Secondly, PEG (6000) as a dispersant was added to 150 mL ammonium hydroxide (NH3·H2O, 2.0 M) under vigorous stirring at 70 °C. This solution was marked as solution B. Thirdly, solution A was added dropwise to solution B under stirring for 1 h. The mixed solutions were refluxed for 2 h under the conditions of a boiling water bath. Fourthly, the resulting black precipitate was magnetically separated, washed with deionized water until the pH reached 7, dried in a vacuum at 80 °C for 12 h, and subsequently sintered at 350 °C for 12 h to drive out residual carbon. Finally, the prepared CFO magnetic NPs (0.3 g) were dispersed via sonication in 200 mL citric acid solution (0.1 M). The magnetic NPs that were modified by citric acid were collected by magnetic separation, washed three times with ethanol, dispersed in a mixture of ethanol (200 mL) and deionized water (50 mL) by sonication for 2 h, and stored in a 500 mL vial until further use. This solution was marked as solution C.


![[thin space (1/6-em)]](https://www.rsc.org/images/entities/char_2009.gif) Kd versus 1/T, as shown in Fig. 7. The thermodynamic parameters (ΔG°, ΔH° and ΔS°) are shown in Table S1.† The value of ΔH° is positive, which indicates that the adsorption process of the heavy metal on the adsorbent is endothermically driven. When 5 < ΔH° < 10 kJ mol−1, it denotes that the adsorption mechanism is physisorption; when 30 < ΔH° < 70 kJ mol−1, the adsorption mechanism is chemisorption. As shown in Table S1,† the value of ΔH° (36.607 kJ mol−1) indicated that chemical adsorption was the major process involved in the adsorption of Cu(II) on the CFO@SiO2–NH2 magnetic adsorbent. In addition, the value of ΔS° was also positive owing to the complexation of amino groups on the surface of the nanospheres with more mobile metal ions, which would cause an increase in entropy during the adsorption process. Furthermore, the ΔG° values at 298 K, 308 K, 318 K and 328 K were −3.098, −4.431, −5.763 and −7.096 kJ mol−1, respectively. A negative value of ΔG° indicates that the adsorption process is spontaneous. It also reveals that a more negative ΔG° value reflects a greater driving force of adsorption, which results in faster adsorption performance and a higher adsorption capacity. The results were also fitted with the above discussion (Fig. 6).
Kd versus 1/T, as shown in Fig. 7. The thermodynamic parameters (ΔG°, ΔH° and ΔS°) are shown in Table S1.† The value of ΔH° is positive, which indicates that the adsorption process of the heavy metal on the adsorbent is endothermically driven. When 5 < ΔH° < 10 kJ mol−1, it denotes that the adsorption mechanism is physisorption; when 30 < ΔH° < 70 kJ mol−1, the adsorption mechanism is chemisorption. As shown in Table S1,† the value of ΔH° (36.607 kJ mol−1) indicated that chemical adsorption was the major process involved in the adsorption of Cu(II) on the CFO@SiO2–NH2 magnetic adsorbent. In addition, the value of ΔS° was also positive owing to the complexation of amino groups on the surface of the nanospheres with more mobile metal ions, which would cause an increase in entropy during the adsorption process. Furthermore, the ΔG° values at 298 K, 308 K, 318 K and 328 K were −3.098, −4.431, −5.763 and −7.096 kJ mol−1, respectively. A negative value of ΔG° indicates that the adsorption process is spontaneous. It also reveals that a more negative ΔG° value reflects a greater driving force of adsorption, which results in faster adsorption performance and a higher adsorption capacity. The results were also fitted with the above discussion (Fig. 6).


