DOI:
10.1039/C6RA27383A
(Paper)
RSC Adv., 2017,
7, 6902-6910
Pb electrodeposition from PbO in the urea/1-ethyl-3-methylimidazolium chloride at room temperature
Received
26th November 2016
, Accepted 13th January 2017
First published on 20th January 2017
Abstract
In this study, we dissolved PbO in a new electrolyte urea/1-ethyl-3-methylimidazolium chloride (EMIC) and electrochemically extracted Pb. The electrochemical behavior of lead was investigated using chronoamperometric and cyclic voltammetric techniques. The cyclic voltammograms illustrated that lead reduction is quasi-reversible and follows a single-step, two-electron transfer process. The chronoamperometric experiments showed that lead reduction in the PbO–urea/EMIC system follows a 3D instantaneous nucleation and a diffusion-controlled growth at 353 K. The diffusion coefficient was 1.67 × 10⁻⁸ cm2 s−1. The effect of temperature on the electrochemical behavior of lead was investigated. Results showed that electrode reaction becomes more reversible as temperature increases from 343 to 373 K. The diffusion coefficients increase with increasing temperature and obey the Arrhenius' law. The activation energy is estimated to be 38 kJ mol−1. Electrodeposition experiments were conducted on tungsten substrates at different negative potentials and various temperatures. Scanning electron microscopy (SEM) images of electrodeposits showed that the Pb particles became smaller and are more densely distributed at more negative potentials and higher temperatures. The obtained electrodeposits were metallic lead, as verified by X-ray diffraction (XRD) and energy dispersive spectroscopy (EDS).
1. Introduction
Lead is a useful material and is often used in automotive lead-acid batteries,1 semiconductors,2,3 and industrial X-ray shields.4 Conventionally, lead ore is processed by flotation and roasting forming PbO. Lead metal is extracted from the PbO by a high-temperature reduction in a coke-fired furnace.5,6 However, this conventional extraction method requires high temperatures. Therefore, researchers have investigated the extraction of lead from aqueous solutions at a relatively low temperature. These aqueous solutions can be divided into two types: alkaline7–10 and acid (nitrate,11,12 iodide,13 bromide,13 acetate,14 and methanesulfonate15). For example, Abrantes reported on an alkaline solution (NaOH) that was applied to lead electrodeposition.8 Yao prepared lead nanoparticles from an acid aqueous solution (Pb(CH3CO2)2–CH3CO2NH4–H3BO3) by adjusting the pH, current density, deposition time and substrate materials.16 Although lead electrodeposition has been successfully conducted in alkaline and acid aqueous solutions, hydrogen evolution on the electrode is inevitable in these systems, which decreases current efficiency and causes massive hydrogen embrittlement in lead products. Therefore, in this study, we attempted to electrodeposit lead metal using PbO as the lead source in a new ionic liquid urea/EMIC at 353 K.
Room temperature ionic liquids (RTILs) have been a research focus due to their hydrogen-free evolution, low temperatures, non-flammability and negligible vapor pressure.17–19 RTILs can be considered as alternative electrolytes in the lead electrodeposition process. Katayama et al.20 reported on 1-butyl-1-methylpyrrolidinium bis(trifluoromethylsulfonyl)amide (BMPTFSA). Results showed that the difference of formal potential between lead and tin was 0.11 V, indicating that it is possible to separate lead from mixtures of lead and tin salts in BMPTFSA. Bhatt et al.21 electrodeposited lead metal on a glassy carbon from a DIMCARB ionic liquid (a mixture of dimethylamine and carbon dioxide). Wang et al.22 investigated the electrochemical behavior of lead in 1-butyl-3-methylimidazolium chloride–AlCl3 system, illustrating a 3D nucleation model and diffusion-controlled growth for lead deposition. They reported that three phenomena (terrace expansion, island growth and monolayer formation) and a moiré-like pattern of lead adatoms were discovered with scanning tunneling microscopy. Similarity, Sun group23 investigated 1-ethyl-3-methylimidazolium tetrafluoroborate for its ability to electrodeposit lead metal. Simons et al.24 reported lead electrodeposition from 1-ethyl-3-methylimidazolium bis(trifluoromethanesulfonyl)imide. The results revealed that the morphology of deposits was affected by the substrate material. These RTILs used lead salts (Pb(NO3)2, PbCl2, Pb(NTf2)2) as lead sources. However, the lead salts are extremely toxic to humans.25 Therefore, as an alternative, we attempt to use PbO as a lead source during electrolysis. However, most metal oxides are not soluble in molecular solvents except aqueous acids or alkalis. Thus, some task-specific solvents have been investigated to dissolve metal oxides. Hua group37 have prepared various morphologies of Pb powders in PbO–choline chloride/urea (ChCl/urea) system. As increasing of PbO concentration from 10 to 60 mM, different morphologies, including corals, rods, wires, needles and ferns, and dendritic forms, were discovered respectively. Reddy38 electrodeposited Pb metal from PbO–ChCl/urea system and made fundamental studies on electrochemical behavior of lead in this system, including diffusion coefficient, activation energy, nucleation/growth model, and morphology characteristics. Sun group39 reported that water-insoluble Pb compounds (PbSO4, PbO2, and PbO) have an acceptable solubility in ChCl/urea. Therefore, Sun group used ChCl/urea as an electrolyte to recycle Pb metal from Pb compounds. This may provide a method to dissolve the electrodes used in lead-acid batteries. Hua group40 have prepared sub-micrometer lead wires in PbO–ChCl/urea system at 343 K. The reduction of Pb(II) in this system is a diffusion controlled quasi-reversible process at 323 to 343 K. However, to date, the electroreduction and nucleation mechanisms of lead in PbO–urea/EMIC system have not been elucidated. In this study, urea/EMIC electrolyte was able to selectively dissolve lead oxides to support lead electrodeposition. Recently, EMIC has been used as an electrolyte in batteries due to its cost-effectiveness, high capacity and safety.26 Therefore, in this research, we attempt to electrodeposit lead metal from the PbO–urea/EMIC system, which may provide a potential application for lead storage batteries.
In this study, PbO was dissolved in urea/EMIC as a lead source to support the lead electrochemical experiments. The electrochemical behavior of lead in this electrolyte was investigated using cyclic voltammetry (CV) and chronoamperometry. The effect of temperature on the electrochemical behavior of lead was investigated. The electrodeposits were characterized by XRD, EDS and SEM.
2. Experimental
2.1 Chemicals and materials
EMIC (Lanzhou Institute of Chemical Physics China, >98%) was purified before the experiment.27 Urea (Sinopharm Chemical Reagent Co., Ltd, China, 99%) and PbO (Sinopharm Chemical Reagent Co., Ltd, China, 99.99%) were dried according to a procedure in a previous literature.28 Tungsten foils (99.99%, 0.3 mm thick) were used as the substrates for electrodeposition. Urea and EMIC were mixed in a molar ratio of 2![[thin space (1/6-em)]](https://www.rsc.org/images/entities/char_2009.gif) :1 and dissolved in a beaker at 353 K until a homogeneous, colorless transparent liquid was obtained. Moreover, 45 mmol PbO was added into this liquid that was continuously stirred to ensure complete PbO dissolution. A PbO–urea/EMIC electrolyte was resulting product. All the above mixing steps were performed in a glove box (H2O: 0.1 ppm, O2: 0.1 ppm).
:1 and dissolved in a beaker at 353 K until a homogeneous, colorless transparent liquid was obtained. Moreover, 45 mmol PbO was added into this liquid that was continuously stirred to ensure complete PbO dissolution. A PbO–urea/EMIC electrolyte was resulting product. All the above mixing steps were performed in a glove box (H2O: 0.1 ppm, O2: 0.1 ppm).
2.2 Electrodeposition of Pb
Electrochemical experiments were performed in a three-electrode cell using a potentiostat and galvanostat (AUTOLAB, Metrohm PGSTAT 30, Switzerland) controlled by GPES software.29 For voltammetric and amperometric experiments, a tungsten wire (0.05 cm in diameter) was used as the working electrode, a platinum wire (0.05 cm in diameter) and a silver wire (0.05 cm in diameter) were used as the counter electrode and the quasi-reference electrode, respectively. All the electrodes in the electrochemical cell were polished with emery paper, degreased with an anhydrous alcohol solution in an ultrasonic bath, and cleaned with doubly deionized water before use. For the electrodeposition experiments of Pb, tungsten foils (0.55 cm2) were used as the working electrode. The counter electrode and the quasi-reference electrode are identical to that used in voltammetric and amperometric experiments. The electrodeposition experiments were conducted via potentiostatic electrolysis in the glove box. After electrodeposition, electrodeposits were obtained on the tungsten substrates. The electrolyte adhered to the surface of the electrodeposits was cleaned with anhydrous alcohol. The phase constitution and morphology of the electrodeposits were detected using XRD (PANalytical MPDDY 2094, the Netherlands) and an SEM instrument (ZEISS ULTRA-43-13, Germany) equipped with an EDS (X-Max 50, Oxford).
3. Results and discussion
3.1 Cyclic voltammograms
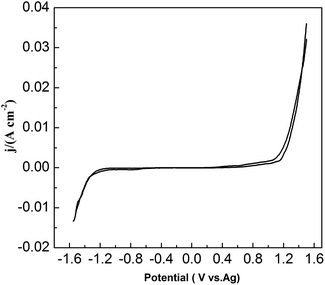
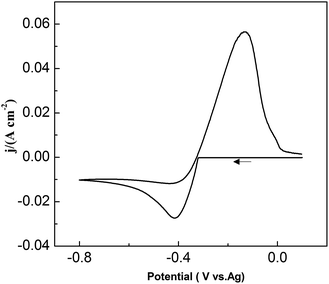
To study the chemical behavior of lead in urea/EMIC, CV was recorded using a tungsten working electrode at 353 K (Fig. 1). The potential window of the blank electrolyte (urea/EMIC in 2:1 molar ratio) was up to approximately 2.7 V. No any redox peaks were discovered during this potential window, indicating that the urea/EMIC was electrochemically stable in this potential range. After PbO was added and dissolved into the blank electrolyte, a reduction peak appeared at approximately −0.416 V while a single oxidation peak occurred near −0.132 V (vs. Ag), as shown in Fig. 2. Both redox peaks appeared within the potential window range. The reduction peak is assigned to the deposition of lead and the oxidation peak was related to the stripping of lead deposited in the previous negative scan.
 |
| | Fig. 1 Cyclic voltammograms of blank electrolyte (urea/EMIC in 2:1 molar ratio) using a tungsten working electrode at 353 K. The scan rate was 0.05 V s−1. | |
 |
| | Fig. 2 Cyclic voltammograms of the urea/EMIC (2:1 molar ratio) containing 45 mmol PbO using a tungsten working electrode at 353 K. | |
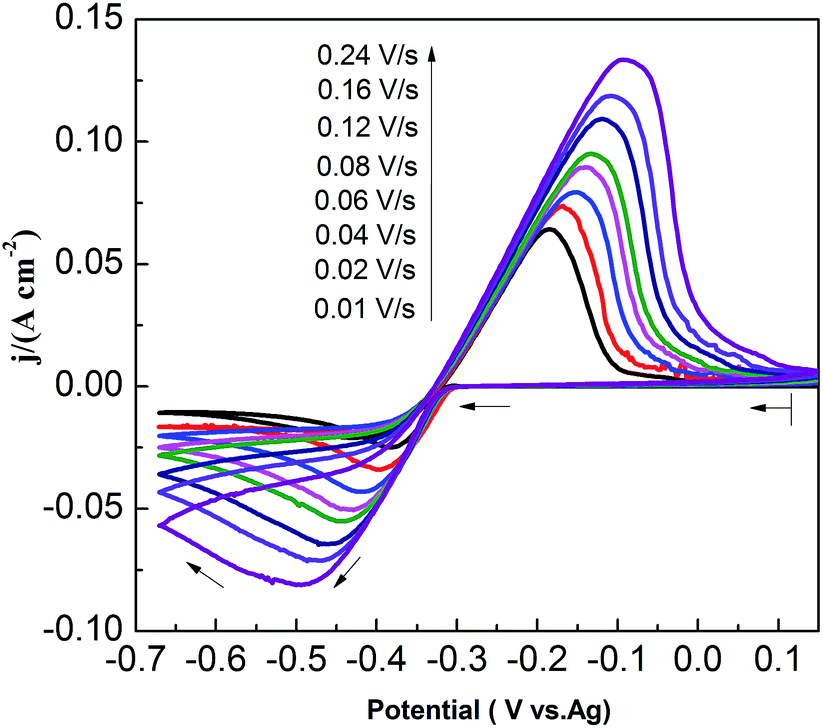
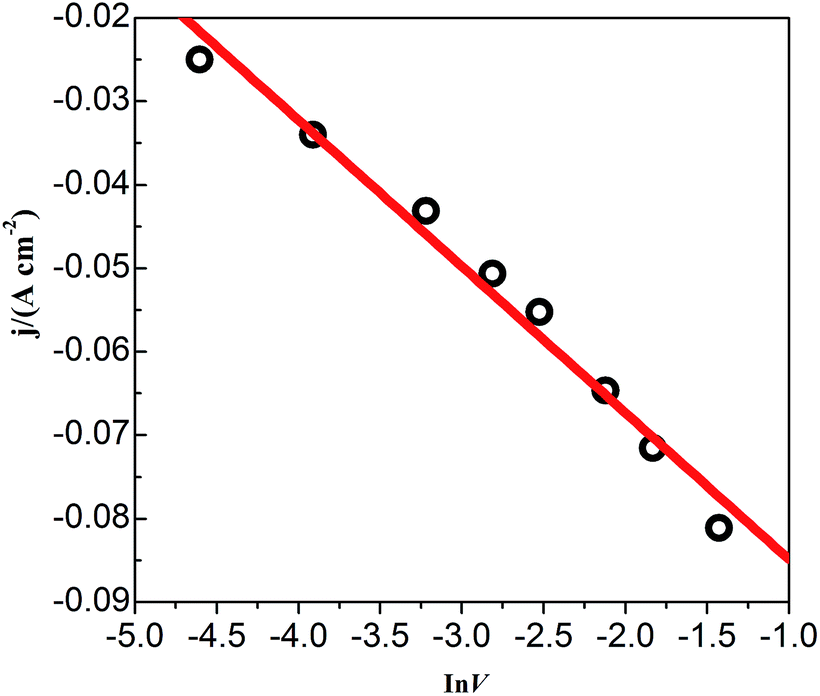
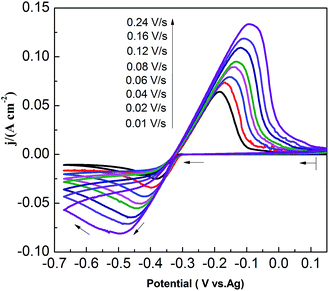
CVs recorded at different scan rates in the PbO–urea/EMIC system are shown in Fig. 3. Reduction peak potentials shift to a negative direction while oxidation peak potentials positively increase in succession. Due to the effect of different scan rates, the difference between the cathodic peak potential and the cathodic half-peak potential |Epc − Epc/2| in Fig. 3 widens, as seen in Table 1. The minimum of |Epc − Epc/2| is 43.6 mV, which is larger than the value for a reversible reaction (33.5 mV). This suggests that the electrode reaction is quasi-reversible.30 Accordingly, the reduction peak current also increases with increasing scan rate. A good linear correlation between reduction peak current and scan rate is presented in Fig. 4. All these characteristics suggest that the reduction of lead in the PbO–urea/EMIC system is quasi-reversible and follows a single-step, two-electron transfer process.30
 |
| | Fig. 3 Cyclic voltammograms of the urea/EMIC (2:1 molar ratio) containing 45 mmol PbO using a tungsten working electrode under different scan rates at 353 K. | |
Table 1 Comparisons of the difference between the cathodic peak potential and the cathodic half-peak potential in Fig. 3 under different scan rates
| ν/V s−1 |
|Epc − Epc/2|/mV |
| 0.01 |
43.6 |
| 0.02 |
61.5 |
| 0.04 |
67.4 |
| 0.06 |
71.4 |
| 0.08 |
79.3 |
| 0.12 |
103.1 |
| 0.16 |
111.1 |
| 0.24 |
109.1 |
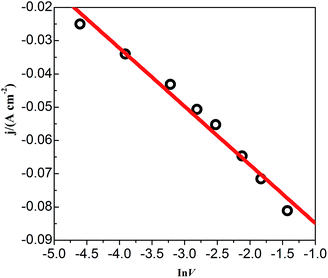 |
| | Fig. 4 The cathodic peak current density obtained from Fig. 3 as a function of the scan rates (lnν). | |
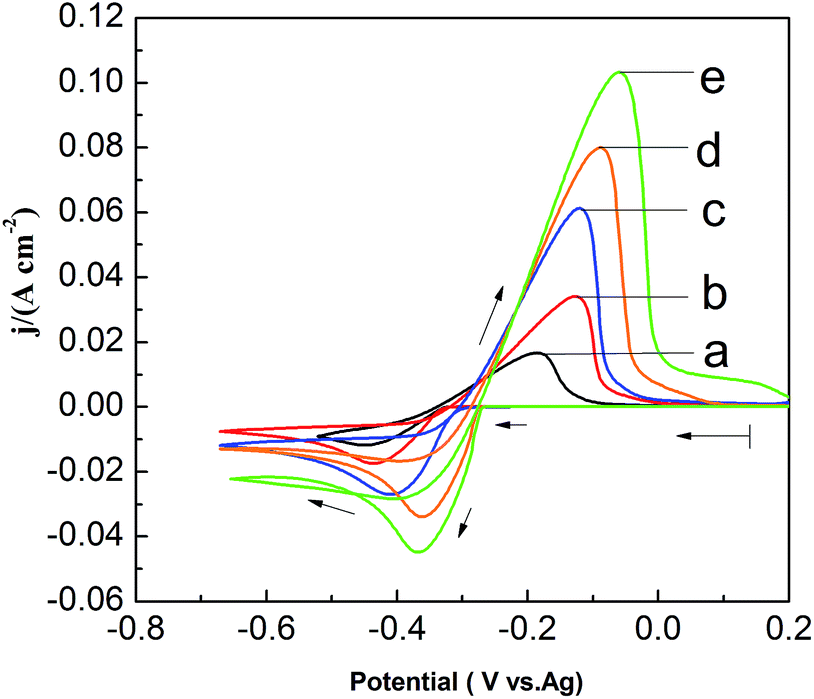
To investigate the effect of PbO concentrations on the electrochemical behavior of lead in the PbO–urea/EMIC system, a set of CV are recorded at 353 K, as shown in Fig. 5. The current density in cathodic peak and anodic peak increases as PbO concentration increases. Moreover, equilibrium potentials in CV shift toward the positive direction. This can be attributed to the fact that the equilibrium potentials are changed with the PbO concentrations. Accordingly, the cathodic peak potential and anodic peak potential both anodically shift with increasing of PbO concentration from 25 to 65 mmol. The differences in peak potentials |Epa − Epc| in Fig. 5 are within range of 261.8 to 309.4 mV, as seen in Table 2. The minimum of |Epa − Epc| is 261.8 mV, which is larger than the value for a reversible reaction. This suggests that the reduction of lead in PbO–urea/EMIC system is quasi-reversible process at various PbO concentrations30
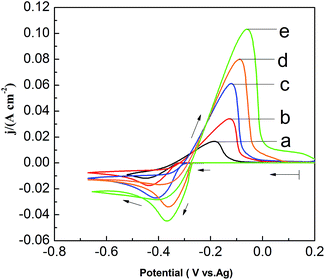 |
| | Fig. 5 Cyclic voltammograms of different PbO concentrations in the urea/EMIC (2:1 molar ratio) using a tungsten working electrode scan rates at 353 K. (a) 25 mmol, (b) 35 mmol, (c) 45 mmol, (d) 55 mmol, (e) 65 mmol. Scan rate: 0.06 V s−1. | |
Table 2 Comparisons of the difference between the cathodic peak potential and the anodic peak potential in Fig. 5 under different PbO concentrations
| CPbO (mmol) |
|Epa − Epc|/mV |
| 25 |
261.8 |
| 35 |
309.4 |
| 45 |
291.6 |
| 55 |
269.7 |
| 65 |
309.4 |
3.2 Chronoamperometry
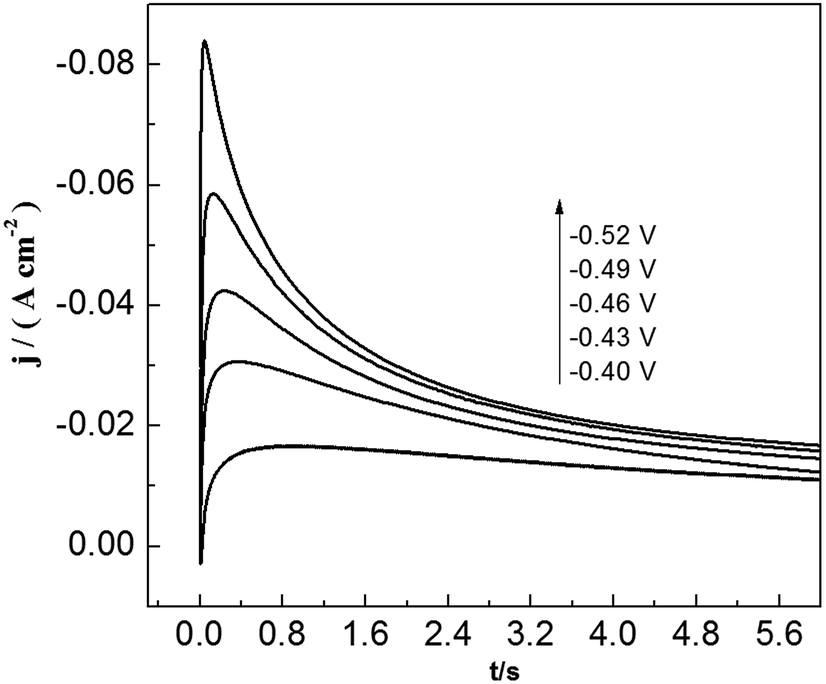
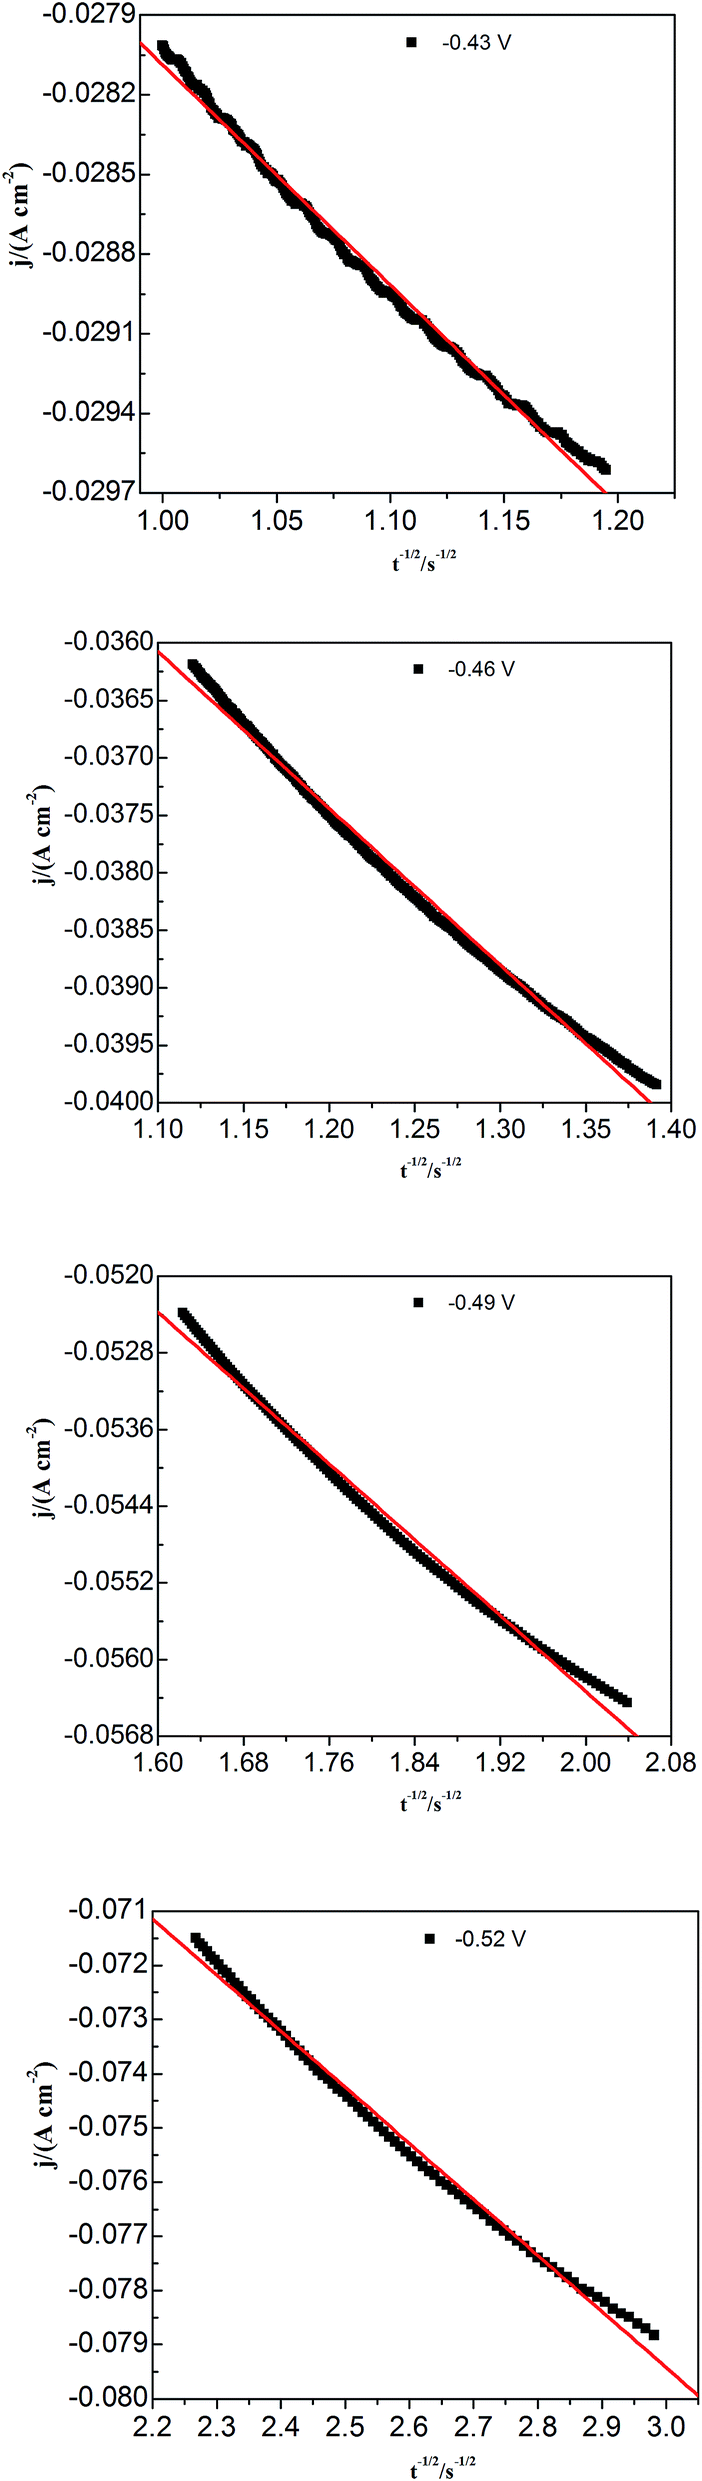
To study lead nucleation/growth process in the PbO–urea/EMIC system, chronoamperometric experiments were carried out at various potentials. These were negatively added from an initial potential to a value sufficient for nucleation/growth. In the chronoamperometric process, current density as a function of time transients at 353 K are recorded in Fig. 6. These curves all show the characterizations of nucleation/growth. First, the current values drop quickly in a short time due to the double electrode layer charge. Then the current reverses and increases. This current is the faradaic current, indicating that the lead nuclei have begun to nucleate and grow. The faradaic current increases to a maximum, im, at time, tm, as the nuclei become bigger and the discrete diffusion zones overlap. When the cathodic potentials are negatively shifted from −0.40 to −0.52 V, the tm values tend to decrease. This may be related to that the overlap of discrete diffusion zones requires a shorter time and the number of nuclei gradually increases at a more negative cathodic potential. After tm, all current transients decay slowly due to the increase in diffusion layer thickness and the overlap of diffusion zones. Relationships between current transients after tm and time (t−1/2) are shown in Fig. 7. Some linear correlations are obtained, suggesting that the growth of lead nuclei is a diffusion-controlled process.
 |
| | Fig. 6 Current transient curves of tungsten electrode in 45 mmol PbO–urea/EMIC (2:1 molar ratio) at different cathodic potentials. | |
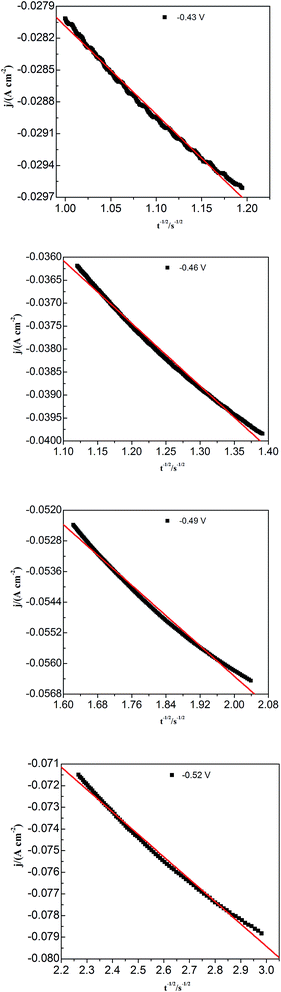 |
| | Fig. 7 Current density (j) as a function of time (t−1/2) for the decreasing portions obtained from Fig. 5 during the lead electrodeposition on a tungsten electrode. | |
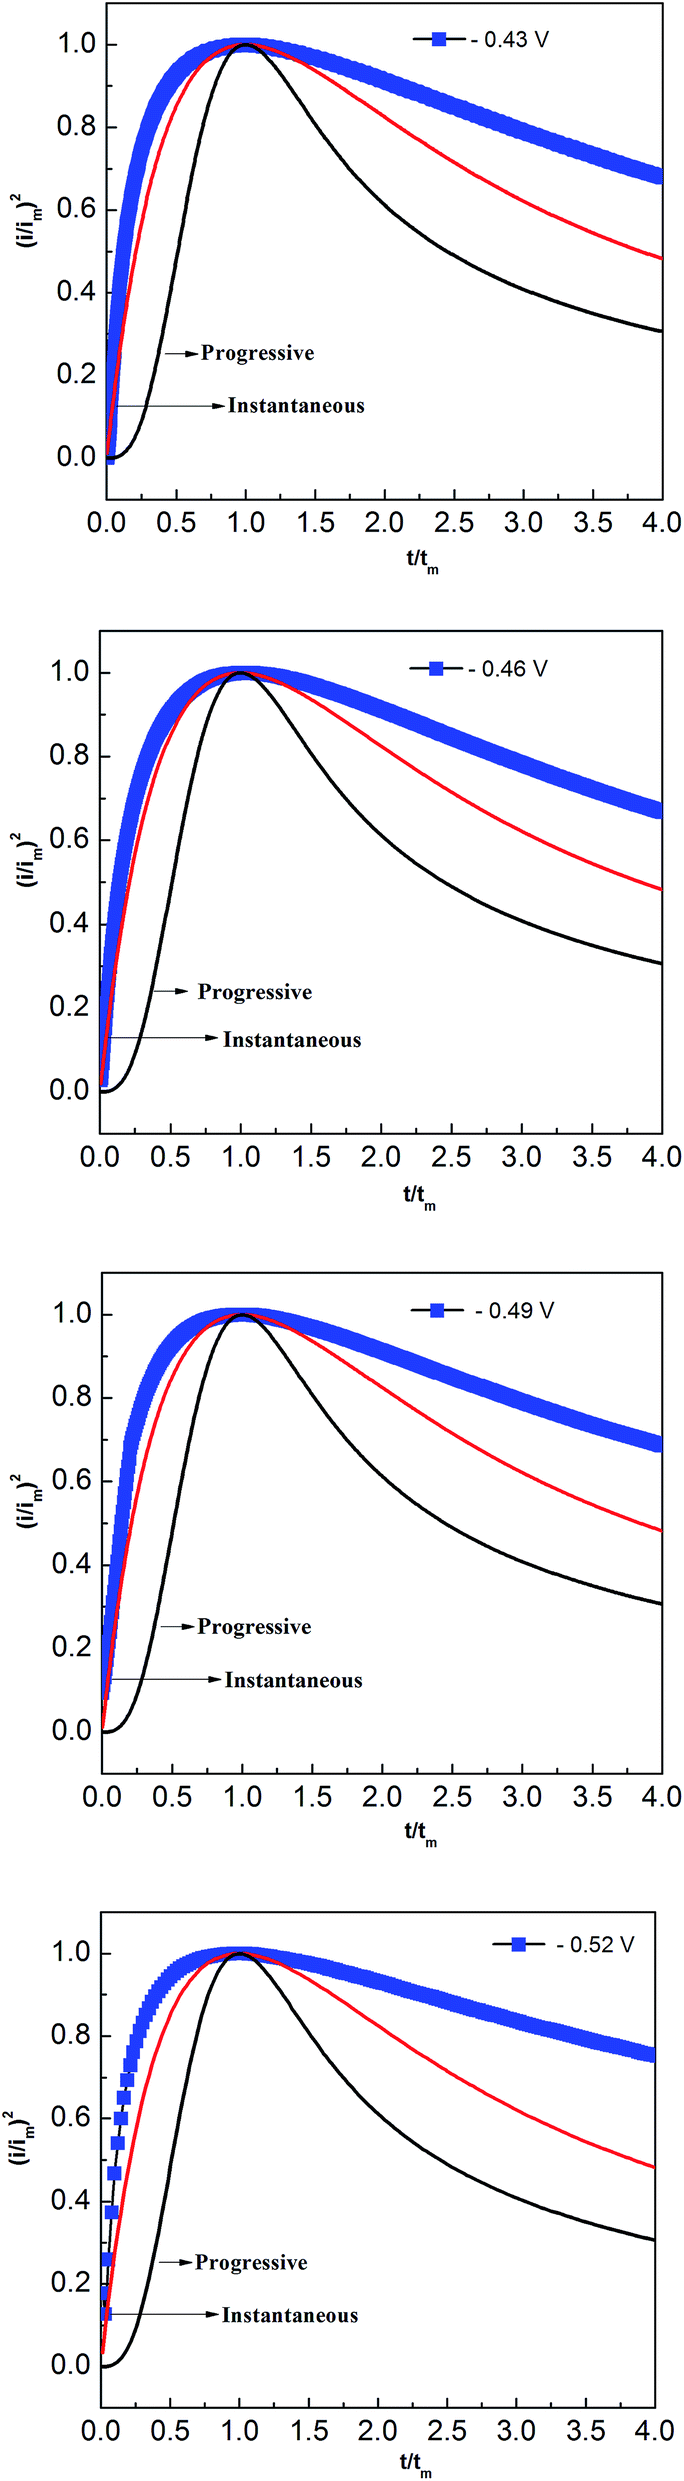
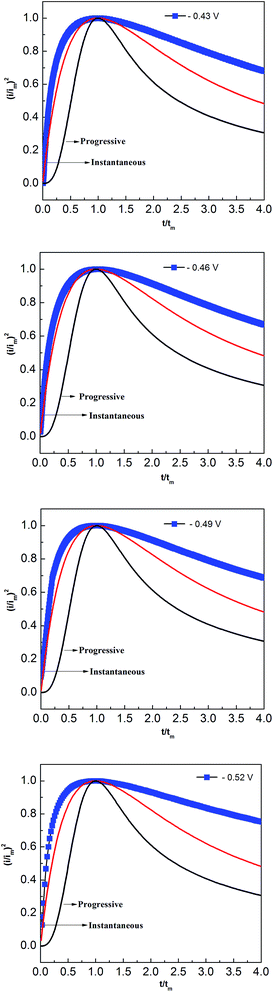
Two classical three-dimensional (3D) models, the progressive and the instantaneous, reported by Scharifker and Hills are often used to analyze the nucleation/growth process in metal electrodeposition.31,32 In the progressive model, the number of metal nuclei is gradually increased during electrodeposition. Conversely, fast nucleation occurs at a small number of activated sites in the instantaneous model. To identify the appropriate lead nucleation/growth model in the PbO–urea/EMIC system, the experimental current density–time transients were compared with theoretical eqn (1) and (2).
Progressive:
| | |
(i/im)2 = (1.2254tm/t)(1 − exp[−(2.3367t2/tm2)])2
| (1) |
Instantaneous:
| | |
(i/im)2 = (1.9542tm/t)(1 − exp[−(1.2564t/tm)])2
| (2) |
The results, shown in Fig. 8, reveal that the lead nucleation in the PbO–urea/EMIC system follows a 3D instantaneous model and a diffusion-controlled growth. The experimental current densities were larger than the theoretical values at each cathodic potential in Fig. 8. These are probably related to partial kinetic control of the growth process.33,34
 |
| | Fig. 8 Comparisons of the dimensionless experimental curves obtained from Fig. 5 for the urea/EMIC (2:1 molar ratio) containing 45 mmol PbO on a tungsten electrode with the theoretical models of three-dimensional nucleation at different potentials and 353 K. | |
3.3 Effect of temperature
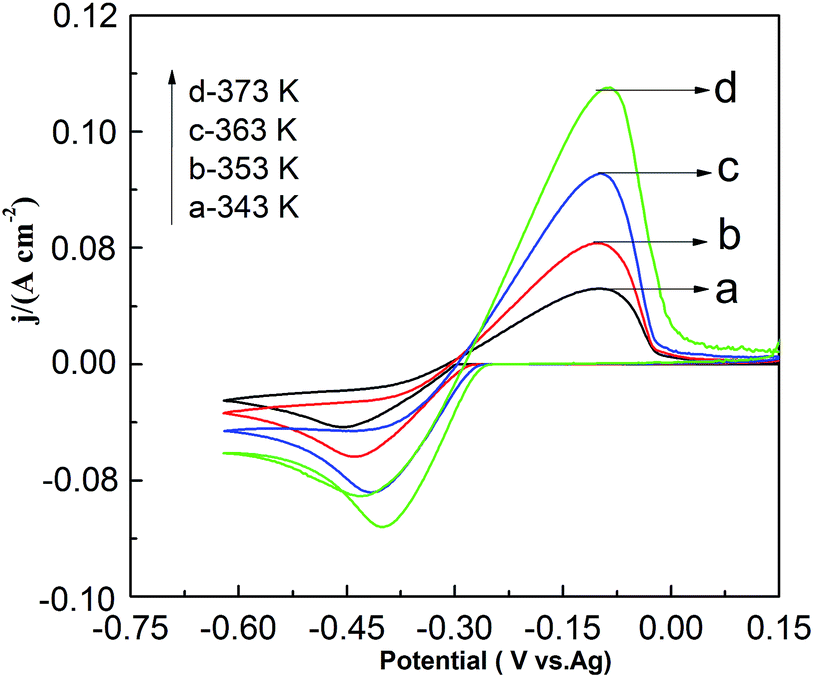
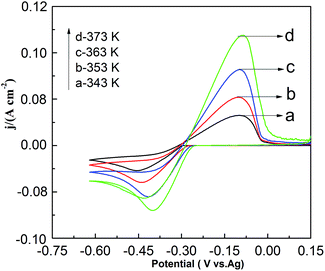
Fig. 9 shows the effect of temperature on CV in the PbO–urea/EMIC system. As temperature increases from 343 to 373 K, the reduction peak potential anodically shifts, and the difference between the reduction peak and oxidation peak potentials narrows. This means that electrode reaction becomes more reversible at a higher temperature. Moreover, equilibrium potentials in CV shift toward the positive direction, as shown in Fig. 10. Similarly, the currents at the reduction and oxidation peaks also increase with increasing temperature. This is likely related to the enhancement of species diffusion at a higher temperature.
 |
| | Fig. 9 Cyclic voltammograms of the urea/EMIC (2:1 molar ratio) containing 45 mmol PbO using a tungsten working electrode at various temperatures. The scan rate was 0.05 V s−1. | |
 |
| | Fig. 10 The equilibrium potentials for the urea/EMIC (2:1 molar ratio) containing 45 mmol PbO using a tungsten working electrode at various temperatures (obtained from Fig. 8). | |
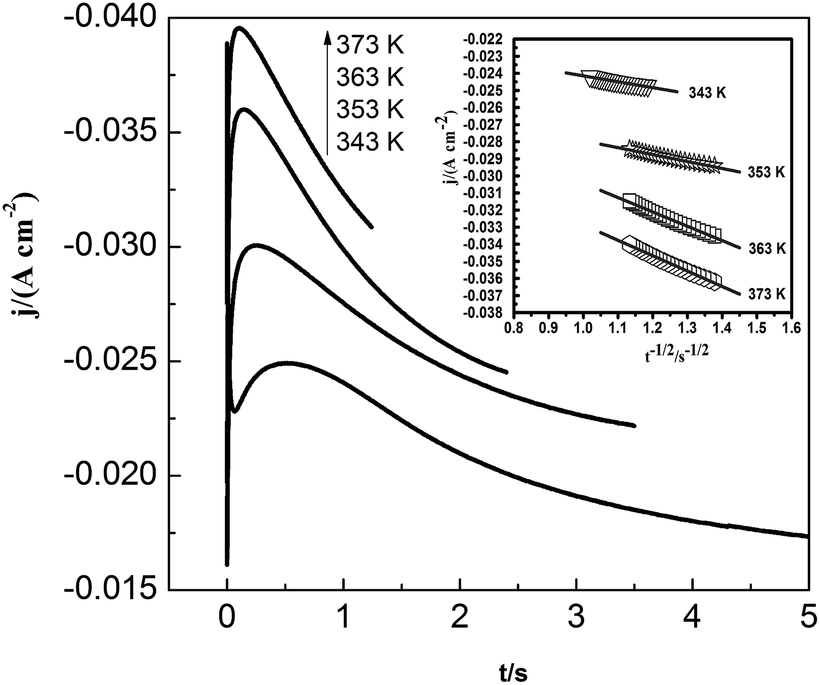
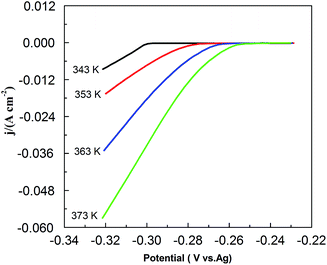
Fig. 11 shows the current density–time transients for the lead nucleation/growth process at various temperatures. The current reaches the maximum more quickly as temperature increases. We obtained the correlation between current density (j) and time (t−1/2) from the decreasing transient areas, as shown in the Fig. 11 inset. We found a number of linear relationships whose slopes increased with temperatures from 343 to 373 K, as a higher temperature can facilitate the diffusion of lead species in the PbO–urea/EMIC system.
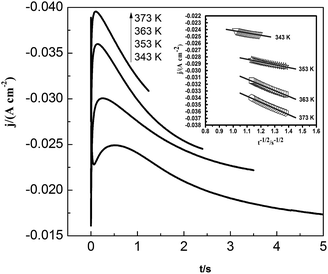 |
| | Fig. 11 Current density as a function of time transients in chronoamperometric experiments for the urea/EMIC (2:1 molar ratio) containing 45 mmol PbO on a tungsten electrode at various temperatures. Cathodic potential: 490 mV, inset: corresponding Cottrell plots. | |
The diffusion coefficient can be determined using eqn (3) as follow:31
| | |
im2tm = 0.1629DF2n2(C0)2
| (3) |
where
im is a current maximum in A,
tm is the time of the current maximum in s,
D is the diffusion coefficient in cm
2 s
−1,
F is the Faraday constant 96
485 C mol
−1,
n is the number of exchanged electrons, and
C0 is the metal ion bulk concentration in mol cm
−3. The values of
im and
tm can be obtained from
Fig. 11. Substituting the values for
n,
F and
C0 into
eqn (3), the diffusion coefficient for various temperatures are derived and compared, see
Table 3. The values of the diffusion coefficients increased from 1.01 × 10
−8 to 3.16 × 10
−8 cm
2 s
−1 when the temperature increased from 343 to 373 K. This may be related to activation energy. In addition, a comparison of lead diffusion coefficients in various ionic liquids is shown in
Table 4. The small difference may be related to different ionic liquid systems and temperature. Based on the Arrhenius' law, the following
eqn (4) shows relationship between the diffusion coefficients and the activation energy.
35,36| |
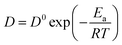 | (4) |
where
D is the diffusion coefficient in cm
2 s
−1,
D0 is the frequency factor,
Ea is the activation energy,
R is the gas constant in 8.314 J K
−1 mol
−1, and
T is the absolute temperature in K.
Table 3 Comparisons of lead diffusion coefficients (D) in the urea/EMIC (2:1 molar ratio) containing 45 mmol PbO at various temperatures
| Temperature (K) |
D (cm2 s−1) |
| 343 |
1.01 × 10⁻⁸ |
| 353 |
1.67 × 10⁻⁸ |
| 363 |
2.17 × 10⁻⁸ |
| 373 |
3.16 × 10⁻⁸ |
Table 4 Summarization for lead diffusion coefficients (D) in various ionic liquids
| Ionic liquid |
Temperature (K) |
107D (cm2 s−1) |
Reference |
| Urea/EMIC |
353 |
0.167 |
This work |
| BMPTFSA |
298 |
0.8 |
20 |
| DIMCARB |
295 |
1.8 |
21 |
| [C2mim][NTf2] |
293 |
1.3 |
24 |
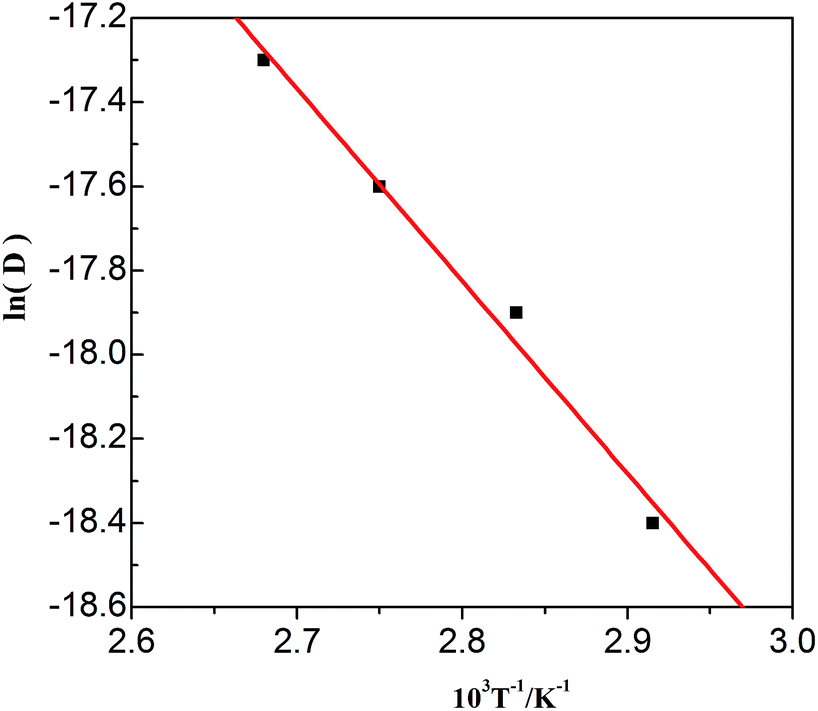
The values in Table 3 were normalized as ln(D) versus 1/T, as shown in Fig. 12. A linear relationship was obtained. The function between ln(D) and 1/T was shown in eqn (5).
| |
 | (5) |
 |
| | Fig. 12 Lead diffusion coefficients (lnD) in the urea/EMIC (2:1 molar ratio) containing 45 mmol PbO as function of temperature (T−1). | |
Based on this function, we determine the value of activation energy (Ea) to be 38 kJ mol−1.
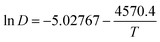
3.4 Electrodeposition and characterization of lead
Fig. 13 shows the SEM micrographs of the electrodeposits obtained on tungsten substrates in the PbO–urea/EMIC system. Uniform particles were obtained at −0.43 V (Fig. 13a). With an increase in cathodic potential, the particles became smaller and were more densely distributed. This may be related to the increased number of growth sites and electrodeposition rate.
 |
| | Fig. 13 SEM micrographs of electrodeposits produced from the urea/EMIC (2:1 molar ratio) containing 45 mmol PbO on tungsten substrates at different cathodic potentials and 353 K for 30 min: (a) −0.43 V, (b) −0.46 V, (c) −0.49 V, (d) −0.52 V. | |
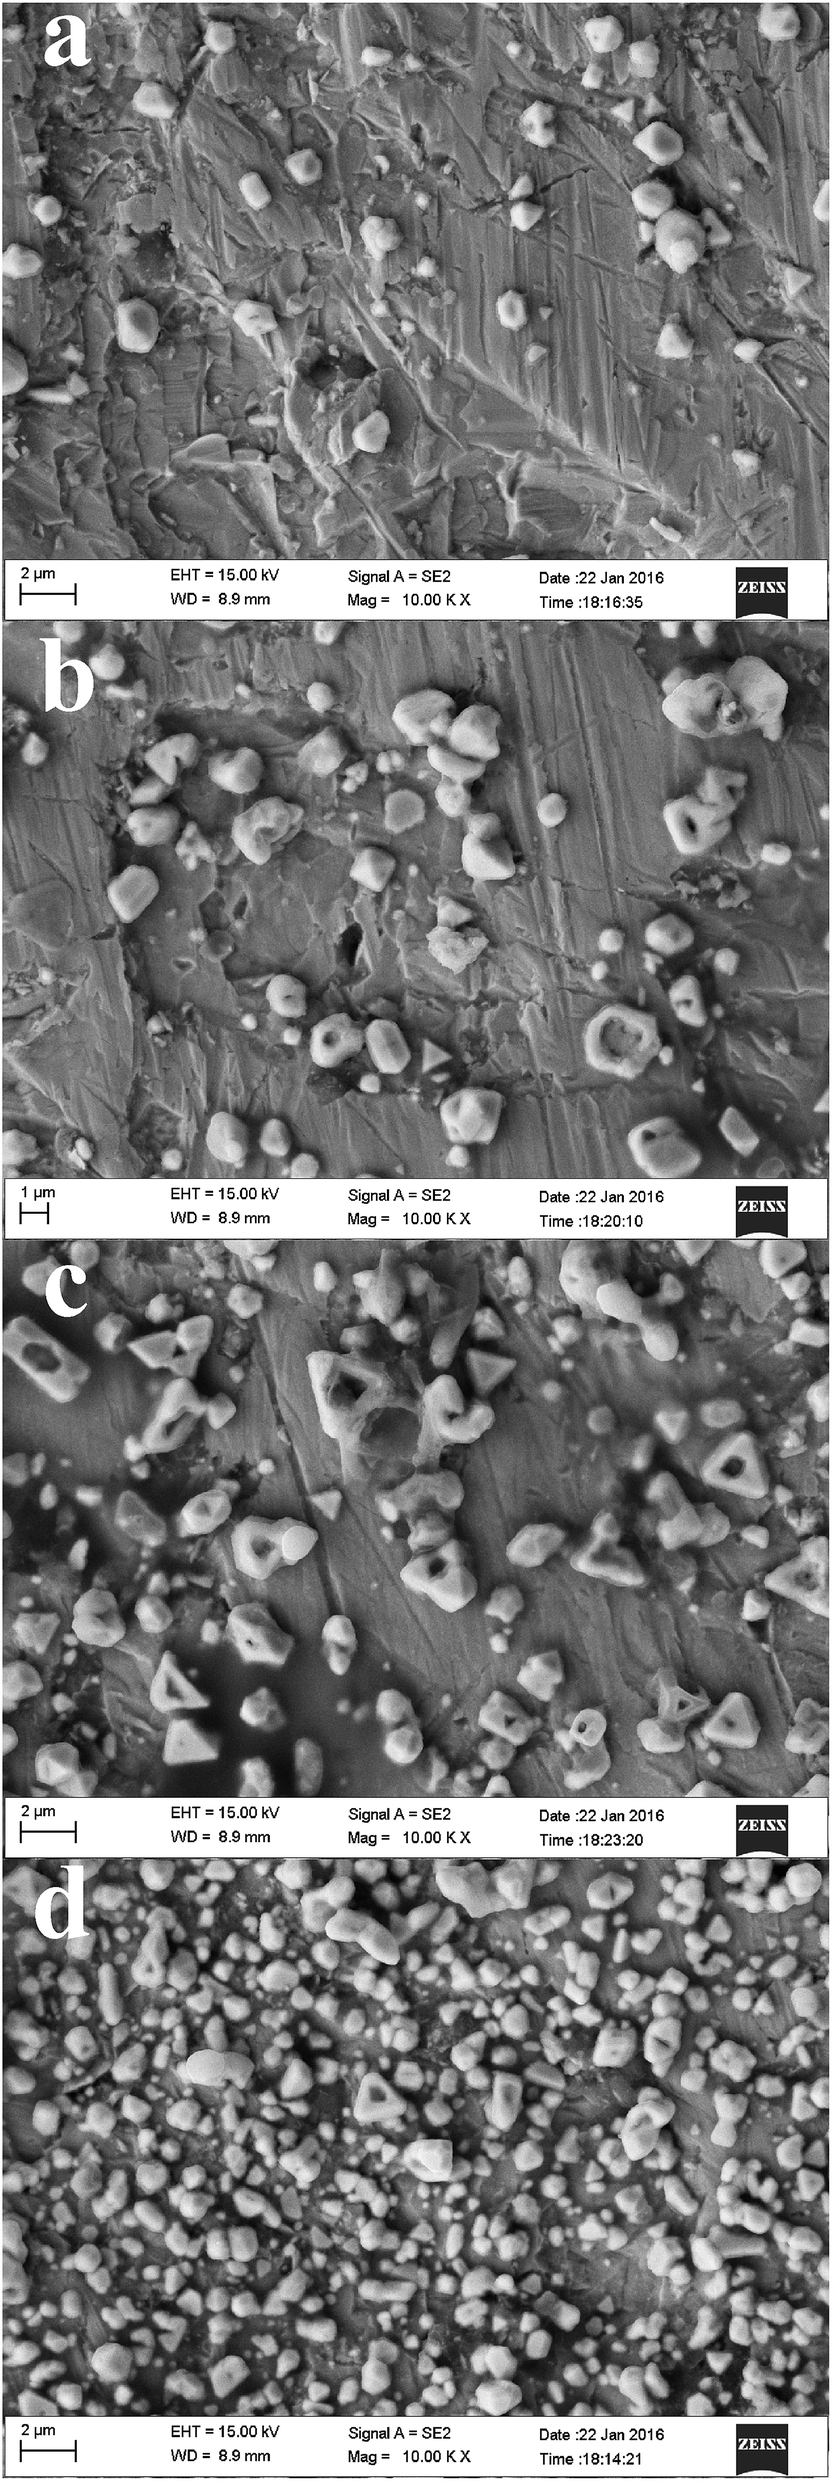
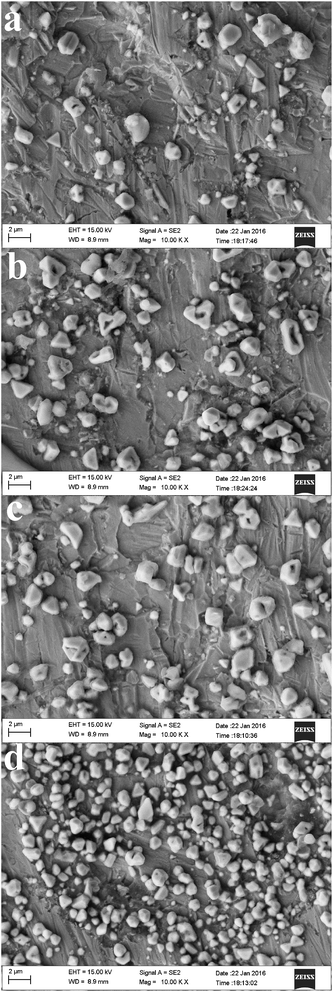
Fig. 14 shows the effect of temperature on the morphologies of the deposits. At 343 K, we observed large particles that are spherical in shape and have a low number density. When the temperature increased from 353 to 373 K, the size of the particles progressively decreased while their density increased. Thus, at a high temperature, the particles are smaller and denser. This result is mainly due to enhanced charge transfer and faster growth of lead crystallites at a high temperature, which suggests that temperature has a crucial effect on lead electrodeposition that the nuclei size will decrease and the nuclei density will increase with raising the temperature.
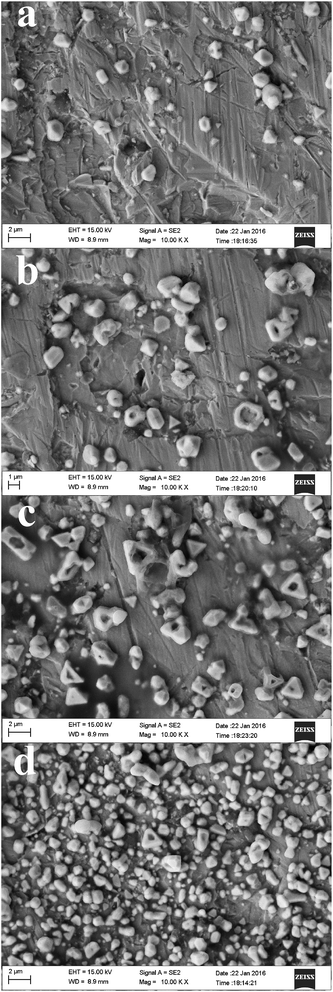 |
| | Fig. 14 SEM micrographs of electrodeposits produced from the urea/EMIC (2:1 molar ratio) containing 45 mmol PbO on tungsten substrates at −0.49 V for 30 min. Temperatures: (a) 343 K, (b) 353 K, (c) 363 K, (d) 373 K. | |
EDS analysis of the electrodeposits produced at −0.52 V is shown in Fig. 15. All peaks correspond to Pb and W substrate. No other peaks were discovered, suggesting that the main chemical constituent of the electrodeposits is lead.
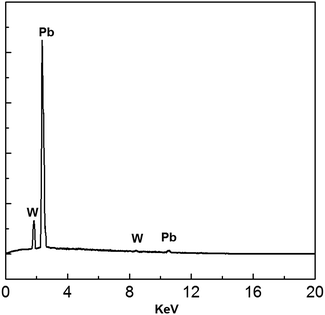 |
| | Fig. 15 EDS spectrum of electrodeposits produced from the urea/EMIC (2:1 molar ratio) containing 45 mmol PbO on a tungsten substrate at −0.52 V for 120 min. Temperature: 353 K. | |
Fig. 16 shows XRD analysis of the electrodeposits obtained at −0.52 V on the tungsten substrate. All peaks correspond to lead and the tungsten substrate. 2θ values (31.306, 36.267, 52.230, 62.121, 65.238, 85.397, 88.199) are indexed to the main peaks of lead crystals (reference code = 00-004-0686). The results of the EDS spectrum and the XRD pattern confirm that the electrodeposits consist of lead metal.
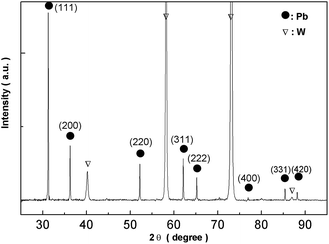 |
| | Fig. 16 XRD pattern of electrodeposits produced from the urea/EMIC system (2:1 molar ratio) containing 45 mmol PbO on a tungsten substrate at −0.52 V for 120 min. Temperature: 353 K. | |
4. Conclusions
PbO was dissolved in urea/EMIC at 353 K and used as a lead source for supporting electrochemical experiments. CV results showed that lead reduction in this electrolyte is quasi-reversible and follows a single-step, two-electron transfer process. Lead reduction in the PbO–urea/EMIC system follows a 3D instantaneous nucleation and a diffusion-controlled growth at 353 K, which were verified by chronoamperometric experiments. The diffusion coefficient was 1.67 × 10⁻⁸ cm2 s−1. As temperature increases from 343 to 373 K, electrode reaction becomes more reversible. The diffusion coefficients obey the Arrhenius' law. The activation energy is estimated to be 38 kJ mol−1. Lead electrodeposition was conducted on tungsten substrates at different negative potentials (−0.43, −0.46, −0.49, −0.52 V) and various temperatures (343, 353, 363, 373 K), respectively. SEM images showed that the deposits became smaller and were more densely distributed with an increase in cathodic potentials and higher temperatures. The deposits were identified as lead metal using XRD and EDS.
Acknowledgements
The authors would like to acknowledge the financial support from the National Natural Science Foundation of China (No. 51322406, 51474060 and 51574071); the Program for New Century Excellent Talents in University (NCET-2013-0107), Ministry of Education of China and the Fundamental Research Funds for the Central Universities (N140205001&L1502014).
References
- C. White, J. Deveau and L. G. Swan, J. Power Sources, 2016, 327, 160 CrossRef CAS.
- B. Rashkova, B. Guel, R. T. Potzschke, G. Staikov and W. J. Lorenz, Electrochim. Acta, 1998, 43, 3021 CrossRef CAS.
- C. Ehlers, U. Konig, G. Staikov and J. W. Schultze, Electrochim. Acta, 2001, 47, 379 CrossRef CAS.
- D. Maharaj and A. Mwasha, Construction and Building Materials, 2016, 112, 1141 CrossRef.
- C. A. Sutherland, E. F. Milner, R. C Kerby, H. Teindl, A. Melin and H. M. Bolt, Lead, Ullmann's Encyclopedia of Industrial Chemistry, 2005 Search PubMed.
- P. Pershin, Y. Khalimullina, P. Arkhipov and Y. Zaikov, J. Electrochem. Soc., 2014, 161, D824 CrossRef CAS.
- I. A. Carlos, M. A. Malaquias, M. M. Oizumi and T. T. Matsuo, J. Power Sources, 2001, 92, 56 CrossRef CAS.
- S. M. Wong and L. M. Abrantes, Electrochim. Acta, 2005, 51, 619 CrossRef CAS.
- I. A. Carlos, J. L. P. Siqueira, G. A. Finazzi and M. R. H. de Almeida, J. Power Sources, 2003, 117, 179 CrossRef CAS.
- Y. Gu, Q. Zhou, T. Yang, W. Liu and D. Zhang, Trans. Nonferrous Met. Soc. China, 2011, 21, 1407 CrossRef CAS.
- N. D. Nikolic, G. Brankovic and U. C. Lacnjevac, J. Solid State Electrochem., 2012, 16, 2121 CrossRef CAS.
- N. D. Nikolić, K. I. Popov, P. M. Živković and G. A. Branković, J. Electroanal. Chem., 2013, 69, 66 CrossRef.
- J. Mostany, J. Parra and B. R. Scharifke, J. Appl. Electrochem., 1986, 16, 333 CrossRef CAS.
- N. D. Nikolić, D. D. Vaštag, P. M. Živković, B. Jokić and G. Branković, Adv. Powder Technol., 2013, 24, 674 CrossRef.
- D. Pletcher and R. Wills, Phys. Chem. Chem. Phys., 2004, 6, 1779 RSC.
- C. Z. Yao, M. Liu, P. Zhang, X. H. He, G. R. Li, W. X. Zhao, P. Liu and Y. X. Tong, Electrochim. Acta, 2008, 54, 247 CrossRef CAS.
- S. Legeai, S. Diliberto, N. Stein, C. Boulanger, J. Estager, N. Papaiconomou and M. Draye, Electrochem. Commun., 2008, 10, 1661 CrossRef CAS.
- C. Herrera, G. García, M. Atilhan and S. Aparicio, J. Phys. Chem. C, 2015, 119, 24529 CAS.
- T. Ohba, K. Hata and V. V. Chaban, J. Phys. Chem. C, 2015, 119, 28424 CAS.
- Y. Katayama, R. Fukui and T. Miura, J. Electrochem. Soc., 2013, 160, D251 CrossRef CAS.
- A. I. Bhatt, A. M. Bond and J. Zhang, J. Solid State Electrochem., 2007, 11, 593 CrossRef.
- F. X. Wang, G. B. Pan, Y. D. Liu and Y. Xiao, Chem. Phys. Lett., 2010, 488, 112 CrossRef CAS.
- R. W. Tsai, Y. T. Hsieh, P. Y. Chen and I. W. Sun, Electrochim. Acta, 2014, 137, 49 CrossRef CAS.
- T. J. Simons, A. K. Pearson, S. J. Pas and D. R. MacFarlane, Electrochim. Acta, 2015, 174, 712 CrossRef CAS.
- T. S. S. Dikshith, Hazardous chemicals safety management and global regulations, CRC Press Taylor &Francis Group, Boca Raton, 2012 Search PubMed.
- M. Lin, M. Gong and B. Lu, et al., Nature, 2015, 520, 325 CrossRef PubMed.
- J. S. Wilkes, J. A. Levisky, R. A. Wilson and C. L. Hussey, Inorg. Chem., 1982, 21, 1623 Search PubMed.
- H. Yang and R. G. Reddy, Electrochim. Acta, 2015, 178, 617 CrossRef CAS.
- M. Li, B. Gao, C. Liu, W. Chen, Z. Shi, X. Hu and Z. Wang, Electrochim. Acta, 2015, 180, 811 CrossRef CAS.
- A. J. Bard and L. R. Faulkner, Electrochemical methods: fundamentals and applications, John Wiley & Sons, New York, 2nd edn, 2001 Search PubMed.
- B. Scharifker and G. Hills, Electrochim. Acta, 1983, 28, 879 CrossRef CAS.
- G. Gunawardena, G. Hills, I. Montenegro and B. Scharifker, J. Electroanal. Chem., 1982, 138, 225 CrossRef CAS.
- P. He, H. Liu, Z. Li and J. Li, J. Electrochem. Soc., 2005, 152, 146 CrossRef.
- S. Langerock and L. Heerman, J. Electrochem. Soc., 2004, 151, 155 CrossRef.
- H. Groult, H. El Ghallali, A. Barhoun, E. Briot, L. Perrigaud, S. Hernandorena and F. Lantelme, Electrochim. Acta, 2010, 55, 1926 CrossRef CAS.
- L. Li, Z. Shi, B. Gao, J. Xu, X. Hu and Z. Wang, Electrochemistry, 2014, 82, 1072 CrossRef CAS.
- J. Ru, Y. Hua, C. Xu, J. Li, Y. Li, D. Wang, C. Qi and Y. Jie, Appl. Surf. Sci., 2015, 335, 153 CrossRef CAS.
- H. Yang and R. Reddy, J. Electrochem. Soc., 2014, 161, D586 CrossRef CAS.
- Y. Liao, P. Chen and I. Sun, Electrochim. Acta, 2016, 214, 265 CrossRef CAS.
- J. Ru, Y. Hua, C. Xu, J. Li, Y. Li, D. Wang, C. Qi and K. Gong, Russ. J. Electrochem., 2015, 51, 773 CrossRef CAS.
|
| This journal is © The Royal Society of Chemistry 2017 |
Click here to see how this site uses Cookies. View our privacy policy here. 
 Open Access Article
 This Open Access Article is licensed under a Creative Commons Attribution-Non Commercial 3.0 Unported Licence
 ,
Aimin Liu,
Jinzhao Guan,
Zhongning Shi*,
Bingliang Gao,
Xianwei Hu and
Zhaowen Wang
,
Aimin Liu,
Jinzhao Guan,
Zhongning Shi*,
Bingliang Gao,
Xianwei Hu and
Zhaowen Wang