 Open Access Article
Mechanism of palladium(II) biosorption by Providencia vermicola
Ling Tan a,
Haigang Dongb,
Xinxing Liua,
Jia Hea,
Hang Xua and
Jianping Xie*a
aSchool of Minerals Processing and Bioengineering, Central South University, Changsha 410083, China. E-mail: Xiejianping@csu.edu.cn; Fax: +86-0731-88836943; Tel: +86-0731-88836943
bState Key Laboratory of Advanced Technologies for Comprehensive Utilization of Platinum Metals, Kunming Institute of Precious Metals, Kunming 650106, China
First published on 20th January 2017
Abstract
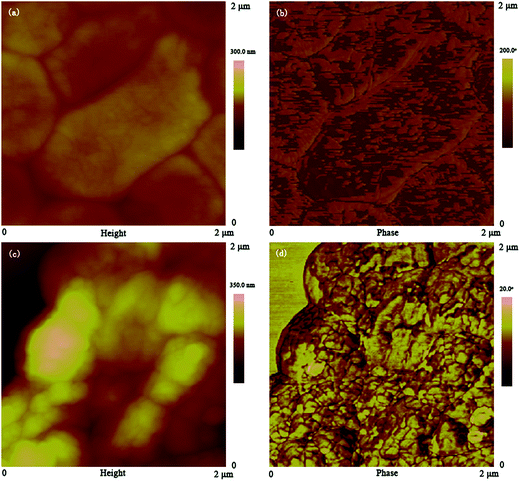
The mechanism of biosorption of Pd(II) from aqueous solution onto Providencia vermicola biomass was elucidated from the aspects of the biosorption process, multi-scale visualization and functional groups for the first time. Kinetic, equilibrium and thermodynamic experiments revealed that the biosorption process was spontaneous, endothermic and limited by chemical reaction. The multi-scale visualization was conducted by using scanning electron microscopy coupled to energy dispersive X-ray spectroscopy (SEM-EDX), transmission electron microscopy coupled to energy dispersive X-ray spectroscopy (TEM-EDX) and atomic force microscopy (AFM). It was demonstrated that palladium ions were transformed to both the external and internal of P. vermicola biomass, and the morphological properties changed considerably in the nanometer range. The functional groups related to Pd(II) binding on the cell wall of P. vermicola were confirmed by chemical modification and characterized by Fourier transform infrared spectroscopy (FTIR) and X-ray photoelectron spectroscopy (XPS). The results showed that zero-valent palladium ions were detected in the surface of the biomass, and the most efficient functional groups were carboxylic and hydroxyl groups, followed by phosphate and amine groups.
1. Introduction
Palladium is commonly used in catalytic converters of automobiles to lower emissions of harmful pollutants, as well as in refining, electronics, dentistry, and catalysis.1 The ability of palladium to catalyze a wide spectrum of reactions in chemical synthesis led the price of palladium to a parallel increase.2 In general, mineral ores for the extraction of palladium contain less than 10 g t−1 whereas the printed circuit boards (PCBs) of personal computers and mobile phones contain 110 g t−1 and 280 g t−1 of palladium, respectively. It was reported that palladium made up around 50% of the economic value of the bare waste computer PCBs after the components were disassembled.3 To date, hydrometallurgical processes, which include cementation, solvent extraction, ion exchange, adsorption and precipitation, account for most of the recovery of palladium from scrap. However, the recovery methods generated large quantities of secondary waste since various chemicals were used in the processes.4,5 Hence, it is essential to develop a low-cost, eco-friendly and little secondary wastes generated system, to recover precious metals from wastewater.In recent years, as an alternative treatment, biosorption process has become an economic and eco-friendly technology in water and wastewater industry.6 Many biomaterials, such as bacteria, fungal, marine algae and waste activated sludge, have been investigated as biosorbents to separate and concentrate metals from wastewaters.7,8 For example, Yan and Viraraghavan9 reported that fungi such as Aspergillus niger and Mucor rouxii were capable of removing heavy metals from aqueous solutions. Chojnacka et al.10 investigated the processes of biosorption of heavy metal ions (Cr3+, Cd2+, Cu2+) by blue-green algae and found that Spirulina sp. was a very efficient biosorbent. Some industrial waste biomass, such as Escherichia coli2,11 and Corynebacterium glutamicum,5 were also used to recover precious metals like palladium and platinum from aqueous solution. However, the mechanism and characteristics of biosorption of various metals are bacteria dependent since the cell wall are not identical.
Providencia spp., which was used in lead, aluminium, cobalt and copper biosorption,12,13 yet, have not been studied for palladium biosorption. The exact process of the metal uptake process, multi-scale visualization of biomass and behavior of the functional groups in the biosorption of palladium are still not clear. The objective of the present work was to investigate the biosorption processes and functional groups of P. vermicola biomass for recovering Pd(II) from aqueous solution. To be specific, the kinetics, equilibrium and thermodynamics characteristics of Pd(II) biosorption onto P. vermicola were investigated by using model fitting. Furthermore, the multi-scale visualization of blank and palladium-loaded P. vermicola biomass were observed using SEM-EDX, TEM-EDX and AFM. Later on, the functional groups and possible binding atoms on the cell wall were characterized by FTIR and XPS analyses. The Providencia vermicola biomass was chemically modified to confirm the effects of carboxyl, amine, hydroxyl, phosphate groups on the cell wall.
2. Materials and methods
2.1 Materials
Providencia vermicola was isolated from soil samples collected from YueLu Mountain (N/E: 28°10.409′/112°54.418′, Changsha, China), and the accession number of 16S ribosomal RNA gene is KX394623. The stain was grown aerobically in Luria–Bertani (LB) medium at 30 °C (under 170 rpm) for 24 h with 1% inoculation, then the P. vermicola cells were harvested by centrifugation at 10![[thin space (1/6-em)]](https://www.rsc.org/images/entities/char_2009.gif) 000 rpm for 15 min, re-suspended in deionized water, and repelleted by centrifugation. This procedure was repeated twice, and the wet biomass was immediately used for Pd(II) biosorption.
000 rpm for 15 min, re-suspended in deionized water, and repelleted by centrifugation. This procedure was repeated twice, and the wet biomass was immediately used for Pd(II) biosorption.
Stock solutions of Pd(II) were prepared by dissolving PdCl2 (99.0%) into 0.1 M HCl, to obtain a concentration of 500 mg L−1, which were diluted as necessary.
2.2 Biosorption experiments
The biosorption experiments were carried out by contacting 0.4 g of wet biomass (equivalent to 0.075 g of dry biomass) with 50 mL of palladium solution, with an initial concentration of 200 mg L−1 at different pH values. The suspension was agitated at 170 rpm in a shaker at 30 ± 1 °C. After 4 h of shaking, which was sufficient to attain equilibrium, the samples were harvested and centrifuged to obtain solid–liquid separation. The Pd(II) concentration remaining in the supernatant were analyzed using an inductively coupled plasma (ICP) spectrometer (Shimadzu, ICP-7510, Japan).Biosorption kinetic experiments were conducted using the same method as above, except that the pH was set at 2.0, 3.0 and 4.0 and the samples were collected at different time intervals to determine the time point at which biosorption equilibrium was attained sufficiently.
Biosorption equilibrium experiments were carried out by contacting 0.4 g of wet biomass with 50 mL of Pd(II) solution at temperatures of 293, 303, 313, and 323 K, respectively. The initial Pd(II) concentration was varied from 100 to 400 mg L−1 and pH was maintained at 4.0. After the system reached the equilibrium state, the samples were taken to determine the concentration of Pd(II).
Adsorption capacity was calculated according to the eqn (1):
 | (1) |
2.3 Chemical modification experiments
Portions of blank P. vermicola biomass were chemically treated in different ways, and then 0.4 g wet blank and modified biomass were used for biosorption using the same methods as described. After biosorption, portion of the biomass was freeze-dried for analytical purpose.The chemical treatment applied to the biomass were as follows:
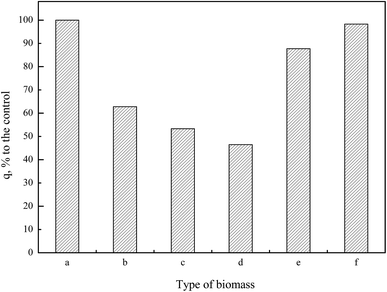
Blank P. vermicola: conditioned biomass without modification were labeled as ‘a’.
Esterification of the carboxylic groups: 5 g wet biomass was suspended in 65 mL of anhydrous methanol, and 0.6 mL of concentrated hydrochloric acid was added to the suspension. The reaction mixture was shaken on a rotary shaker for 6 h at 170 rpm. It has been shown that this treatment caused esterification of the carboxylic acids present on Aspergillus niger.14 The resulted biomass samples were labeled as ‘b’. The reaction occurs as follow:
 | (2) |
Methylation of the amines: 5 g wet biomass was contacted with 40 mL of formic acid and 20 mL of formaldehyde. The reaction mixture was shaken on an agitator at 170 rpm for 6 h. This treatment was expected to result in the methylation of amines.15 The resulted biomass samples were labeled as ‘c’. The general reaction occurs as follow:
 | (3) |
Esterification of the hydroxyl groups: 5 g of raw biomass was suspended in 30 mL mixture of pyridine and acetic anhydride (12 to 88 volume ratio) and heated for 2 h at 60 °C. The treatment was widely applied for determination of hydroxyl content of carboxylic acids.16 The biomass samples obtained were labeled as ‘d’. The reaction occurs as follows:
| RCH2NH2 + (CH3CO)2O → RCH2NHCOCH3 + CH3COOH | (4) |
| RCH2OH + (CH3CO)2O → RCH2OCOCH3 + CH3COOH | (5) |
Esterification of the phosphate groups: 5 g wet biomass was heated under reflux conditions with 40 mL of triethyl phosphite and 30 mL of nitromethane for 6 h. Tobin et al.(1990) reported that this treatment causes esterification of the phosphate groups which may be present on the biomass.17 The resulted biomass samples were labeled as ‘e’. The reaction occurs as follow:
 | (6) |
Extraction of the lipid fraction: 5 g of wet biomass was heated under reflux with 50 mL of acetone for 2.5 h.17 The resulted biomass samples were labeled as ‘f’.
2.4 Analytical methods
The samples before and after biosorption were freeze-dried for Scanning Electron Microscopy (SEM) analyses. SEM-EDX analysis was performed on an environmental SEM (Quanta-200, FEI, UK) at 10 kV accelerating voltage. Transmission Electron Microscopy (TEM) analysis was carried out using a Tecnai G2 20 ST equipped with an energy dispersive X-ray (EDX) attachment. Prior to analysis, ultrathin sections of blank and palladium-loaded samples were cut using an ultramicrotome and then mounted on a copper TEM grid. Samples for Atomic Force Microscopy (DI Multimode V, VEECO, USA) analysis were air-dried in mica sheets overnight, and operated in tapping mode at a scan rate of 1.0 Hz using RTESP probes. For FTIR analysis, 50 mg of KBr disks containing 2% of freeze-dried powder of the each sample were prepared and then examined using a Nicolet 6700 FTIR spectrophotometer (USA). The spectra were recorded in the region of 4000–625 cm−1 at the resolution of 4 cm−1 with 32 scans. X-ray photoelectron spectroscopy (XPS) was conducted by Thermo Scientific ESCALAB 250Xi (UK) equipped with an electron flood gun and a scanning ion gun, using the Al Kα radiation (1486.6 eV) as the excitation source. The binding energy scale was calibrated with respect to adventitious carbon (C 1s).3. Results and discussion
3.1 Study on biosorption process
ln(qe − qt) = ln![[thin space (1/6-em)]](https://www.rsc.org/images/entities/char_2009.gif) qe − k1t qe − k1t
| (7) |
 | (8) |
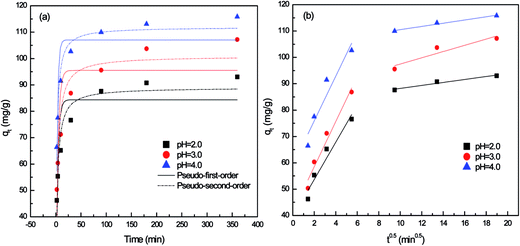 | ||
| Fig. 1 Non-linear kinetic fits of for P. vermicola biomass at different pH. (a) Pseudo-first-order and pseudo-second-order model; (b) intraparticle diffusion model. | ||
| Fitting models | Stages | Parameters | pH = 2.0 | pH = 3.0 | pH = 4.0 |
|---|---|---|---|---|---|
| Pseudo-first-order model | Experimental qe (mg g−1) | 93.038 | 107.734 | 115.791 | |
| Predicted qe (mg g−1) | 84.332 | 95.493 | 107.059 | ||
| K1 (L min−1) | 0.285 | 0.256 | 0.384 | ||
| R2 | 0.713 | 0.706 | 0.755 | ||
| Pseudo-second-order model | Predicted qe (mg g−1) | 89.000 | 100.929 | 111.934 | |
| K2 (g mg−1 min−1) | 0.005 | 0.004 | 0.006 | ||
| R2 | 0.916 | 0.905 | 0.953 | ||
| Intraparticle diffusion model | First stage | C (mg g−1) | 39.537 | 41.362 | 59.027 |
| Ki1 (mg g−1 min−0.5) | 7.068 | 8.569 | 8.456 | ||
| R2 | 0.918 | 0.953 | 0.875 | ||
| Second stage | C (mg g−1) | 82.579 | 85.637 | 104.421 | |
| Ki2 (mg g−1 min−0.5) | 0.564 | 1.183 | 0.609 | ||
| R2 | 0.928 | 0.788 | 0.962 |
As shown in Fig. 1a, the biosorption capacity of P. vermicola was significantly influenced by solution pH with the sorption capacity of 93.04 (pH 2.0), 107.15 (pH 3.0) and 115.79 (pH 4.0) respectively. And the Pd(II) biosorption was a rapid process, the adsorption reached equilibrium when the biomass contacted with Pd(II) for 180 min. The kinetic curve for Pd(II) showed rapid biosorption during the first 10 min at pH 4, with a Pd(II) removal efficiency of 80%.
The correlation coefficients in the pseudo-first-order model were in the range of 0.70–0.76 (Table 1), but the calculated qe were not consistent with the experimental qe values, since the pseudo-first-order model only represented kinetic experiment data of the rapid initial phase.2 Conversely, the pseudo-second-order model, based on the assumption that the rate-limiting step may be chemical sorption involving valency forces through sharing or exchange of electrons between sorbent and sorbate, provided the best correlation of the data.18,19 On the other hand, the rate constant calculated from both pseudo-first-order (k1) and pseudo-second-order (k2) at pH 2.0 and 3.0 were only 0.285, 0.005 and 0.256, 0.004, much lower than 0.384 and 0.006 at pH 4.0, which meant that the adsorption process was significantly hindered under low pH.
In contrast to pseudo-second-order model, the intraparticle diffusion model (eqn (9)) may provide a more comprehensive view of adsorption.
| qt = kit0.5 + C | (9) |
According to Weber and Morris, if the rate-limiting step is intraparticle diffusion, a plot of solute sorbed against the square root of the contact time should yield a straight line passing through the origin.20 If the plot shows multi-linearity, it indicates that further complexity exists in the adsorption process.21 Multi-linearity was clearly observed over the whole time range as shown in Fig. 1b, indicating that two steps governed adsorption rather than one. The first sharper stage was film physical diffusion, in which Pd(II) were transported onto the external surface of biomass. The second stage described the gradual biosorption, where metals were sorbed on the interior of the biomass and intraparticle diffusion was rate-limiting. As reflected in Table 1, the intraparticle diffusion rate constant in first stage was higher than that in later stage (ki1 > ki2), which were observed in pH 2.0, 3.0 and 4.0. It meant that the exterior surface adsorption was an instantaneous diffusion process. When exterior surface reached saturation, palladium ions entered the biomass on the second stage with increased diffusion resistance, resulting in a decrease of diffusion rates (ki2). As Min22,23 reported, the adsorption was controlled by two steps or more, including boundary layer or external diffusion, pore diffusion, surface diffusion and adsorption onto the pore surface, or a combination of several steps, of which the intraparticle diffusion step was the most rate-limiting procedure. The multi-linearity in the shape of the intraparticle diffusion plot had also been observed by Ofomaja in the biosorption of lead, methylene blue and methyl violet onto mansonia wood sawdust.21,24
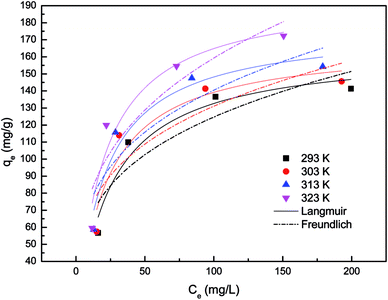
The saturated monolayer isotherm model can be represented as Langmuir, and the mathematical representation is given in eqn (10).
 | (10) |
The empirical Freundlich isotherm model, based on sorption on heterogeneous surface, is given by eqn (11).
| qe = KFCe1/n | (11) |
In present study, correlation coefficients (R2) showed that the Langmuir model fitted the Pd(II) biosorption data better than the Freundlich model, implying a monolayer adsorption trend.25 The isotherm data calculated from Freundlich isotherm (Table 2) revealed that the 1/n values for Pd(II) at 293, 303, 313 and 323 K were 0.281, 0.268, 0.278 and 0.307, respectively. The value of 1/n range between 0 and 1 further confirmed the favorable adsorption for palladium ions. Furthermore, the isotherms with n values greater than unity were classified as L-type isotherms which showed that there was high affinity between adsorbate and adsorbent surface.23,26 The maximum biosorption capacity calculated from Langmuir isotherm presented in Table 2 was 196.806 mg g−1 for the biosorption of Pd(II). This biosorption capacity is higher than those reported for Racomitrium lanuginosum27 and Escherichia coli.28
| Isotherm | T (K) | |||
|---|---|---|---|---|
| 293 | 303 | 313 | 323 | |
| Langmuir | ||||
| qm (mg g−1) | 164.313 | 168.101 | 177.659 | 196.806 |
| KL (L mg−1) | 0.042 | 0.048 | 0.050 | 0.052 |
| r2 | 0.930 | 0.882 | 0.923 | 0.907 |
![[thin space (1/6-em)]](https://www.rsc.org/images/entities/char_2009.gif) |
||||
| Freundlich | ||||
| 1/n | 0.281 | 0.268 | 0.278 | 0.307 |
| KF (mg g−1) (L mg−1)1/n | 34.144 | 38.142 | 39.073 | 38.791 |
| r2 | 0.743 | 0.681 | 0.734 | 0.779 |
ΔG0 = −RT![[thin space (1/6-em)]](https://www.rsc.org/images/entities/char_2009.gif) ln ln![[thin space (1/6-em)]](https://www.rsc.org/images/entities/char_2009.gif) KL KL
| (12) |
| ΔG0 = ΔH0 − TΔS0 | (13) |
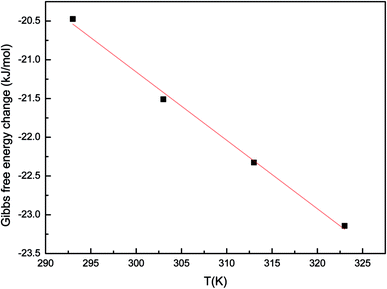
The Gibbs free energy change (ΔG0) and temperature (T) showed a linear relationship (Fig. 3). The values of ΔH0 and ΔS0 were determined from the slope and intercept of the plot. Gibbs free energy change (ΔG0) were −20.47, −21.51, −22.33, −23.14 kJ mol−1 for Pd(II) biosorption at 293, 303, 313 and 323 K, respectively. The enthalpy change (ΔH0) and the entropy change (ΔS0) for the biosorption process were 5.319 kJ mol−1 and 0.088 J mol−1 K−1, respectively. Negative values of ΔG0 confirmed the feasibility of the process and the spontaneous nature of biosorption with a high preference for palladium on P. vermicola. The value of ΔH0 was positive, indicating that the biosorption reaction was endothermic. In addition, negative enthalpy (ΔH0) was characteristic of metal ions coordination with amino and sulfhydryl groups, whereas coordination with oxygenous functional groups resulted in small positive enthalpies.29,30 The result implied that the Pd(II) might be bound to the oxygen atoms from active groups (e.g. –COOH and –OH) on the cell wall in this case. The positive value of ΔS0 reflected the affinity of P. vermicola for palladium ions and suggested some structural changes during the biosorption process. Further, positive value of ΔS0 showed increasing randomness at the solid/liquid interface during the biosorption of Pd(II) onto P. vermicola.25 Mehrorang et al. reported that the biosorption of Co2+, Cu2+, Ni2+, Pb2+ and Zn2+ ions onto Trichoderma reesei biomass was feasible, spontaneous and endothermic at the optimized conditions.31 Also, during the process of removal of Cd(II) and Cu(II) from aqueous solution by magnesium chloride-modified Lentinula edodes, the thermodynamic parameters determined indicated that the biosorption process was endothermic and spontaneous.32
3.2 Multi-scale visualization of Providencia vermicola biomass
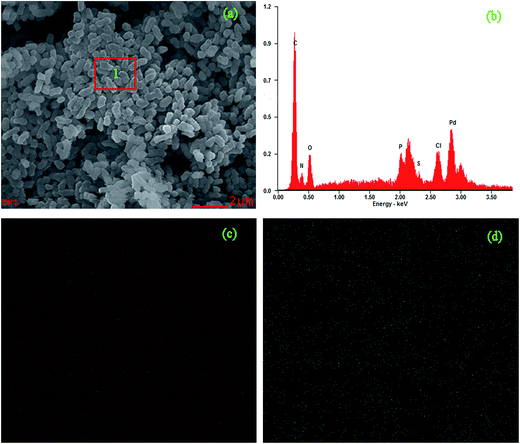
| Element | Wt% | At% |
|---|---|---|
| C | 45.55 | 62.50 |
| N | 13.55 | 15.94 |
| O | 14.14 | 14.56 |
| P | 02.95 | 01.57 |
| S | 01.09 | 00.56 |
| Cl | 04.32 | 02.01 |
| Pd | 18.40 | 02.85 |
3.3 Functional groups characterization
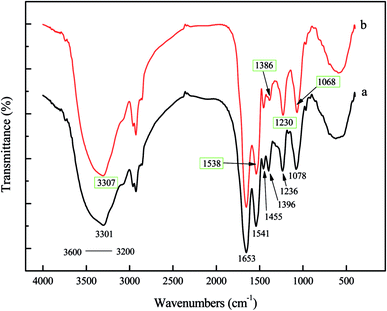
![[double bond, length as m-dash]](https://www.rsc.org/images/entities/char_e001.gif) O) and amide II (N–H) bonds of the protein peptide bonds.2,35 A strong bond at 1455 cm−1 was characteristic of –CH2 scissoring motion and –CH3 antisymmetrical bending vibration, which were common in peptidoglycan, LPS, and phospholipids.40,41 The symmetric stretching of COO− vibration appeared around 1396 cm−1,2,35,42 which had shifted to 1386 cm−1, demonstrated that carboxyl was a contributor in the sorption of Pd(II). Another strong bond around 1236 cm−1 was caused by functional groups, such as P
O) and amide II (N–H) bonds of the protein peptide bonds.2,35 A strong bond at 1455 cm−1 was characteristic of –CH2 scissoring motion and –CH3 antisymmetrical bending vibration, which were common in peptidoglycan, LPS, and phospholipids.40,41 The symmetric stretching of COO− vibration appeared around 1396 cm−1,2,35,42 which had shifted to 1386 cm−1, demonstrated that carboxyl was a contributor in the sorption of Pd(II). Another strong bond around 1236 cm−1 was caused by functional groups, such as P![[double bond, length as m-dash]](https://www.rsc.org/images/entities/char_e001.gif) O of polysaccharides and phospholipids inside the cell wall.41,43 The spectrum displayed adsorption peak at 1078 cm−1 moved to a lower frequency, which was related to the phosphate groups (P
O of polysaccharides and phospholipids inside the cell wall.41,43 The spectrum displayed adsorption peak at 1078 cm−1 moved to a lower frequency, which was related to the phosphate groups (P![[double bond, length as m-dash]](https://www.rsc.org/images/entities/char_e001.gif) O and P–O of the C–PO32− moiety).2,28,35 In contrast to the spectrum of blank biomass, the FTIR spectrum of palladium-loaded biomass showed that the peaks expected at 3301, 1541, 1396, 1236 and 1078 cm−1 had shifted to 3307, 1538, 1386, 1230, and 1068, respectively (Fig. 7). These shifts indicated that N–H, O–H, –COOH, P
O and P–O of the C–PO32− moiety).2,28,35 In contrast to the spectrum of blank biomass, the FTIR spectrum of palladium-loaded biomass showed that the peaks expected at 3301, 1541, 1396, 1236 and 1078 cm−1 had shifted to 3307, 1538, 1386, 1230, and 1068, respectively (Fig. 7). These shifts indicated that N–H, O–H, –COOH, P![[double bond, length as m-dash]](https://www.rsc.org/images/entities/char_e001.gif) O and P–O, might be the predominant contributors in the sorption of Pd(II). On the other hand, since there was no big difference between the spectra of blank P. vermicola biomass and palladium-loaded biomass, especially for the main characteristic absorption peak (amide I and amide II), indicating the structure and composition of P. vermicola was not destroyed after adsorbing palladium.
O and P–O, might be the predominant contributors in the sorption of Pd(II). On the other hand, since there was no big difference between the spectra of blank P. vermicola biomass and palladium-loaded biomass, especially for the main characteristic absorption peak (amide I and amide II), indicating the structure and composition of P. vermicola was not destroyed after adsorbing palladium.
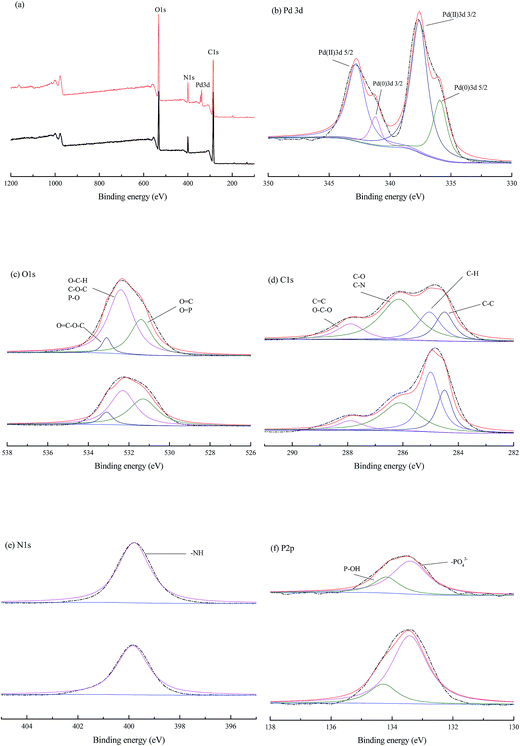
The O 1s signal (Fig. 8c) in blank cells fitted to three different peaks (531.3, 532.3 and 533.1 eV), which could be attributed to carbonyl oxygen in amide and carboxyl, oxygen atoms in hydroxyls or ethers and oxygen atoms in esters, respectively.35 A minor shift of the peaks at 531.3 and 532.3 eV to 531.4 and 532.4 eV indicated the role of carboxyl and hydroxyl groups in palladium binding. This result was also consistent with the negative enthalpy (ΔH0) in biosorption thermodynamics, which implied the Pd(II) might be bound to the oxygen atoms from active groups (e.g. –COOH and –OH) on the cell wall.
Deconvolution of the C 1s spectra (Fig. 8d) could generate four peaks at 284.5, 285.0, 286.1, and 287.9, which correspond to carbon making a single bond with carbon (C–C at 284.5 eV), carbon making a single bond with hydrogen (C–H at 285.0 eV), carbon bound to oxygen or nitrogen (C–O, C–N, at 286.1 eV, attributed to alcohol, amine or amide), carbon making two single bonds or one double bond with oxygen (C–O–C, C![[double bond, length as m-dash]](https://www.rsc.org/images/entities/char_e001.gif) O at 287.9, attributed to hemiacetal, acetal, amide and carboxylate).35,47 The carbon only bounded to carbon and hydrogen C– (C, H), might derive from lipids or the side chains of amino acids. Acetal or hemiacetal could arise from polysaccharides and sugar moieties.29 Further, the amide was expected to represent peptidic bonds, and carboxylate and carboxyl functional groups may be due to proteins and possibly uronic acids.48
O at 287.9, attributed to hemiacetal, acetal, amide and carboxylate).35,47 The carbon only bounded to carbon and hydrogen C– (C, H), might derive from lipids or the side chains of amino acids. Acetal or hemiacetal could arise from polysaccharides and sugar moieties.29 Further, the amide was expected to represent peptidic bonds, and carboxylate and carboxyl functional groups may be due to proteins and possibly uronic acids.48
The XPS spectrum (Fig. 8e) showed a single N 1s peak at 399.8 eV in both blank and palladium-loaded P. vermicola, attributable to nitrogen in –NH2 groups,2,11 which implied a single chemical environment in P. vermicola. The fitted P 2p envelope (Fig. 8f) indicated the presence of two components, positions of 133.3 and 134.2 eV, which corresponded to the P 2p3/2 and P 2p1/2 states of phosphorus in P. vermicola. The P 2p peak locating at 133.3 eV could be deconvoluted into contributions from the P(V) oxidation state, corresponding to the –[PO4]3−, while 134.2 eV corresponding to P–OH.49,50
In summary, both Pd(0) and Pd(II) were detected on the surface of P. vermicola biomass, and O atom was related to the biosorption of palladium ions. The peaks of C, N, P between blank and palladium-loaded P. vermicola remained unchanged, but the peak area ratio of binding energy peaks was different, which implied the possible sorption capabilities of those atoms. When comes to the biosorption of uranium by a novel Streptomyces sporoverrucosus dwc-3, the XPS and FT-IR analysis suggested that the absorbed uranium was bound to amino, phosphate and carboxyl groups of the cells.35
3.4 Functional groups confirmation
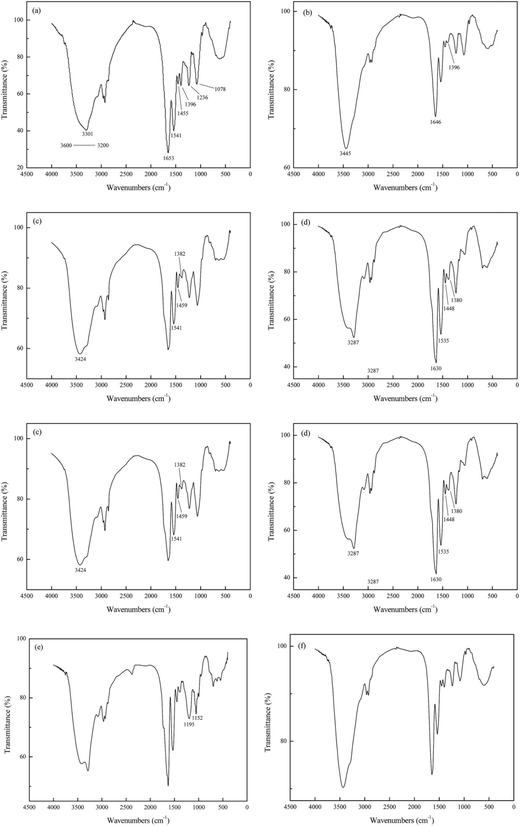
![[double bond, length as m-dash]](https://www.rsc.org/images/entities/char_e001.gif) O in amide I and COO− respectively, changed significantly. Specifically, the former shifted to 1646 cm−1, and the trough observed at 1396 cm−1 almost disappeared. In addition, the methanol-treated biomass clearly displayed shifts of O–H bond located at 3301 cm−1 because the addition of extra –OH in methanol.
O in amide I and COO− respectively, changed significantly. Specifically, the former shifted to 1646 cm−1, and the trough observed at 1396 cm−1 almost disappeared. In addition, the methanol-treated biomass clearly displayed shifts of O–H bond located at 3301 cm−1 because the addition of extra –OH in methanol.
Treatment of biomass with formic acid and formaldehyde gave rise to the methylation of amino groups as depicted in Fig. 9c. The peak at 3301 cm−1 (N–H and O–H bond) shifted to 3424 cm−1, which suggested certain changes had been happened to the amino groups presented in the biomass. The N–H bond at wave of 1541 cm−1 remained the same, indicating the major components and structure of biomass remained intact. On the other hand, the peak at 1396 cm−1 represented COO− shifted to 1382 cm−1, implying the modification not only changed the amide groups on the biomass but also the carboxyl groups. Furthermore, a change in the peak 1455 cm−1 in the spectrum of the treated sample confirmed the change in methyl as reaction (3) showed.
The Fig. 9d shows the FTIR spectrum of biomass treated with acetic anhydride and pyridine which could esterify the hydroxyl groups and the amines simultaneously. The hydroxyl and amine peaks at 3301 cm−1 represented N–H asymmetric stretching of the amines and O–H bond of the hydroxyl groups, and 1541 cm−1 represented N–H bonds in amide II. Those two peaks shifted to 3287 cm−1 and 1535 cm−1 respectively, verifying the modification of function group in biomass. Likewise, the peaks at 1653 cm−1, 1455 cm−1 and 1396 cm−1 moved to 1630 cm−1, 1448 cm−1 and 1380 cm−1 respectively, which might due to the residual acetic anhydride and formation of amino and acetic acid as reaction (4) showed.
The Fig. 9e displayed the FTIR spectrum of biomass treated with triethyl phosphite and nitromethane which could esterify the phosphate groups. The peaks at wave number of 1236 cm−1 and 1078 cm−1 moved to 1195 cm−1 and 1052 cm−1 with a very different spectral intensity in this chemically modified biomass.
As shown in Fig. 9f, the wave numbers of peaks in biomass treated with acetone remained a relative unchanged positions, which indicated the extraction of lipid fraction did not affect the structure and function groups of P. vermicola.
In summary, Fig. 9 showed a strong evidence of successful chemical modification on blank P. vermicola. Those modified biomass could be used to verify the effects of carboxyl, amine, hydroxyl, phosphate and lipid groups on the surface of cell wall.
In Pd(II) biosorption, the spectral analysis and biosorption test disclosed that the most efficient functional group on the cell wall of P. vermicola were carboxylic and hydroxyl groups which was followed by phosphate and amine groups. The effect of chemical modification on metal uptake capacity appeared to be biomass-dependent. As for Saccharomyces cerevisiae, although a reduction of 53.38% in lead biosorption was recorded due to methylation of amine groups, the drastic reduction by 96.34% when carboxylic acids was esterified, revealed that the carboxylic group contributed most significantly to lead biosorption.51 Another research demonstrated that both modification of carboxylic and amine groups on the cell wall of Saccharomyces cerevisiae resulted in the decrease of biosorption capacity, but copper biosorption was more sensitive to modifications of the amine groups than of the carboxyl group.52 On the other hand, Kılıç et al.15 reported that carboxylic acids were more effective in Pb(II) sequestration while amine groups turned out to be more effective in Hg(II) sequestration. Seki et al.53 showed that the interactions between the imidazol groups and the metal anions were relatively strong; however, the interactions between the amino groups and As(V) anions were very weak. Furthermore, Hydroxyl groups in the surface of Penicillium cyclopium were identified as providing the major sites of heavy metal deposition, followed by amides and carboxylates. Phosphate groups and the lipids fraction of the biomass did not play significant role in biosorption of the metal ions in the studied biomass.16 Carboxylate, amine and phosphate groups played an important role in the biosorption of metal ions by Mucor rouxii biomass.9
4. Conclusions
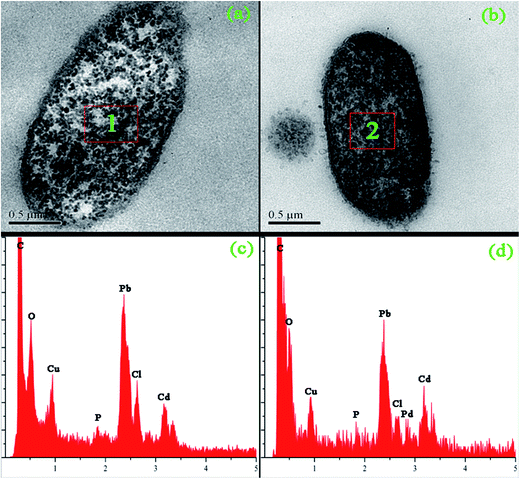
Results in this study showed the exact palladium uptake process, multi-scale visualization of palladium-loaded biomass and confirmed the contribution of functional groups to Pd(II) biosorption by P. vermicola biomass could be used as potential biosorbent for the recovery of Pd(II) from aqueous solutions (with an uptake of 115.79 mg g−1 under condition of pH 4, initial Pd(II) 200 mg L−1, 30 °C). The pseudo-first order, pseudo-second order and intraparticle diffusion model indicated that chemical reaction was significant in the rate-controlling step and two steps governed adsorption rather than one. For equilibrium isotherms, Langmuir model fitted the Pd(II) adsorption data better than the Freundlich model, implying a monolayer adsorption trend. During the biosorption of palladium ions onto P. vermicola, the process is spontaneous and endothermic, and the randomness at the solid/liquid interface increases. SEM-EDX and TEM-EDX analyses identified that palladium ions were sorbed into both the external and internal of P. vermicola biomass, and the wt% of Pd and Cl in the surface of biomass reached 18.40% and 4.32%, respectively. As it was showed in AFM images, the morphologic properties of the palladium-loaded biomass changed considerably in the nanometer range. After sorbing Pd(II), P. vermicola biomass and nanoparticle aggregates coagulated together to form large clumps, which could attributed to the interactions between palladium ions and the surface of P. vermicola surface. In addition, the FTIR analysis indicated the involvement of N–H, O–H, –COOH, P![[double bond, length as m-dash]](https://www.rsc.org/images/entities/char_e001.gif) O and P–O in the sorption of Pd(II). The sorbed palladium ions were of zero-valent and divalent forms, and O, C, N and P atoms might possess sorption capabilities. By chemical modification, the spectral analysis and biosorption test disclosed that the decreasing contribution order of different functional groups in P. vermicola surface was carboxylic groups, hydroxyl groups, phosphate groups and amine groups, which caused about 40%, 40%, 10% and 10% reduction of palladium uptake. Future studies should focus on the industrial application of P. vermicola biomass by increasing the functional groups of surface through chemical or biological modification.
O and P–O in the sorption of Pd(II). The sorbed palladium ions were of zero-valent and divalent forms, and O, C, N and P atoms might possess sorption capabilities. By chemical modification, the spectral analysis and biosorption test disclosed that the decreasing contribution order of different functional groups in P. vermicola surface was carboxylic groups, hydroxyl groups, phosphate groups and amine groups, which caused about 40%, 40%, 10% and 10% reduction of palladium uptake. Future studies should focus on the industrial application of P. vermicola biomass by increasing the functional groups of surface through chemical or biological modification.
Acknowledgements
This work was supported by the China Postdoctoral Science Foundation (2015T80880), the National Natural Science Foundation of China (51104189), the 53rd China Postdoctoral Science Foundation (2013M531814), and the State Key Laboratory of Advanced Technologies for Comprehensive Utilization of Platinum Metals (SKL-SPM-201508).References
- M. D. Yates, R. D. Cusick and B. E. Logan, ACS Sustainable Chem. Eng., 2013, 1, 1165–1171 CrossRef CAS.
- J. Park, S. W. Won, J. Mao, I. S. Kwak and Y. S. Yun, J. Hazard. Mater., 2010, 181, 794–800 CrossRef CAS PubMed.
- Q. Yi, R. Fan, F. Xie, Q. Zhang and Z. Luo, J. Taiwan Inst. Chem. Eng., 2016, 61, 299–305 CrossRef CAS.
- S. Morisada, Y. H. Kim, T. Ogata, Y. Marutani and Y. Nakano, Ind. Eng. Chem. Res., 2011, 50, 1875–1880 CrossRef CAS.
- S. W. Won, A. Lim and Y. S. Yun, Bioresour. Technol., 2013, 137, 400–403 CrossRef CAS PubMed.
- L. Le, H. Nan, D. Dexin, X. Xin, W. Yongdong, X. Jinhua, Z. Hui and T. Yan, RSC Adv., 2015, 5, 65827–65839 RSC.
- I. Michalak, K. Chojnacka and A. Witek-Krowiak, Appl. Biochem. Biotechnol., 2013, 170, 1389–1416 CrossRef CAS PubMed.
- E. A. Dil, M. Ghaedi, G. R. Ghezelbash, A. Asfaram, A. M. Ghaedi and F. Mehrabi, RSC Adv., 2016, 6, 54149–54161 RSC.
- G. Yan and T. Viraraghavan, Eng. Life Sci., 2008, 8, 363–371 CrossRef CAS.
- K. Chojnacka, A. Chojnacki and H. Gorecka, Chemosphere, 2005, 59, 75–84 CrossRef CAS PubMed.
- S. W. Won, J. Mao, I. S. Kwak, M. Sathishkumar and Y. S. Yun, Bioresour. Technol., 2010, 101, 1135–1140 CrossRef CAS PubMed.
- A. E. Abo-Amer, A. B. Ramadan, M. Abo-State, M. A. Abu-Gharbia and H. E. Ahmed, J. Basic Microbiol., 2013, 53, 477–488 CrossRef CAS PubMed.
- S. Omeike, S. Kareem, S. Adewuyi and S. Balogun, J. Life Sci., 2013, 15, 119–124 Search PubMed.
- A. Kapoor and T. Viraraghavan, Bioresour. Technol., 1997, 61, 221–227 CrossRef CAS.
- M. Kılıç, M. E. Keskin, S. Mazlum and N. Mazlum, Int. J. Miner. Process., 2008, 87, 1–8 CrossRef.
- K. Tsekova, D. Christova and M. Ianis, Journal of Applied Sciences and Environmental Management, 2006, 10, 117–121 CrossRef.
- J. Tobin, D. Cooper and R. Neufeld, Enzyme Microb. Technol., 1990, 12, 591–595 CrossRef CAS.
- J. Febrianto, A. N. Kosasih, J. Sunarso, Y. H. Ju, N. Indraswati and S. Ismadji, J. Hazard. Mater., 2009, 162, 616–645 CrossRef CAS PubMed.
- Y. S. Ho and G. McKay, Process Biochem., 1999, 34, 451–465 CrossRef CAS.
- W. J. Weber and J. C. Morris, J. Sanit. Eng. Div., Am. Soc. Civ. Eng., 1963, 89, 31–60 Search PubMed.
- A. E. Ofomaja, Bioresour. Technol., 2010, 101, 5868–5876 CrossRef CAS PubMed.
- M. Gan, S. Sun, Z. Zheng, H. Tang, J. Sheng, J. Zhu and X. Liu, Appl. Surf. Sci., 2015, 356, 986–997 CrossRef CAS.
- M. Gan, Z. Zheng, S. Sun, J. Zhu and X. Liu, RSC Adv., 2015, 5, 94500–94512 RSC.
- A. E. Ofomaja, Chem. Eng. J., 2008, 143, 85–95 CrossRef CAS.
- Y. S. Ho and A. E. Ofomaja, Biochem. Eng. J., 2006, 30, 117–123 CrossRef CAS.
- M. Jain, V. Garg, U. Garg, K. Kadirvelu and M. Sillanpaa, Int. J. Environ. Res., 2015, 9, 1079–1088 CAS.
- A. Sari, D. Mendil, M. Tuzen and M. Soylak, J. Hazard. Mater., 2009, 162, 874–879 CrossRef CAS PubMed.
- S. Kim, M. H. Song, W. Wei and Y. S. Yun, J. Hazard. Mater., 2015, 283, 657–662 CrossRef CAS PubMed.
- Z. Lin, J. Wu, R. Xue and Y. Yang, Spectrochim. Acta, Part A, 2005, 61, 761–765 CrossRef PubMed.
- J. Gardea-Torresdey, K. Tiemann, V. Armendariz, L. Bess-Oberto, R. Chianelli, J. Rios, J. Parsons and G. Gamez, J. Hazard. Mater., 2000, 80, 175–188 CrossRef CAS PubMed.
- M. Ghaedi, S. Hajati, F. Karimi, B. Barazesh and G. Ghezelbash, J. Ind. Eng. Chem., 2013, 19, 987–992 CrossRef CAS.
- H. Xie, Q. Zhao, Z. Zhou, Y. Wu, H. Wang and H. Xu, RSC Adv., 2015, 5, 33478–33488 RSC.
- L. Ramrakhiani, R. Majumder and S. Khowala, Chem. Eng. J., 2011, 171, 1060–1068 CrossRef CAS.
- S. Srivastava and I. S. Thakur, Curr. Microbiol., 2006, 53, 232–237 CrossRef CAS PubMed.
- X. Li, C. Ding, J. Liao, L. Du, Q. Sun, J. Yang, Y. Yang, D. Zhang, J. Tang and N. Liu, J. Environ. Sci., 2016, 41, 162–171 CrossRef PubMed.
- J. B. Omajali, I. P. Mikheenko, M. L. Merroun, J. Wood and L. E. Macaskie, J. Nanopart. Res., 2015, 17, 1–17 CrossRef CAS PubMed.
- K. Tamaoki, N. Saito, T. Nomura and Y. Konishi, Hydrometallurgy, 2013, 139, 26–29 CrossRef CAS.
- P. K. Stoimenov, R. L. Klinger, G. L. Marchin and K. J. Klabunde, Langmuir, 2002, 18, 6679–6686 CrossRef CAS.
- J. Pan, X. Ge, R. Liu and H. Tang, Colloids Surf., B, 2006, 52, 89–95 CrossRef CAS PubMed.
- J. Bai, H. Yao, F. Fan, M. Lin, L. Zhang, H. Ding, F. Lei, X. Wu, X. Li and J. Guo, J. Environ. Radioact., 2010, 101, 969–973 CrossRef CAS PubMed.
- J. Jena, N. Pradhan, B. Dash, L. Sukla and P. Panda, Int. J. Nanomater. Biostruct., 2013, 3, 1–8 Search PubMed.
- Y. Yin, Y. Hu and F. Xiong, Int. Biodeterior. Biodegrad., 2011, 65, 1012–1018 CrossRef CAS.
- H. P. Song, X. G. Li, J. S. Sun, S. M. Xu and X. Han, Chemosphere, 2008, 72, 616–621 CrossRef CAS PubMed.
- J. Wan, R. Ran, X. Wu, Y. Cao, M. Li, D. Weng and K. Huang, Catal. Today, 2015, 253, 51–56 CrossRef CAS.
- S. Yang, J. Dong, Z. Yao, C. Shen, X. Shi, Y. Tian, S. Lin and X. Zhang, Sci. Rep., 2014, 4, 1–6 CrossRef.
- J. Zhang, Y. Xu and B. Zhang, Chem. Commun., 2014, 50, 13451–13453 RSC.
- H. Bubert, W. Brandl, S. Kittel, G. Marginean and D. Toma, Anal. Bioanal. Chem., 2002, 374, 1237–1241 CrossRef CAS PubMed.
- F. Ahimou, C. J. Boonaert, Y. Adriaensen, P. Jacques, P. Thonart, M. Paquot and P. G. Rouxhet, J. Colloid Interface Sci., 2007, 309, 49–55 CrossRef CAS PubMed.
- Y. Shen, T. Xiong, H. Du, H. Jin, J. Shang and K. Yang, J. Sol-Gel Sci. Technol., 2009, 50, 98–102 CrossRef CAS.
- W. Gao, B. Feng, Y. Ni, Y. Yang, X. Lu and J. Weng, Appl. Surf. Sci., 2010, 257, 538–546 CrossRef CAS.
- K. Parvathi, R. Nagendran and R. Nareshkumar, Electron. J. Biotechnol., 2007, 10, 92–105 Search PubMed.
- W. Jianlong, Process Biochem., 2002, 37, 847–850 CrossRef.
- H. Seki, A. Suzuki and H. Maruyama, J. Colloid Interface Sci., 2005, 281, 261–266 CrossRef CAS PubMed.
| This journal is © The Royal Society of Chemistry 2017 |

