 Open Access Article
Ionic salt (4-ethoxybenzyl)-triphenylphosphonium bromide as a green corrosion inhibitor on mild steel in acidic medium: experimental and theoretical evaluation
Sudershan Kumar *a,
Madhusudan Goyal
 b,
Hemlata Vashishtc,
Vandana Sharmad,
Indra Bahadur
 *e and
Eno E. Ebenso
 e
e
aDepartment of Chemistry, Hindu College University of Delhi, Delhi-110007, India. E-mail: sudershankumar@hindu.du.ac.in; Tel: +91-9717952342
bDepartment of Chemistry, University of Delhi, Delhi-110007, India
cDepartment of Chemistry, Kirori Mal College, University of Delhi, Delhi-110007, India
dDepartment of Environmental Science, Deen Dayal Upadhayaya College, University of Delhi, Delhi-110078, India
eDepartment of Chemistry, School of Mathematical and Physical Sciences, Materials Science Innovation & Modelling Research Focus Area, Faculty of Agriculture, Science and Technology, North–West University (Mafikeng Campus), Private Bag X2046, Mmabatho 2735, South Africa. E-mail: bahadur.indra@nwu.ac.za
First published on 21st June 2017
Abstract
A new phosphonium salt (4-ethoxybenzyl)-triphenylphosphonium bromide (EBTPPB), having different substituents attached to phosphorous and having different anions, is investigated as an inhibitor for mild steel (MS) corrosion in 0.5 M H2SO4 solutions via electrochemical polarization and electrochemical impedance (EI) spectroscopy. Electrochemical results show that EBTPPB compound has practically good inhibiting features for MS corrosion in the corrosive medium with efficiencies of approximately 98% at an optimum 10−2 M concentration. The inhibition is of a mixed cathodic–anodic type. Passive potential (Epp) of the modified steel specimen is in the inactive region and thus inhibits the corrosion process. Langmuir Adsorption (LA) isotherm was performed to provide precise information on the adsorption behavior of the ionic salt. It exhibits both physisorption and predominantly chemisorption mechanism on MS surface. Scanning Electron Microscopy (SEM) associated with Energy Dispersion X-ray (EDX) and Atomic Force Microscopy (AFM) assessment of the electrode surface is consistent with the existence of adsorbing screen of EBTPPB molecules. An apparent connection was ascertained between the experimental corrosion inhibition efficiency (IE%) and the theoretical parameters using quantum chemical calculations.
1. Introduction
Corrosion inhibitors reduce the corrosion rate of metallic substances in acidic medium and have been universally applied in case of corrosive attack in crude oil purifier and chemical scratching.1–3 There are several classes of inhibitors, e.g. mixed, cathodic and anodic, passivated, precipitators, vapour phase, film forming type and absorbents.4–8 There are two processes involved in the action of the corrosion inhibitors: (i) the transfer of the inhibitor to the face of metal and (ii) the chemical interactions of the protector and the metal surface. The adsorption is influenced by the occurrence of a polar group in the inhibitor structure by which the molecules may connect themselves to the surface of the metal.9–12 Free electron pairs on heteroatoms or π electrons and polar groups containing nitrogen, oxygen, phosphorus and/or sulphur in the molecular structure are fundamental characteristics of good inhibitors.13–16 The structure and coverage of the inhibitory molecules both determine their inhibiting ability.17–19The phosphonium compounds belong to the class of ionic salts.20–22 The study of various compounds as inhibitors, including ammonium compounds, has been extensively carried out, but the structurally similar group of phosphonium-based ionic salts has not been fully explored. Quaternary phosphonium-based ionic salts are more thermally stable than ammonium and imidazolium-based ionic salts and therefore suitable for high-temperature reactions (up to 200 °C). High tunability is the most desirable property of ionic salts whereby on replacing the halide ion with the anionic functional group, several multifunctional ionic salts with numerous useful properties can be generated.16,23–26 Quaternary Phosphonium additives show biological properties against macro and micro-organisms and have the significant advantage of being “environment-friendly inhibitors”. Their benefits include low toxicity, less hazardousness, a rapid breakdown in the environment through biodegradation and hydrolysis, and no or little bioaccumulation.27,28 G. Singh et al., synthesized and worked on the anti-corrosion properties of various phosphonium compounds such as benzyl triphenyl phosphonium bromide (BTPPB)7,19 and butyl triphenyl phosphonium bromide (BTPB)29 for the corrosion of MS in acidic solutions. They also reported possible application of these compounds as green, eco-friendly compounds, which can be used in hydraulic oils and drilling fluids to provide corrosion protection. They improve the corrosion resistance of metals and can be applied to the substrate by immersion or be incorporated in a polymer coating. At the engineering level, their use is not only attributable to their efficiency but also to their safety.20,22,27–31 Phosphonium salts are considered as excellent corrosion inhibitors, particularly in acidic media. Khaled32 evaluated the inhibiting action of (chloromethyl)triphenyl phosphonium chloride, triphenyl(phenylmethyl)phosphonium chloride and tetraphenyl phosphonium chloride on the corrosion of iron in 1 M HCl solution. Other authors33 tested tetraphenyl phosphonium bromide as nickel corrosion inhibitor in sulfuric acid medium and also evaluated the effect of R+, X− (R+ = (C8H17)Ph3P+ or K+, X− = I− or Br− or Cl−) salts' addition on the corrosion of nickel in 1 M H2SO4 medium.34 The results achieved showed that phosphonium iodide addition modifies the interface behaviour due to the interaction between the molecule and the material surface. Tetrahydroxymethyl phosphonium sulfate is a well-known phosphonium salt that shows biocidal properties against sulfate-reducing bacteria (SRB), which produce sulfuric acid in oil industry. The major drawback of this compound is that it shows very low inhibition efficiency and therefore does not act as good protector against corrosion in the same environment. Therefore, a new phosphonium salt (4-ethoxybenzyl)-triphenylphosphonium bromide (EBTPPB), having different substituents attached to phosphorous and having different anions, was investigated as an inhibitor for mild steel (MS) corrosion in 0.5 M H2SO4 solutions via a variety of techniques such as galvanostatic polarization (GP), potentiostatic polarization (PP), temperature kinetics (TK) and electrochemical impedance (EI) studies. The facade morphology of the MS samples in the absence and presence of EBTPPB was investigated using SEM and AFM techniques. The theoretical consideration using quantum chemical calculation was used to corroborate the experimental results obtained.
2. Experimental
2.1. Material test
Mild steel (MS) rod coupons having composition (wt%) C = 1.92, Mn = 0.60, P = 0.17, Si = 0.15, and remainder Fe, having dimension 1 cm × 1 cm × 3 cm (L × B × H), were employed the as working electrode (WE) for electrochemical measurements. These coupons were accumulated in Araldite glue to facilitate merely 1 cm2 surface region to get in touch with the aggressive media. Before immersing the MS coupon in the respective solutions, it was mechanically polished to obtain a clean and smooth surface through emery papers of different marks i.e. 100, 320, 600, 1000 and 1500. It was mopped up with acetone and swabbed with condensed water to get rid of any particles from the surface.2.2. Inhibitor structure and test solution
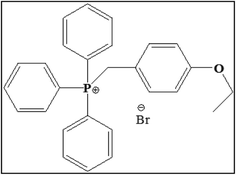
The chemical structure of the investigating inhibitor (4-ethoxybenzyl)-triphenylphosphonium bromide (EBTPPB) is shown in Fig. 1. It was obtained from Sigma-Aldrich Lab product and equipment, India. The corrosive solution was arranged by the strength of methodical H2SO4 (AR grade, 98%) with purified water. The different concentrations of EBTPPB (1 × 10⁻² M to 1 × 10⁻⁵ M) employed were prepared in 0.5 M H2SO4. Before each experiment, a freshly arranged solution was prepared in the research laboratory.2.3. Electrochemical measurements
For corrosion inhibition testing, electrochemical measurements were accomplished using galvanostatic, potentiostatic and AC impedance techniques utilizing CHI 760C electrochemical workspace (CH computer instruments, Austin, USA). A three-electrode system was used. MS served as the WE. A platinum foil was exercised the same as an auxiliary electrode (AE). The saturated calomel electrode (SCE) was paired to a luggin capillary pipe whose tilt was placed amid the WE and AE. This three-electrode cell assembly was then kept in a water bath so that the reaction attained a steady-state and/or the open circuit potential (OCP) turned out to be constant. AC impedance results were executed by an AC signal with an amplitude of 10 mV at OCP in the frequency sequence from 105 Hz to 0.1 Hz. The EIS variants, such as charge transfer resistance (Rct) and double layer capacitance (Cdl), were received from Nyquist spectra. Due to the AC impedance of MS in the presence of a mitigator, the data is made to fit with the corresponding impedance values of an equivalent circuit (EC). The process is performed using the software ZSimpWin Version 3.21. Tafel plots were executed from 298 K to 328 K for galvanostatic and at 298 K for the potentiostatic polarization. The potential range was scanned from −0.9 V to +0.0 V for galvanostatic and +0.0 V to +2.0 V for the potentiostatic polarization at the scan rate 0.001 V s−1.2.4. Surface morphological studies
Freshly polished MS samples were immersed in 0.5 M H2SO4 alone and with the addition of 10−2 M and 10−5 M of EBTPPB for 24 h at a temperature of 25 ± 2 °C. These were retrieved after 24 h, desiccated and subjected to SEM and AFM analyses. SEM and AFM measurements were performed using JEOL – JSM 6610 at the accelerating voltage of 20 kV at 5000× magnification and NAIO AFM Nano-surf easy scan model no. BT-02218 in high vacuum mode, respectively. SEM was correlated with EDX spectroscopy to make clear the nature of MS surface.2.5. Temperature kinetic study
The outcome of temperatures on the decay activities of MS in 0.5 M H2SO4 with the various concentrations from 10−2 to 10−5 M of EBTPPB was deliberated in the temperature variation of 298–328 K at a difference of 10 K with the Langmuir adsorption (LA) isotherm. The noticeable activation energy (Eact) of the corrosion reaction was determined. Thermodynamic adsorption descriptors such as the equilibrium constant (Kads), entropy change , enthalpy change
  , and free energy change
  for adsorption were evaluated to clarify the adsorption behavior of the MS surface.
2.6. Computational quantum chemical study
Quantum chemical (QC) calculations were performed via semi-empirical AM1 technique since it has proven to be decidedly authentic for computing the physical features of compounds from the software Hyper-Chem 8.0. Computational aspects such as the binding energy, the lowest unoccupied and highest occupied molecular orbital energy (ELUMO, and EHOMO respectively), energy gap (ΔEL–H = ELUMO − EHOMO), Mulliken's charges, activation hardness (γinh) and softness (σinh = 1/γinh), the portion of electrons transferred (ΔNinh) and dipole moment (μ) were calculated by the geometry optimization of the inhibitor and correlated with protective efficiency.3. Results and discussion
3.1. Galvanostatic polarization (GP) study
Tafel polarization lines were recorded for four different concentrations of (4-ethoxybenzyl)-triphenylphosphonium bromide (EBTPPB) viz., (…10−5 M), (…10−4 M), (…10−3 M) and (…10−2 M) at four temperatures from 298 K to 328 K at a difference of 10 K. The solutions were prepared in 0.5 M H2SO4. Fig. 2(a–d) illustrates the plots of E vs. log![[thin space (1/6-em)]](https://www.rsc.org/images/entities/char_2009.gif) I. These significances along with the data of the corrosion current (I), anodic and cathodic Tafel slopes (βa & βc, respectively), surface coverage (Θ) and inhibition efficiency (IEGP%) are tabulated in Table 1.
I. These significances along with the data of the corrosion current (I), anodic and cathodic Tafel slopes (βa & βc, respectively), surface coverage (Θ) and inhibition efficiency (IEGP%) are tabulated in Table 1.
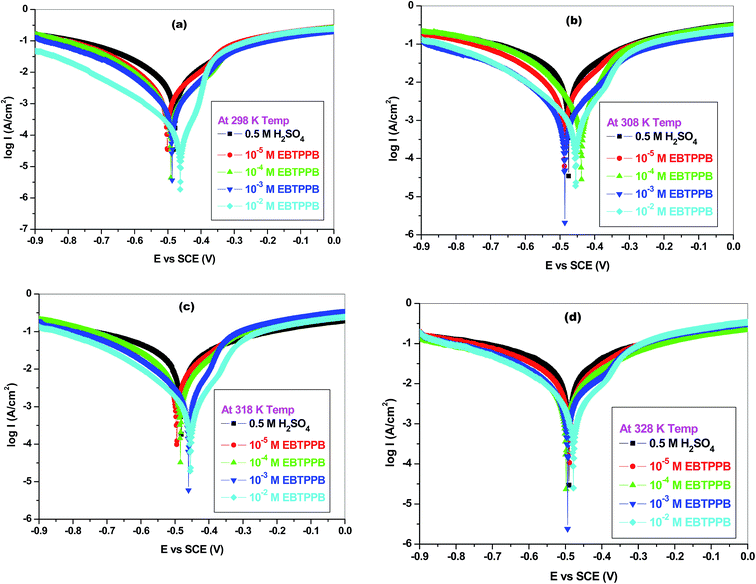 | ||
| Fig. 2 Tafel polarisation curves for MS in 0.5 M H2SO4 containing different concentrations of EBTPPB at temperatures (a) 298 K, (b) 308 K, (c) 318 K, and (d) 328 K. | ||
| Temp. (K) | Conc. (M) | −Ecorr (mV) | βc (mV dec−1) | βa (mV dec−1) | Icorr (mA cm−2) | IE (%) | Θ |
|---|---|---|---|---|---|---|---|
| 298 | H2SO4 | 465 | 164.2 | 141.6 | 8.8050 | — | — |
| 10−5 | 501 | 120.7 | 108.3 | 1.8601 | 78.87 | 0.7887 | |
| 10−4 | 491 | 118.5 | 111.7 | 0.9750 | 88.92 | 0.8892 | |
| 10−3 | 487 | 110.1 | 96.99 | 0.6881 | 92.18 | 0.9218 | |
| 10−2 | 483 | 114.2 | 138.2 | 0.1619 | 98.16 | 0.9816 | |
| 308 | H2SO4 | 475 | 189.3 | 168.8 | 14.990 | — | — |
| 10−5 | 487 | 142.2 | 116.3 | 4.3981 | 70.66 | 0.7066 | |
| 10−4 | 438 | 107.5 | 95.53 | 1.9350 | 87.09 | 0.8709 | |
| 10−3 | 486 | 122.9 | 111.7 | 1.2031 | 91.97 | 0.9197 | |
| 10−2 | 501 | 150.8 | 129.6 | 0.0206 | 98.62 | 0.9862 | |
| 318 | H2SO4 | 481 | 208.1 | 196.4 | 16.390 | — | — |
| 10−5 | 495 | 175.6 | 145.0 | 7.5831 | 53.73 | 0.5373 | |
| 10−4 | 484 | 153.6 | 114.1 | 5.0210 | 69.36 | 0.6936 | |
| 10−3 | 460 | 130.5 | 98.25 | 1.4470 | 91.17 | 0.9117 | |
| 10−2 | 455 | 133.1 | 94.90 | 0.7994 | 95.12 | 0.9512 | |
| 328 | H2SO4 | 490 | 212.5 | 172.4 | 18.23 | — | — |
| 10−5 | 497 | 180.6 | 148.6 | 10.580 | 41.96 | 0.4196 | |
| 10−4 | 498 | 171.7 | 166.9 | 7.1180 | 60.95 | 0.6095 | |
| 10−3 | 494 | 157.9 | 149.5 | 5.0231 | 72.44 | 0.7244 | |
| 10−2 | 478 | 153.6 | 105.6 | 2.5380 | 86.07 | 0.8607 |
Inhibition efficiency (IE%) was calculated using the expression35
 | (1) |
Surface coverage (θ) was calculated using
 | (2) |
At all four temperatures and for all four concentrations of EBTPPB, it was observed that the Icorr decreased compared to that of 0.5 M H2SO4 alone. The IEGP (%), as given in Table 1, rose with the increase in the concentration of EBTPPB but decreased with a move up in temperature. It signifies that EBTPPB molecules are adsorbed on the surface of MS at higher concentrations, leading to greater θ. A comparison of IEGP (%) values of EBTPPB with BTPPB36 revealed that EBTPPB exhibits better corrosion inhibition potentials than BTPPB over the concentration and temperature ranges considered in this study. This higher inhibition and adsorption are attributed to the existence of aromatic rings and conjugated π electrons and ethoxy (–OCH2CH3) as electron donating group, which serve as adsorption positions for their interaction with the MS surface.
The lopsided values of cathodic and anodic Tafel slopes indicate that two different types of mechanisms are involved in the inhibitory action of EBTPPB on the corrosion of MS surface. This could be (a) adsorption of EBTPPB molecules on the MS surface, thereby creating a boundary on the MS surface which separates it from the surroundings and (b) the synergistic effect offered by some other anions like bromide (Br−) ions present in the solution. Since, the inhibition efficiency is observed to be higher at higher concentrations of EBTPPB, it can be construed that molecules of EBTPPB get adsorbed on the surface of MS almost entirely.37
The corrosion potential values (Ecorr) do not swing much from the corresponding value of MS in 0.5 M H2SO4. When the change in Ecorr > ±85 mV/SCE compared to Eacid, the mitigator may be judged to be anodic or cathodic in nature. When the shift in Ecorr < ±85 mV/SCE, the corrosion mitigator can be observed the same as a mixed model. However, in the present case, the potential displacement is less than 50 mV/SCE, which authenticates that EBTPPB performs as a mixed nature of inhibitor.38,39
3.2. Electrochemical impedance spectroscopy (EIS)
From the characterization of simple electrode processes for analysis of very complex interfaces, a method that has gained much relevance and popularity in recent times is now known as Electrochemical Impedance Spectroscopy (EIS). The most critical applications that can be studied using EIS are for testing corrosion, researching batteries and numerous other surface treatments, e.g., coating, etc.40,41 An attempt is made to investigate the performance of an ionic salt EBTPPB compound as an inhibitor of corrosion for MS using impedance spectra. Nyquist and Bode spectra of MS in sulfuric acid with and without various concentrations of EBTPPB are specified in Fig. 3(a) and (b), respectively, and data observed from these spectra are tabulated in Table 2.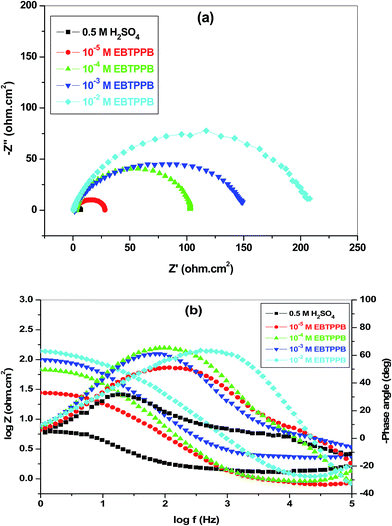 | ||
| Fig. 3 Impedance plots for MS in 0.5 M H2SO4 and in the presence of various concentrations of EBTPPB at 298 K. (a) Nyquist plot, and (b) Bode plot. | ||
| Solutions | Concentration (M) | Rct (Ω cm2) | Cdl (μF cm−2) | fmax | IE (%) |
|---|---|---|---|---|---|
| H2SO4 | 0.5 | 4.954 | 15![[thin space (1/6-em)]](https://www.rsc.org/images/entities/char_2009.gif) 935 935 |
2.017 | — |
| EBTPPB | 10−5 | 28.26 | 554.5 | 10.16 | 82.47 |
| 10−4 | 103.2 | 37.87 | 40.74 | 95.19 | |
| 10−3 | 173.4 | 20.17 | 45.52 | 97.14 | |
| 10−2 | 221.8 | 10.88 | 66.02 | 97.77 |
The inhibition efficiency was obtained using the following expression (eqn (3)):
 | (3) |
| Rct = Rp − Rs | (4) |
The double layer capacitance, Cdl is also calculated using the following relation (eqn (5)):42
 | (5) |
Impedance spectra in the Nyquist plot have a semicircle loop and the span of the semicircle is enhanced with improving the inhibitor concentrations of EBTPPB. The single capacitive loop indicates that a charge transfer process principally controls the rust of MS. Moreover, the AC impedance spectrum contains a depressed semicircle, which indicates the surface heterogeneity due to roughness, fractal structures, inhibitor's adsorption and distribution of activity centers. The EIS results for EBTPPB on MS surface are simulated by an equivalent circuit (EC) revealed in Fig. 4(c) obtained in accordance with the data fitting curve illustrated in Fig. 4(a and b) with a χ2 value of 3.15 × 10⁻⁴. The superiority of fitting to EC was reviewed by chi-square value. The small value of χ2 indicates a better fit.26,43,44
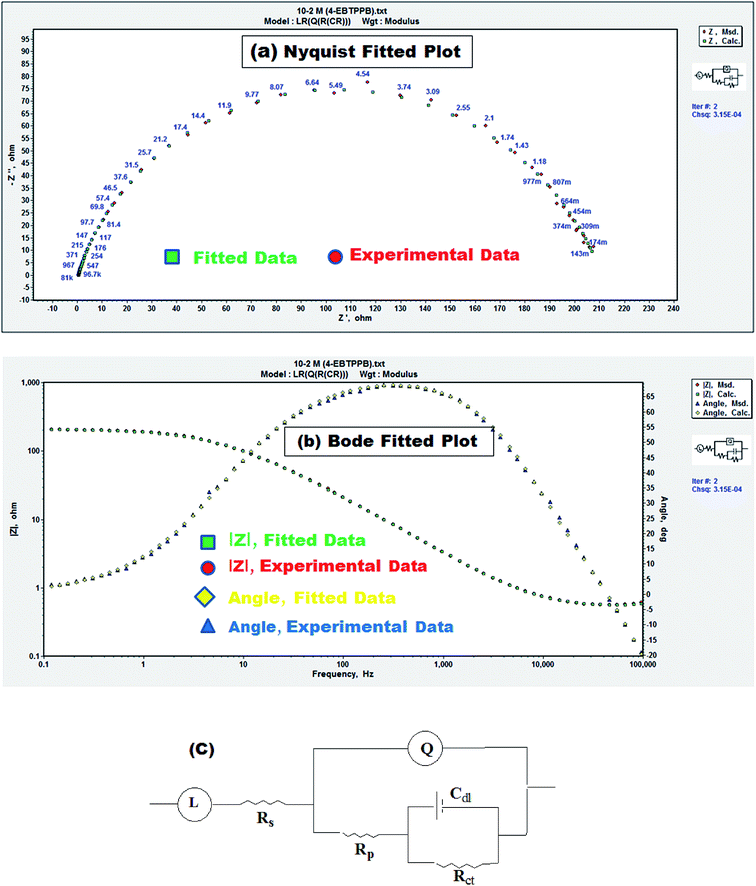 | ||
| Fig. 4 (a) Nyquist fitting, (b) Bode fitting and (c) equivalent circuit corresponding to experimental data (MS in 0.5 M H2SO4 in the presence of 10−2 M of EBTPPB). | ||
As seen from Table 2, it is apparent that the Rct data are enhanced by enhancing the concentration (0.00001 to 0.01 M) of EBTPPB, signifying that the corrosion rate declines. Cdl values reduce with the accumulation of EBTPPB, resulting in a reduction in the dielectric constant (ε0) and a rise in the wideness of the electrical double shield layer, recommending the creation of the shielding layer on the Fe surface.45
3.3. Potentiostatic polarization study (PPS)
Research was executed on the transition of MS rod from active to the passive region in the corrosive medium. It was observed that the active–passive transformation was an auto-catalytic route in which a pre-passive layer develops on the sample surface. Passive screen functions as a blockade, inhibiting the oxidation reaction (Fe dissolution) at the anodic regions. This inhibition mechanism was usually recognized as metal/MS passivation also noticed in the inhibited system EBTPPB.46,47The potentiostatic action of the anodic dissolution of MS in the acidic standard in the occurrence of various concentrations (10−2 to 10−5 M) of EBTPPB was investigated, and the anodic dissolution parameters such as critical current (Ic), passive potential (Epp), passive current (Ip) were obtained from Fig. 5 and reported in Table 3. Ic was seen to decrease with increasing concentrations of EBTPPB. The values of Ip were also inferior compared with dissolution in EBTPPB alone. The passivation range is the highest at 558–1652 mV for the lower concentration of EBTPPB, which suggests that EBTPPB molecules get adsorbed at a lower concentration (10−5 M) on the MS surface. The mechanism followed is that of adsorption of (M–Ln)ads molecules as well as the synergistic effect offered by the bromide ion. EBTPPB works as an excellent passivator on MS surface in 0.5 M H2SO4.
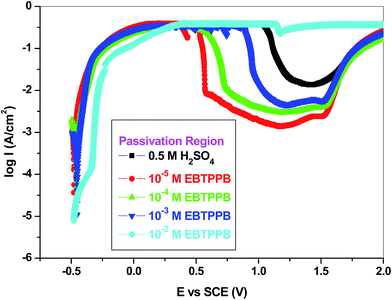 | ||
| Fig. 5 Potentiostatic polarisation curves for MS in 0.5 M H2SO4 containing different concentrations of EBTPPB at 298 K. | ||
| Solutions | Concentration (M) | Ic (mA cm−2) | Ip (mA cm−2) | Epp (mV) |
|---|---|---|---|---|
| H2SO4 | 0.5 | 376.0 | 35.1 | 1377–1552 |
| EBTPPB | 10−5 | 235.4 | 9.04 | 558–1652 |
| 10−4 | 269.6 | 21.5 | 607–1611 | |
| 10−3 | 356.3 | 29.2 | 1098–1547 | |
| 10−2 | — | — | — |
3.4. Scanning electron microscopy (SEM)
To examine the surface morphology and acquire an apparent understanding of the nature of adsorptions, scanning electron micrographs were recorded. Fig. 6(a) shows SEM images of polished bare MS surface, which is free from any pits and cracks. Fig. 6(b) displays the damaged surface and the formation of corrosion products i.e. FeO2 on the MS surface in the corrosive medium. Fig. 6(c and d) illustrates the morphology of the MS surface after corrosion in the presence of the EBTPPB. This is evident from the micrographs that the corrosion of MS in the acid media was inhibited substantially in comparison with those in the absence of EBTPPB.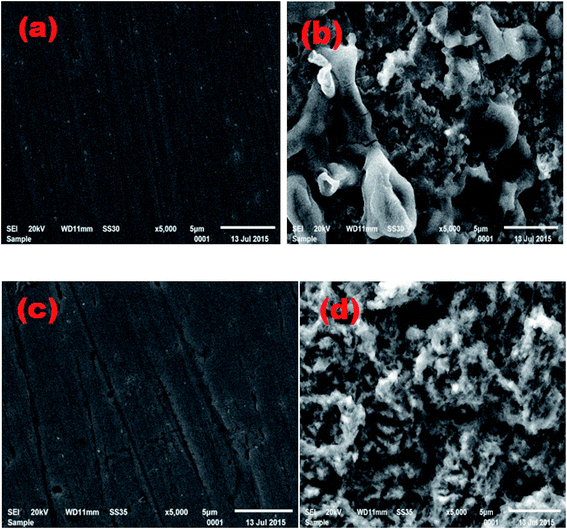 | ||
| Fig. 6 SEM images of (a) plain MS surface, (b) MS in 0.5 M H2SO4, (c) MS in 0.5 M H2SO4 + 10−2 M EBTPPB, (d) MS in 0.5 M H2SO4 + 10−5 M EBTPPB, after 24 h exposure at the ×5000 magnification. | ||
SEM reveals that less corrosion occurred on the MS surface at the time the concentration of additive was 1 × 10⁻² M for EBTPPB. This may happen due to the involvement of π-electrons present due to conjugation in the phenyl rings. The benzyl group and the phenyl rings seem to blanket the facade of MS in the presence of EBTPPB as an inhibitor as the percentage of carbon is more on the surface. More corrosion is viewed on the sample surface when the concentration of the additive is trimmed down to 1 × 10⁻⁵ M. Its scrutiny also reports the high inhibition efficiency values achieved during the polarization studies of the EBTPPB inhibitory system.48,49
3.5. Energy dispersive X-ray spectroscopy (EDX)
EDX spectroscopy presents the significance of the intensity and composition of the areas on the MS coupons regarding atomic percent.50,51 EBTPPB has been investigated as the inhibitor of corrosion of MS. As a shred of evidence for its potential to inhibit corrosion of MS in acidic medium, the energy dispersive spectra of MS surface is recorded in 10−2 M and 10−5 M of EBTPPB. The EDX spectra demonstrated in Fig. 7(a–d) correspond to the SEM in Fig. 6(a–d), and the related information in terms of atomic percent is reported in Table 4.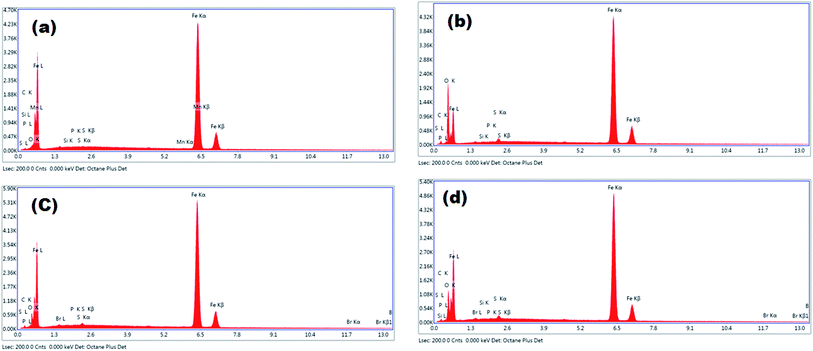 | ||
| Fig. 7 EDXS spectra of (a) plain MS surface, (b) MS in 0.5 M H2SO4, (c) MS in 0.5 M H2SO4 + 10−2 M EBTPPB, (d) MS in 0.5 M H2SO4 + 10−5 M EBTPPB. | ||
| Solutions | Fe | O | S | P | Br | C |
|---|---|---|---|---|---|---|
| Plain mild surface | 86.02 | 4.470 | 0.25 | 0.28 | — | 8.02 |
| 0.5 M H2SO4 | 54.91 | 32.01 | 0.79 | 0.15 | — | 11.94 |
| 10−5 M EBTPPB | 68.64 | 18.86 | 1.03 | 0.22 | 0.27 | 11.41 |
| 10−2 M EBTPPB | 77.13 | 10.46 | 0.63 | 0.34 | 0.14 | 10.12 |
The spectra in Fig. 7(b) show the peak for iron (Fe) and oxygen (O), signifying the formation of iron oxide/hydroxide on the surface of the MS sample. The spectra of inhibited specimens {Fig. 7(c and d)} that facilitated the Fe lines were noticeably suppressed when judged against the polished (Fig. 7(a)) and uninhibited (Fig. 7(b)) spectra of MS surface. Inhibition of Fe lines was because of the inhibitory shield that existed on the MS surface. The (%) atomic content of Fe for MS in 0.5 M H2SO4 solution is 54.91% and those for MS dipped in an optimum 10−2 M (higher) and 10−5 M (lower) concentration of EBTPPB are 77.13% and 68.64%, respectively. These results specified that the MS surface was coated with the protective shape of EBTPPB molecules. The composition of the MS surface explained that the adsorption of EBTPPB protected the corrosion through π-electron conjugated in aromatic phenyl rings and benzyl group attached with electron donating group. EDX with SEM analysis offered a powerful indication for the existence of EBTPPB protective coating over the MS surface.
3.6. Atomic force microscopy (AFM)
AFM serves as a potent tool for the examination and characterization of a variety of samples from nanometer to micrometer length scales.52,53 The AFM image of the abraded surface (Fig. 8(a)) of the MS without any pre-treatment with sulphuric acid and the inhibitor compound was obtained first. Then, three other MS samples were prepared by immersing them in 0.5 M sulphuric media uninhibited and inhibited in 1 × 10⁻² M and 1 × 10⁻⁵ M concentrations of EBTPPB for 24 hour, and images were recorded at a temperature of 298 K.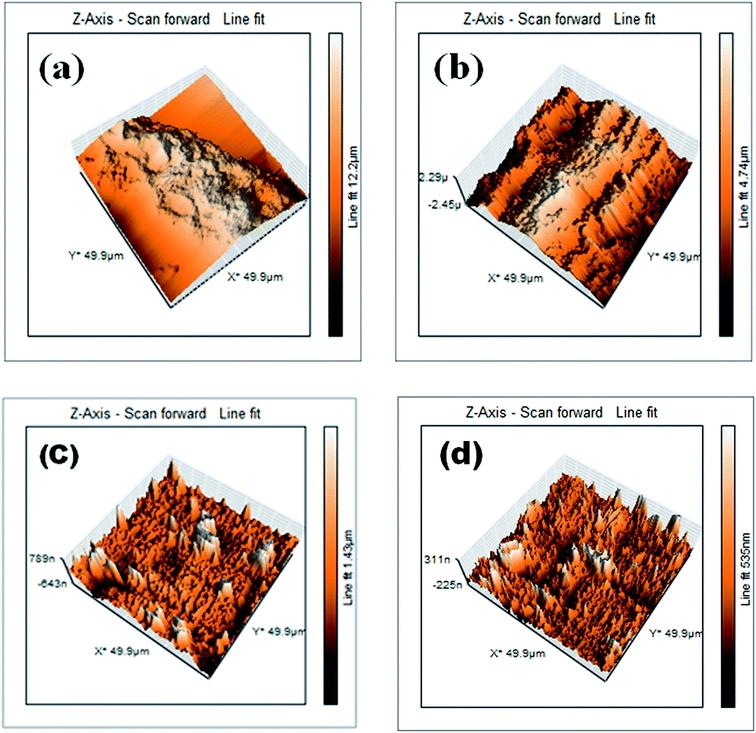 | ||
| Fig. 8 AFM images of (a) abraded MS surface, (b) MS in 0.5 M H2SO4, (c) MS in 0.5 M H2SO4 + 10−2 M EBTPPB (d) MS in 0.5 M H2SO4 + 10−5 M EBTPPB. | ||
The Fig. 8(b) clearly shows the extent of corrosion in the presence of sulphuric acid. Deep pits and cracks were seen, which showed the degree of surface damage. The MS surface could be quantitatively analyzed by evaluating the roughness of metal surface (RMS) area. The value of the RMS in sulphuric acid is 668.2 nm. The higher value of RMS in the presence of 0.5 M H2SO4 signifies the greater extent of corrosion. The Fig. 8(c) indicates that the MS surface was shielded with 10−2 M of EBTPPB inhibitor molecules giving it a large extent of protection in opposition to corrosion, thereby decreasing the RMS value to 111.1 nm. As the number of inhibitory molecules decreased in 10−5 M of EBTPPB solution, the MS surface was protected to a lesser extent as can be assured from Fig. 8(d), and the RMS value increased to 188.4 nm in comparison to the value obtained with 10−2 M EBTPPB solutions. RMS values through the AFM study of the metal surface authenticated the existence of adsorption barriers of EBTPPB.
3.7. Adsorption isotherm and temperature kinetic effect
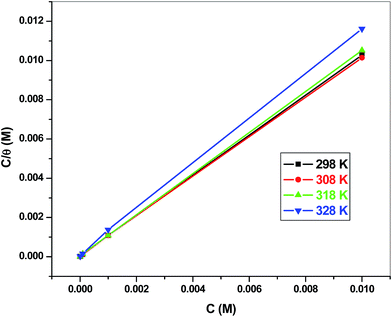
The adsorption isotherm confers an insight into the adsorption mechanism and perception on the metal–inhibitor relations and can be ascribed from the curve of surface coverage rate aligned with the inhibitor concentrations. To investigate the adsorption procedure of EBTPPB on MS, respective adsorption isotherms were trialled for the explanation of the adsorption mechanism.54 The value of correlation constant (R2) obtained in the plots of C/θ versus C (Fig. 9) equal to or close to 1 indicates that Langmuir adsorption (LA) isotherm is followed by a particular adsorption process at an appropriate temperature. The following equation (eqn (6)) represents the adsorption isotherm relationship for Langmuir adsorption isotherm:55
 | (6) |
The Kads is interrelated to the change in free energy of adsorption  according to the following relation:
 | (7) |
The change in enthalpy of adsorption  was calculated via the Van't Hoff equation.
 | (8) |
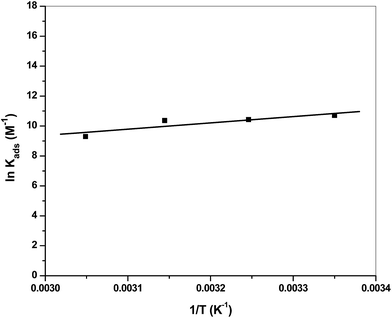
Enthalpy values were worked out from the slope  of the scheme of the natural logarithm of Kads versus 1/T, which is depicted in Fig. 10 and tabulated in Table 5.
The values of  and
and  obtained from eqn (7) and (8), respectively, can now be substituted in eqn (9) to calculate the entropy of the adsorption process using the following equation:
 | (9) |
On rearrangement of eqn (9), we get eqn (10) as follows:
 | (10) |
The thermodynamic parameters achieved from LA isotherm for EBTPPB are reported in Table 5. The mitigating mechanism is customarily clarified with the creation of a physically and/or chemically type adsorbed shield on the sample. The assessments of (−)  signify a spontaneous adsorption practice and strength of the adsorbed barrier of the protector for the sample face. Usually, when
  is approximately −20 kJ mol−1, the type of adsorption is considered to be a physical adsorption, while when
  is approximately −40 kJ mol−1 or lesser, the type of adsorption is considered to be a chemical adsorption. The
  values in the current research exist from −36.4 to −38.9 kJ mol−1, which indicate that the adsorption of EBTPPB molecules allows chemisorptions to dominate. The negative values of
  for EBTPPB inhibitor indicated that the activated compound in the rate determining measure characterizes an association more than a dissociation action, indicating that a reduction in chaos takes place from the substrate through the intermediate to the (Fe/EBTPPB) activated complex. Generally, for physisorption,
  is lesser than 40 kJ mol−1, whereas for chemisorption approaches, it is 100 kJ mol−1. The absolute
  assessed for adsorption of EBTPPB was 44.78 kJ mol−1, which was higher than 40 kJ mol−1 and indicated that the adsorption of inhibitor employed was exothermic, and chemisorption took place predominantly.56–58
3.8. Activation energy
Activation descriptors have a significant role in recognizing the inhibiting mechanism. The galvanostatic polarization study (Table 1) was completed in the range of 298–323 K temperature using several concentrations of EBTPPB ionic salt inhibitor in 0.5 M H2SO4 for MS. The activation energy (Eact) associated with current rate can be expressed via the Arrhenius relation59
log![[thin space (1/6-em)]](https://www.rsc.org/images/entities/char_2009.gif) (Icorr) = log (Icorr) = log![[thin space (1/6-em)]](https://www.rsc.org/images/entities/char_2009.gif) A − (−Eact/2.303RT) A − (−Eact/2.303RT)
| (11) |
![[thin space (1/6-em)]](https://www.rsc.org/images/entities/char_2009.gif) I against 1/T (K) for the oxidization of MS in 0.5 M H2SO4 solutions without or with the presence of EBTPPB at a level ranging from 10−5 M to 10−2 M. In Fig. 11(a), the slope of every linear fit line is specified, and Eact is computed {Eact = 2.303 × R × (slope)}. A graph shown in Fig. 11(b) is plotted between the activation energy and various concentrations of the inhibitor EBTPPB. Scrutiny of Table 6 reveals that Eact values are not too high except at 10−2 M concentration for the inhibited medium (EBTPPB + acid) than uninhibited medium (acid alone), demonstrating a comprehensive route (physisorption and chemisorption) of adsorption action. The active barrier is slighter low, easing the formation of Fe2+ ions, which act together with the EBTPPB ionic salt to appear as a protective shape.60
I against 1/T (K) for the oxidization of MS in 0.5 M H2SO4 solutions without or with the presence of EBTPPB at a level ranging from 10−5 M to 10−2 M. In Fig. 11(a), the slope of every linear fit line is specified, and Eact is computed {Eact = 2.303 × R × (slope)}. A graph shown in Fig. 11(b) is plotted between the activation energy and various concentrations of the inhibitor EBTPPB. Scrutiny of Table 6 reveals that Eact values are not too high except at 10−2 M concentration for the inhibited medium (EBTPPB + acid) than uninhibited medium (acid alone), demonstrating a comprehensive route (physisorption and chemisorption) of adsorption action. The active barrier is slighter low, easing the formation of Fe2+ ions, which act together with the EBTPPB ionic salt to appear as a protective shape.60
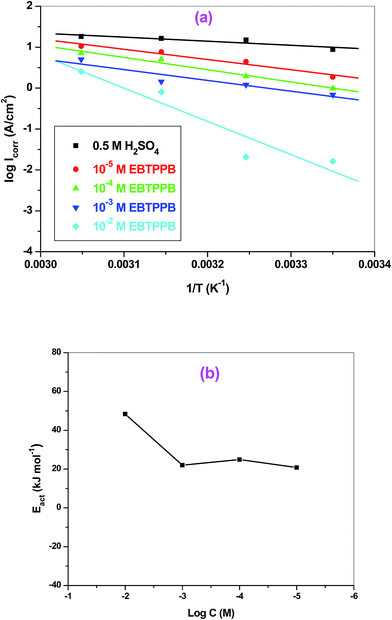 | ||
| Fig. 11 (a) Arrhenius plot for MS in 0.5 M H2SO4 without and with various concentrations of EBTPPB, (b) plot of activation energy vs. inhibitor concentrations. | ||
| Concentration (M) | Ea (kJ mol−1) |
|---|---|
| 0.5 M H2SO4 | 18.93 |
| 10−5 | 20.75 |
| 10−4 | 24.89 |
| 10−3 | 21.96 |
| 10−2 | 48.54 |
3.9. Quantum chemical calculation (QCC)
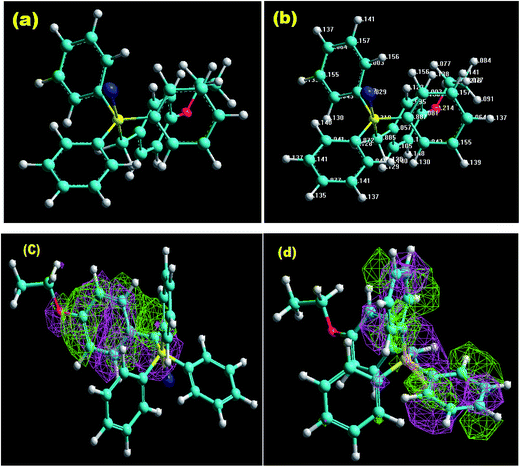
Computational chemistry is not only operated as a viewing tool to examine several chemical compounds but also prominently to modernize an understanding of the behaviour of the various coordinations as a function of their structural characteristics.61–63 The optimized geometry and Mulliken's charges are given in Fig. 12(a) and (b). Fig. 12(c) and (d) give the 3-D isosurface map of EHOMO and ELUMO, respectively. The various optimized AM1 parameters for EBTPPB are reported in Table 7 and associated with their inhibitor effectiveness.| Total energy (kcal mol−1) | −106![[thin space (1/6-em)]](https://www.rsc.org/images/entities/char_2009.gif) 439 439 |
| Energy of HOMO (eV) | −7.8164 |
| Energy of LUMO (eV) | −0.4340 |
| Energy gap (ΔEL–H) | 7.3824 |
| Binding energy (kcal mol−1) | −6096.5 |
| Softness (σ) eV | 0.2710 |
| Global hardness (γ) eV | 3.6887 |
| Number of transfer electron (ΔNinh) | 0.3893 |
As indicated by the Frontier molecular (FM) orbital speculation,64,65 the pattern of an intermediate position is an outcome of relations among the FM orbital (LUMO and HOMO) of reactants. The ELUMO − EHOMO (ΔE) gap is an essential stability key. A small LUMO − HOMO energy gap leads to high experimental protective efficiency and stability of the protector in chemical reactions. In the present research, EBTPPB inhibitor has the lowest ΔE value 7.3774 eV, which assists its adsorption on the MS surface.66
The concepts of activation hardness (γinh) and softness (σinh) have also been defined by the LUMO − HOMO energy space. To justify this, the following formula was used:67,68
 | (12) |
 | (13) |
The number of transferred electrons (ΔNinh) from the EBTPPB protector to MS sample surface was also computed using the following relation:69
 | (14) |
 | (15) |
To evaluate the ΔNinh, hypothetical data of the electronegativity of Fe, χFe nearly equal to 7 eV mol−1, and γFe = 0 eV mol−1 and calculated EHOMO (−7.8164 eV) and ELUMO (−0.4340 eV) were used for EBTPPB (see Table 7). As stated by Awad's study,70 when the ΔNinh value was less than 3.6, the mitigation efficiency improved with enhanced electron-releasing power at the surface of the sample. The value of ΔNinh (0.3893) signifies the number of electrons departing from the donor and going into the acceptor molecule.67 An enhancement in electron donating capability was evinced by electron donating substituent (–OCH2CH3 group attaches with benzyl group), which enlarges the protection efficiency. It may be insisted that EBTPPB has a high ability to adsorb on the MS surface.
The confined electron densities or charges are necessary for understanding the physicochemical properties of molecules. Mulliken charge scrutiny is frequently applied for the computation of the charge circulation in the structure. From the Mulliken charge densities and analysis, more negatively charged atoms act as an active focal point, which can be adsorbed through donor–acceptor type of reaction on the surface of metal. It is observed from Fig. 12(b) that the charge on central phosphorous atom 3.39 and negative charges in the region of the carbons atoms of the aromatic rings, methylene carbon, oxygen, and bromide are adsorption active centers. The EBTPPB ionic salt is adsorbed on the MS surface using these active sites, facilitating the corrosion mitigation action.71–73
The smallest the total energy value (−106![[thin space (1/6-em)]](https://www.rsc.org/images/entities/char_2009.gif) 439 kcal mol−1) is the ground state energy of the coordination. The binding energy of the inhibitor EBTPPB was found to be negative (−6096 kcal mol−1), which advocated that the inhibitor was stable and less prone to divide. There is a possibility of interaction of π-electrons of EBTPPB with the MS surface, thereby retarding the corrosion rate because EBTPPB is a polar molecule as indicated by it dipole moment value (7.63μ).45
439 kcal mol−1) is the ground state energy of the coordination. The binding energy of the inhibitor EBTPPB was found to be negative (−6096 kcal mol−1), which advocated that the inhibitor was stable and less prone to divide. There is a possibility of interaction of π-electrons of EBTPPB with the MS surface, thereby retarding the corrosion rate because EBTPPB is a polar molecule as indicated by it dipole moment value (7.63μ).45
4. Conclusions
The systematic study of corrosion inhibition of MS was carried out in 0.5 M H2SO4 using various concentrations of an ionic salt (4-ethoxybenzyl)-triphenylphosphonium bromide (EBTPPB) from 298 to 328 K temperatures. The outcomes of these studies can be concluded as follows:• Inhibition efficiency of green ionic salt enhances on enhancing the inhibitory concentration (10−5 to 10−2 M), and protection takes places with adsorption of the EBTPPB inhibitor on the MS surface. The adsorption of mitigator is confirmed by the Langmuir adsorption (LA) isotherm.
• The EIS results demonstrate that Rct values enhance with increasing the protector concentration, while the values of Cdl reduce with escalating the protector concentration.
• The best fit of the curves has been found from their corresponding equivalent circuits. The small value of χ2 indicates better fit curves.
• SEM with EDX investigation of the surface confirmed the presence of films and adsorption of EBTPPB inhibitor on the MS surface.
• AFM study revealed that the extent of roughness decreased when the concentrations of EBTPPB were increased from 10−5 M to 10−2 M.
• QC calculations were accomplished to sustain the adsorption mechanism with the molecular structure of EBTPPB.
Acknowledgements
The authors acknowledge the Hindu College, and the University of Delhi, India for providing infrastructure and lab facilities. Dr Sudershan Kumar also thanks the Department of Science and Technology, New Delhi (SERB) funding the research project (grant no. SB/EMEQ-217/2013). Prof I. Bahadur is thankful to NRF/DST and North-West University South Africa for funding.References
- Y. Ma, F. Han, Z. Li and C. Xia, ACS Sustainable Chem. Eng., 2016, 4, 633–639 CrossRef CAS.
- M. A. Hegazy, A. Y. El-etre, M. El-shafaie and K. M. Berry, J. Mol. Liq., 2016, 214, 347–356 CrossRef CAS.
- P. J. Ramakrishnan, V. Deth, K. Janardhanan, R. Sreekumar and K. P. Mohan, Int. J. Corros., 2014, 2014, 1–5 CrossRef.
- W. Furbeth and M. Schutze, Mater. Corros., 2009, 60, 481–494 CrossRef.
- Y. Duda, R. Govea-rueda, H. I. Beltra and L. S. Zamudio-rivera, J. Phys. Chem. B, 2005, 109, 22674–22684 CrossRef CAS PubMed.
- A. K. Dewan, D. P. Valenzuela and S. T. Dubey, Ind. Eng. Chem. Res., 2002, 41, 914–921 CrossRef CAS.
- H. Vashisht, I. Bahadur, S. Kumar, K. Bhrara, D. Ramjugernath and G. Singh, Int. J. Electrochem. Sci., 2014, 9, 2896–2911 Search PubMed.
- G. Boisier, A. Lamure, N. Pébère, N. Portail and M. Villatte, Surf. Coat. Technol., 2009, 203, 3420–3426 CrossRef CAS.
- S. S. Shivakumar and K. N. Mohana, Int. J. Corros., 2013, 2013, 1–13 CrossRef.
- C. Jeyaprabha, S. Sathiyanarayanan and G. Venkatachari, J. Electroanal. Chem., 2005, 583, 232–240 CrossRef CAS.
- H. M. A. El-lateef, A. M. Abu-dief and B. E. M. El-gendy, J. Electroanal. Chem., 2015, 758, 135–147 CrossRef.
- M. A. Migahed, A. M. Abdul-Raheim, A. M. Atta and W. Brostow, Mater. Chem. Phys., 2010, 121, 208–214 CrossRef CAS.
- J. Saranya, M. Sowmiya, P. Sounthari, K. Parameswari, S. Chitra and K. Senthilkumar, J. Mol. Liq., 2016, 216, 42–52 CrossRef CAS.
- A. A. Farag, A. S. Ismail and M. A. Migahed, J. Mol. Liq., 2015, 211, 915–923 CrossRef CAS.
- E. E. Ebenso, D. A. Isabirye and N. O. Eddy, Int. J. Mol. Sci., 2010, 11, 2473–2498 CrossRef CAS PubMed.
- R. E. Ramírez, L. C. Torres-González and E. M. Sánchez, J. Electrochem. Soc., 2007, 154, B229 CrossRef.
- D. Mercier and M. G. Barthés-Labrousse, Corros. Sci., 2009, 51, 339–348 CrossRef CAS.
- A. Popova, M. Christov and A. Zwetanova, Corros. Sci., 2007, 49, 2131–2143 CrossRef CAS.
- K. Bhrara and G. Singh, Appl. Surf. Sci., 2006, 253, 846–853 CrossRef CAS.
- F. Atefi, M. T. Garcia, R. D. Singer and P. J. Scammells, Green Chem., 2009, 11, 1595–1604 RSC.
- M. L. Wang, B. L. Liu and S. J. Lin, J. Chin. Inst. Chem. Eng., 2007, 38, 451–459 CrossRef CAS.
- C. Jangu and T. E. Long, Polymer, 2014, 55, 3298–3304 CrossRef CAS.
- A. Popova, M. Christov and A. Vasilev, Corros. Sci., 2015, 94, 70–78 CrossRef CAS.
- X. Zheng, S. Zhang, W. Li, M. Gong and L. Yin, Corros. Sci., 2015, 95, 168–179 CrossRef CAS.
- J. Saien, M. Kharazi and S. Asadabadi, J. Mol. Liq., 2015, 212, 58–62 CrossRef CAS.
- M. S. Morad, Corros. Sci., 2000, 42, 1307–1326 CrossRef CAS.
- W. Wehner and R. Grade, Canadian Patent No. CA2082994, 1993.
- S. Kobase, H. Takerchi and M. Sumita, Japanese Patent No. JP2000316701, 2000.
- K. Bhrara, H. Kim and G. Singh, Corros. Sci., 2008, 50, 2747–2754 CrossRef CAS.
- A. M. El-Shamy, K. Zakaria, M. A. Abbas and S. Zein El Abedin, J. Mol. Liq., 2015, 211, 363–369 CrossRef CAS.
- S. M. Taw, J. Mol. Liq., 2016, 216, 624–635 CrossRef.
- K. F. Khaled, Appl. Surf. Sci., 2004, 230, 307–318 CrossRef CAS.
- S. O. Niass, M. E. Touhami, N. Hajjaji, A. Srhiri and H. Takenouti, J. Appl. Electrochem., 2001, 31, 85–92 CrossRef CAS.
- F. Said, N. Souissi, A. Dermaj, N. Hajjaji, E. Triki and A. Srhiri, Mater. Corros., 2005, 56(9), 619–623 CrossRef CAS.
- S. M. A. Hosseini, M. Quanbari and M. Salari, Indian J. Chem. Technol., 2007, 14, 376–381 CAS.
- M. J. Bahrami, S. M. A. Hosseini and P. Pilvar, Corros. Sci., 2010, 52, 2793–2803 CrossRef CAS.
- H. Vashisht, I. Bahadur, S. Kumar, G. Singh, D. Ramjugernath and E. E. Ebenso, Int. J. Electrochem. Sci., 2014, 9, 5204–5221 CAS.
- E. S. Ferreira, C. Giacomelli and F. C. Giacomelli, Mater. Chem. Phys., 2004, 83, 129–134 CrossRef CAS.
- M. Yadav, S. Kumar and D. Sharma, Surf. Rev. Lett., 2013, 20, 1350057–1350075 CrossRef.
- A. K. Manohar, O. Bretschger, K. H. Nealson and F. Mansfeld, Bioelectrochemistry, 2008, 72, 149–154 CrossRef CAS PubMed.
- A. K. Satpati, M. M. Palrecha and R. I. Sundaresan, Indian J. Chem. Technol., 2008, 15, 163–167 CAS.
- M. Abdallah and B. A. A. L. Jahdaly, Int. J. Electrochem. Sci., 2015, 10, 2740–2754 CAS.
- J. R. Xavier, S. Nanjundan and N. Rajendran, Ind. Eng. Chem. Res., 2012, 51, 30–43 CrossRef CAS.
- S. Şafak, B. Duran, A. Yurt and G. Türkoĝlu, Corros. Sci., 2012, 54, 251–259 CrossRef.
- H. Vashisht, S. Kumar, I. Bahadur and G. Singh, Int. J. Electrochem. Sci., 2014, 9, 684–699 Search PubMed.
- M. A. Amin, S. S. Abd El-Rehim and M. N. Abbas, Arabian J. Chem., 2011, 4, 135–145 CrossRef CAS.
- M. Walia and G. Singh, Surf. Eng., 2005, 21, 176–179 CrossRef CAS.
- J. Alam, U. Riaz and S. Ahmad, Curr. Appl. Phys., 2009, 9, 80–86 CrossRef.
- A. L. Chong, J. I. Mardel, D. R. MacFarlane, M. Forsyth and A. E. Somers, ACS Sustainable Chem. Eng., 2016, 4, 1746–1755 CrossRef CAS.
- D. Prabhu, Int. J. ChemTech Res., 2013, 5, 2690–2705 CAS.
- M. Yadav, S. Kumar, R. R. Sinha, I. Bahadur and E. E. Ebenso, J. Mol. Liq., 2015, 211, 135–145 CrossRef CAS.
- A. P. Hanza, R. Naderi, E. Kowsari and M. Sayebani, Eval. Program Plann., 2016, 107, 96–106 Search PubMed.
- P. Mourya, P. Singh, R. B. Rastogi and M. M. Singh, Appl. Surf. Sci., 2016, 380, 1–10 CrossRef.
- A. Dada, A. Olalekan, A. Olatunya and O. Dada, IOSR J. Appl. Chem., 2012, 3, 38–45 CrossRef.
- E. A. Flores, O. Olivares, N. V. Likhanova, M. A. Domínguez-Aguilar, N. Nava and D. Guzman-Lucero, Corros. Sci., 2011, 53, 3899–3913 CrossRef CAS.
- S. E. Nataraja, T. V. Venkatesha and H. C. Tandon, Corros. Sci., 2012, 60, 214–223 CrossRef CAS.
- S. E. Nataraja, T. V. Venkatesha, H. C. Tandon and B. S. Shylesha, Corros. Sci., 2011, 53, 4109–4117 CrossRef CAS.
- S. Kumar, D. Sharma, P. Yadav and M. Yadav, Ind. Eng. Chem. Res., 2013, 52, 14019–14029 CrossRef CAS.
- K. Bhrara and G. Singh, Corros. Eng., Sci. Technol., 2007, 42, 137–144 CrossRef CAS.
- N. Zulfareen, K. Kannan, T. Venugopal and S. Gnanavel, Arabian J. Chem., 2016, 9, 121–135 CrossRef CAS.
- J. Vosta and J. Eliasek, Corros. Sci., 1971, 11, 223–229 CrossRef CAS.
- G. Gece, Corros. Sci., 2008, 50, 2981–2992 CrossRef CAS.
- N. Khalil, Electrochim. Acta, 2003, 48, 2635–2640 CrossRef CAS.
- M. A. Bedair, J. Mol. Liq., 2016, 219, 128–141 CrossRef CAS.
- T. Arslan, F. Kandemirli, E. E. Ebenso, I. Love and H. Alemu, Corros. Sci., 2009, 51, 35–47 CrossRef CAS.
- I. B. Obot, N. O. Obi-Egbedi and S. A. Umoren, Corros. Sci., 2009, 51, 276–282 CrossRef CAS.
- M. Yadav, D. Behera, S. Kumar and R. R. Sinha, Ind. Eng. Chem. Res., 2013, 52, 6318–6328 CrossRef CAS.
- M. Yadav, D. Behera, S. Kumar and P. Yadav, Chem. Eng. Commun., 2015, 202, 303–315 CrossRef CAS.
- M. Yadav, T. K. Sarkar and T. Purkait, J. Mol. Liq., 2015, 212, 731–738 CrossRef CAS.
- M. K. Awad, M. R. Mustafa and M. M. A. Elnga, J. Mol. Struct.: THEOCHEM, 2010, 959, 66–74 CrossRef CAS.
- M. Özcan, I. Dehri and M. Erbil, Appl. Surf. Sci., 2004, 236, 155–164 CrossRef.
- H. Ju, Z. Kai and Y. Li, Corros. Sci., 2008, 50, 865–871 CrossRef CAS.
- G. Gece and S. Bilgic, Corros. Sci., 2009, 51, 1876–1878 CrossRef CAS.
| This journal is © The Royal Society of Chemistry 2017 |

