 Open Access Article
Achieving a low electrical percolation threshold and superior mechanical performance in poly(L-lactide)/thermoplastic polyurethane/carbon nanotubes composites via tailoring phase morphology with the aid of stereocomplex crystallites†
Zhenwei Liu,
Hongwei Bai*,
Yuanlin Luo,
Qin Zhang and
Qiang Fu *
*
College of Polymer Science and Engineering, State Key Laboratory of Polymer Materials Engineering, Sichuan University, Chengdu 610065, China. E-mail: bhw_168@163.com; hongweibai@scu.edu.cn; qiangfu@scu.edu.cn; Fax: +86 28 8546 1795; Tel: +86 28 8546 1795
First published on 13th February 2017
Abstract
Selective localization of conductive nanofillers in one phase of co-continuous polymer blends provides an efficient method to greatly reduce the electrical percolation threshold of conductive polymer composites. However, it is still a big challenge to achieve very low percolation thresholds because the critical content for the complete continuity of the selectively filled phase is generally high. In this contribution, taking poly(L-lactide)/thermoplastic polyurethane/carbon nanotubes (PLLA/TPU/CNTs) composite as an example, we demonstrate a facile and versatile strategy for the fabrication of highly conductive PLLA-based composites with very low percolation threshold as well as excellent stiffness–toughness balance via constructing stereocomplex (SC) crystallites in PLLA melt to effectively tailor the phase transition behavior of the blend matrices. To do this, small amounts of poly(D-lactide) (PDLA) capable of co-crystallizing with the PLLA chains to form SC crystallites were incorporated into the composites by melt mixing at 190 °C. These SC crystallites can serve as physical cross-linking points to significantly increase PLLA melt-viscosity and subsequently induce the formation of co-continuous structure in the PLLA/TPU blend matrix at a much lower content of the CNTs-filled TPU phase. As a result, the obtained composites not only show a dramatically reduced percolation threshold (0.3 wt%) but also exhibit a balanced impact toughness and mechanical strength. Importantly, the strategy to promote the complete continuity of the CNTs-filled phase in blend matrix is low-cost and scalable, opening up a new avenue for the design and engineering of highly conductive PLLA-based composites.
1. Introduction
Over the last two decades, conductive polymer composites (CPCs) consisting of insulating polymer matrices and conducting nanofillers have aroused enormous interest from both academia and industry because they are highly desirable in various high-value applications such as electronic sensors,1–3 actuators,4,5 and electromagnetic interference shielding materials.6–8 Among these emerging nanofillers, carbon nanotubes (CNTs) with outstanding electrical conductivity and large aspect ratio (typically ca. 300–1000) exhibit natural advantages to remarkably improve the electrical conductivity of host polymers with a low loading.9,10 Nevertheless, high CNTs loading is generally required to construct a well-developed or percolated conductive network in most polymer matrices due to the strong agglomeration tendency of CNTs in these matrices, and a high volume fraction of CNTs inevitably causes high cost, processing difficulty, and even deteriorated mechanical properties.9–11 Therefore, lowering the electrical percolation threshold of nanofillers as much as possible is extremely crucial for the development of CNTs filled CPCs with low cost and good melt-processability.Up to now, a great deal of efforts has been devoted to lower the percolation threshold of CPCs.2 The percolation threshold is dependent not only on the intrinsic properties of nanofillers (e.g., aspect ratio) and their dispersion level but also highly on their distribution state in polymer matrices.2,12–18 For example, the lowered percolation threshold can be obtained by manipulating matrix crystallization of single-polymer CPCs (e.g., polylactide/CNTs composites) because the volume exclusion effect provided by the crystallization can impel conductive nanofillers to transfer from crystalline regions into amorphous regions and the selective localization of the nanofillers enables the formation of percolated conductive pathways in the polymer matrix with a lower loading.14,15,18 Compared with the single-polymer CPCs, the incorporation of conductive nanofillers into immiscible multiphase polymer blends provides a much better opportunity for the development of CPCs with substantially lower percolation thresholds by melt processing.2,19–25 Among various combinations of nanofiller localizations and blend phase morphologies, the double percolated structures formed by the selective localization of nanofillers in only one phase or at the interface of co-continuous polymer blends have been frequently employed to design various CPCs with low and even ultralow electrical percolation thresholds in recent years.19–26 For instance, the electrical percolation threshold of CNTs in co-continuous polycarbonate/poly(styrene-acrylonitrile) (PC/SAN) blends is lower than 1 wt%, much lower than their percolation thresholds in neat SAN matrix (2.0 wt%) and in neat PC matrix (1.5 wt%).20 Very recently, such structures have also been utilized to improve the thermal conductivity of CPCs.22,27 Specially, the selective localization of nanofillers at the blend interface is proposed to be the ideal scenario to reach high conductivity with the lowest percolation threshold.24,25 Unfortunately, although the selective localization of nanofillers in polymer blends could be readily controlled by adjusting thermodynamic and kinetic parameters (e.g., interfacial tension and mixing procedures) during melt processing,20,28–30 it still remains a big challenge to achieve stable interface-localization of high-aspect-ratio CNTs owing to their fast transfer mechanism from a thermodynamically less favorable phase into a more favorable one and their poor stability at the blend interface.29,30 The transfer speed as well as the stability of various solid nanofillers at the blend interface are strongly dependent on their aspect ratio.30 The larger the aspect ratio, the faster the transfer and the poorer the interfacial stability are. Thus, the stable interface-localization has been reported to form only in low-aspect-ratio nanoparticles (e.g., carbon black (CB)31,32 and titanium dioxide (TiO2)33) filled polymer blends. Whereas for CNTs, only the kinetically trapped interface-localization states can be obtained in melt-processed polymer blends by adjusting the interplay between thermodynamic driving forces and kinetic factors.28–30,34,35
In fact, besides the selective localization of nanofillers within one phase of co-continuous polymer blends, the critical content of the selectively filled phase required for its complete continuity also plays a key role in lowing the percolation threshold of CPCs.36–40 If the critical content is low enough, the same ultralow electrical percolation threshold as the case of the selective interface-localization could be achieved. Nevertheless, the composition range for the formation of co-continuous structure in most polymer blends is usually very narrow, and only when the blend composition ratio approximates 50![[thin space (1/6-em)]](https://www.rsc.org/images/entities/char_2009.gif) :
:![[thin space (1/6-em)]](https://www.rsc.org/images/entities/char_2009.gif) 50 (v/v) can the co-continuous structure form.21,36–38,41 Thus, broadening the composition range for the co-continuity of polymer blends is believed to be a promising alternative strategy for fabricating highly conductive CPCs with an extremely low CNTs loading.2 Despite it might be of great importance for developing low-cost and easy-processable CPCs, the attention paid to this strategy is scarce until now. Recently, adding conductive nanofillers (e.g., CB) with a strong self-networking capability has been proved to be an efficient way to substantially reduce the critical content for maintaining the co-continuous structure of polymer blends because these nanofillers not only tend to self-organize into 3-D continuous network structure in blend melts but also drive the discrete droplets of the nanofiller-rich phase fuse together into continuous structure at low loadings, thus giving rise to a dramatically decreased electrical percolation threshold.36–40 For example, with the incorporation of 4 wt% CB into polystyrene/polyethylene (PS/PE) blends, the critical PE content required for forming a co-continuous structure drops notably from 40 wt% to 10 wt%.36 However, for the CNTs, the absence of such a strong self-networking capability makes it hard to remarkably reduce the critical content for the complete continuity of the CNTs-filled phase. Therefore, it is essential to develop a simple and versatile route towards highly conductive CPCs with a low CNTs loading.
50 (v/v) can the co-continuous structure form.21,36–38,41 Thus, broadening the composition range for the co-continuity of polymer blends is believed to be a promising alternative strategy for fabricating highly conductive CPCs with an extremely low CNTs loading.2 Despite it might be of great importance for developing low-cost and easy-processable CPCs, the attention paid to this strategy is scarce until now. Recently, adding conductive nanofillers (e.g., CB) with a strong self-networking capability has been proved to be an efficient way to substantially reduce the critical content for maintaining the co-continuous structure of polymer blends because these nanofillers not only tend to self-organize into 3-D continuous network structure in blend melts but also drive the discrete droplets of the nanofiller-rich phase fuse together into continuous structure at low loadings, thus giving rise to a dramatically decreased electrical percolation threshold.36–40 For example, with the incorporation of 4 wt% CB into polystyrene/polyethylene (PS/PE) blends, the critical PE content required for forming a co-continuous structure drops notably from 40 wt% to 10 wt%.36 However, for the CNTs, the absence of such a strong self-networking capability makes it hard to remarkably reduce the critical content for the complete continuity of the CNTs-filled phase. Therefore, it is essential to develop a simple and versatile route towards highly conductive CPCs with a low CNTs loading.
It is well accepted that the phase morphology of dual-phase polymer blends is mainly determined by the composition and melt-viscosity ratio between the two phases.41–43 Generally, substantially increasing the viscosity of the major phase could promote the continuity of the minor phase at a much lower volume fraction and thus causing a broadened composition range for the formation of co-continuous structure in the blends.41–43 Unfortunately, although several approaches including chemically cross-linking can be used to enhance melt-viscosity of polymers, it is still a challenging task to substantially adjust the viscosity ratio of polymer blends without sacrificing their melt-processability and mechanical properties. Very interestingly, stereocomplex (SC) crystallites formed by co-crystallization of enantiomeric poly(L-lactide) (PLLA) and poly(D-lactide) (PDLA) have been reported to be used as efficient rheology modifier to significantly enhancing the melt-viscosity of PLLA and other polymers because these SC particles possessing higher melting temperature can self-organize into three dimension network structures to reinforce the melts.44–50 Moreover, super-toughened and heat-resistant PLLA/elastomer blends can be prepared by using small amounts of SC crystallites as a highly efficient nucleating agent to significantly accelerate PLLA matrix crystallization.51 Very recently, we further confirm that the construction of SC crystallites in the PLLA/elastomer blends is an elegant strategy for the morphological transition of the minor elastomer phase from the common well-dispersed droplets to the unique continuous structure.52 Encouraged by this inspiring result, it is natural to think what would happen when CNTs are selectively localized in the elastomer phase of these blends. Can SC crystallites promote the complete continuity of the CNTs-filled elastomer phase (where the presence of CNTs conductive networks would remarkably increase the melt-viscosity of the elastomer phase9,53) as that of the blank elastomer phase and finally dramatically enhance the electrical conductivity of the obtained PLLA/elastomer/CNTs composites?
In this work, taking immiscible PLLA/thermoplastic polyurethane (TPU) blends as host matrices, we aim to demonstrate the applicability of such a facile strategy to substantially reduce the percolation threshold of CNTs. To do this, small amounts of PDLA was incorporated into the PLLA/TPU/CNTs composites through directly melt mixing at 190 °C, which is an optimum melt-processing temperature for the SC crystallization between PDLA and PLLA chains.54,55 The PLLA/TPU blends have a great application potential in many fields due to their good property complementarity.52,56,57 The glassy PLLA phase with impressive sustainability shows inherent brittleness, while the rubbery TPU phase with outstanding toughness exhibits much lower tensile strength and stiffness. One can readily control or even design the toughness and mechanical strength of the blends by tailoring their composition and phase morphology.52 By constructing SC crystallites in PLLA melt to significantly enhance its viscosity and subsequently remarkably reduce the critical content for the complete continuity of CNTs-filled TPU phase, a new type of highly conductive PLLA/TPU/CNTs composites with a very low percolation threshold and an excellent stiffness–toughness balance has been prepared for the first time. More importantly, the strategy presented here is not only easy to implement through simple melt processing but also could be extended to other conductive composites based on different PLLA blend matrices, suggesting a general universality of our current work.
2. Experimental
2.1 Materials
PLLA with a weight-averaged molecular weight (Mw) of 1.7 × 10⁵ g mol−1 and a polydispersity index (PDI) of 1.7 was purchased from Natureworks LLC, USA. PDLA with an Mw of 1.2 × 10⁵ g mol−1 and a PDI of 1.7 was supplied by Zhenjiang Hisun Biomaterial Co. Ltd., China. Polyester-based TPU with a poly(1,4-butylene adipate) block (ca. 69 wt%) as the soft segment and a 1,4-butylene glycol extended 4,4′-diphenyl-methane-diisocyanate (ca. 31 wt%) block as the hard segment was provided by Yantai Wanhua Polyurethanes Co. Ltd., China. It has an Mw of 1.3 × 10⁵ g mol−1 and a glass transition temperature of ca. −40 °C. Multi-walled CNTs with an average diameter of 10 nm, an average length of 1.5 μm, and a specific area of 250–300 m2 g−1 was obtained from Nanocyl S.A., Belgium.2.2 Sample preparation
PLLA/TPU/CNTs composites containing various amounts of PDLA (5–25 wt%, based on the actual weight of both PLLA and PDLA resins) were prepared by melt mixing using a HAAKE Rheomix 600 internal mixer (Germany) at 190 °C and 60 rpm for 5 min. To achieve good dispersion as well as selective localization of CNTs in TPU phase, the CNTs were pre-dispersed in TPU (TPU/CNTs mixture) and then directly melt-mixed with PLLA and PDLA. Because the electrical percolation threshold of CNTs in the TPU/CNTs mixture is measured to be 1.5 wt% (the detailed results are not shown here), the weight ratio of TPU/CNTs was fixed at 98.5/1.5 in all composites. The obtained composites were named as PLLA/xTPU–1.5CNTs/yPDLA, where x and y represent the content of TPU–1.5CNTs and PDLA, respectively. For comparison, PLLA/TPU/CNTs composites without PDLA were also prepared by applying the same processing conditions. After melt mixing, the sheet specimens with a thickness of about 1.2 mm for rheological and electrical conductivity measurements were fabricated by compression molding at 190 °C and 10 MPa. The standard rectangular and dog-bone shaped specimens for mechanical testing were fabricated by injection molding using a Thermo Scientific HAAKE MiniJet II (Germany) at 200 °C.Prior to the melt processing, all materials were vacuum-dried at 50 °C for at least 12 h.
2.3 Characterizations and measurements
 | (1) |
3. Results and discussion
3.1 SC crystallites induced phase transition
PLLA/TPU/CNTs composites with various amounts of PDLA was prepared by melt mixing at a favorable temperature of 190 °C for the in situ SC crystallization between the PDLA and PLLA chains. To confirm the rapid formation of SC crystallites during the melt-mixing process, DSC analysis was performed on the melt-quenched composites after mixing for 2 min and the results are shown in Fig. 1. Clearly, four typical transitions including the glass transition (Tg), cold crystallization (Tcc), melting of PLLA homochiral (HC) crystallites (Tm,HC), and melting of SC crystallites (Tm,SC) can be observed during the heating runs. With the incorporation of 5 wt% PDLA into the PLLA/TPU/CNTs composites, a weak characteristic melting peak of SC crystallites is noticed at around 215 °C, which provides a direct evidence for the rapid formation of SC crystallites because the content of the SC crystallites formed in the cold crystallization process has been proved to be very low.45 Moreover, this peak not only becomes stronger but also shifts to a higher temperature of 225 °C with increasing PDLA concentration up to 25 wt%, indicating a significantly increased content of SC crystallites (the Xc,SC is enhanced from 3.0% to 20.1%) with more perfect lamellae as that usually observed in the asymmetric PLLA/PDLA blends.45 The apparent decrease in the cold crystallization peak temperature with increasing PDLA concentration should be ascribed to the nucleating effect of SC crystallites on PLLA homo-crystallization, but the confining effect of SC crystallite network on homo-crystallization could gives rise to a greatly decreased content of HC crystallites.44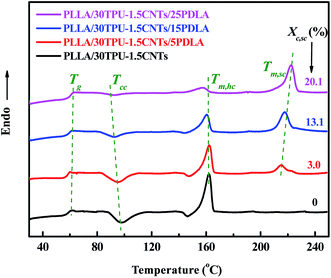 | ||
| Fig. 1 DSC melting curves of PLLA/30TPU–1.5CNTs composites with various amounts of PDLA. The crystallinity of SC crystallites (Xc,SC) is inset into the profile. | ||
Because the SC crystallites formed in the PLLA melt of PLLA/TPU/CNTs composites could act as efficient rheology modifier to remarkably increase the melt-viscosity of PLLA phase without evidently affecting that of TPU phase, the dynamic rheological analysis was performed on the neat TPU, TPU–1.5CNTs mixture, and PLLA/PDLA blends to reveal the effect of the formed SC crystallites on the viscosity ratio between PLLA and CNTs-filled TPU phases. Fig. 2 presents the complex viscosity (η*) of these samples as a function of frequency. As expected, the incorporation of PDLA induces a remarkably increased melt-viscosity of PLLA due to the formation of SC crystallite network in the PLLA melt.44,45 Moreover, neat PLLA exhibits a frequency independent flow (i.e., Newtonian) behavior at low frequencies, whereas a strong shear-thinning behavior is observed in the PLLA/PDLA blends and all the blends retain good melt-processability even at a high PDLA concentration of 25 wt%. At the low frequency zone, neat TPU also shows the typical Newtonian plateau as that of neat PLLA, while TPU/1.5CNTs composite displays the same shear thinning behavior as that of the PLLA/PDLA blends due to the flow-impeding effect by the presence of percolated CNTs network structure.58,59 Similar result has been widely reported on many other composite systems containing CNTs, such as poly(vinylidene fluoride) (PVDF)/CNTs58 and polypropylene (PP)/CNTs59 composites. More interestingly, although the presence of CNTs can significantly increase the melt-viscosity of TPU at the low frequency zone, the viscosity of TPU–1.5CNTs mixture is only slightly higher than that of neat TPU in the higher shear rate range of common melt-processing. The average shear rate during our melt-mixing in internal mixer at 60 rpm is estimated to be 49.1 Hz according to the model proposed by Bousmina et al.60 Under this processing condition, the viscosity ratio between the PLLA and TPU–1.5CNTs phases is increased sharply from 1.5 to 57.8 with increasing PDLA concentration from 0 to 25 wt%, which makes it possible to effectively control the phase transition behavior of the PLLA/TPU–1.5CNTs composites via tailoring viscosity ratio with the aid of SC crystallites. In other words, the SC crystallites induced sharp increase in the viscosity ratio could promote the continuity of the TPU–1.5CNTs phase at a much lower TPU content.
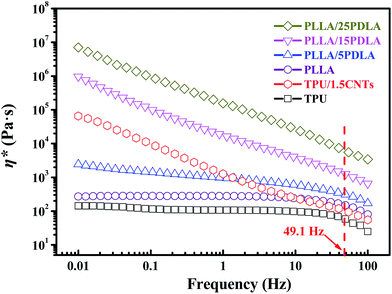 | ||
| Fig. 2 Frequency dependence of complex viscosity (η*) of neat TPU, TPU–1.5CNTs mixture, and PLLA with various amounts of PDLA. The average shear rate during our melt-mixing is about 49.1 Hz. | ||
The morphological structures of PLLA/TPU–1.5CNTs/PDLA composites were observed using SEM. Fig. 3 shows some representative SEM images of the PLLA/30TPU–1.5CNTs composites with various amounts of PDLA. The red dots in the SEM images represent the TPU phase where the CNTs are selectively localized, as identified by the SEM image of TPU–1.5CNTs composite presented in Fig. S1.† No obvious transfer of the CNTs occurs from TPU to PLLA phase during the melt-mixing process. From Fig. 3a, one can observe a typical sea-island structure in the PLLA/30TPU–1.5CNTs composite, where the spherical TPU–1.5CNTs droplets are dispersed in the continuous PLLA phase. Once small amounts (5 wt%) of PDLA are incorporated into the composite, however, these TPU–1.5CNTs droplets tend to aggregate together into clusters with irregular shapes (as highlighted by the red circles in Fig. 3b). Further increasing the PDLA concentration up to 15–25 wt%, an expected co-continuous structure is developed (Fig. 3c and d), demonstrating that the formation of sufficient SC crystallites in PLLA melt can induce the phase transition of the PLLA/TPU blend matrix from the sea-island structure into the co-continuous structure. Very importantly, it is interesting to find that the critical TPU content for the formation of co-continuous structure in the blend matrix is significantly decreased from 50 wt% for PLLA/TPU–1.5CNTs composites (Fig. 4a and c) to 25 wt% for PLLA/TPU–1.5CNTs/15PDLA composites (Fig. 4b and d). In this case, a greatly reduced electrical percolation threshold is expected to achieve in the PLLA/TPU–1.5CNTs/PDLA composites due to the selective localization of percolated CNTs network in the continuous TPU phase. Furthermore, it is worthy to note that the co-continuous structure of the PLLA/50TPU–1.5CNTs composite becomes finer with the incorporation of 15 wt% PDLA (Fig. 4c and d).
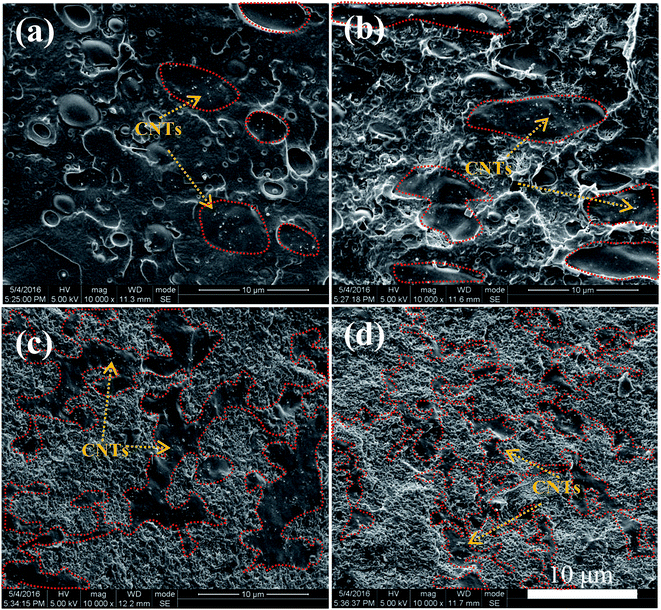 | ||
| Fig. 3 SEM images showing the morphological structures of PLLA/30TPU–1.5CNTs composites with various amounts of PDLA: (a) 0 wt%, (b) 5 wt%, (c) 15 wt%, and (d) 25 wt%. | ||
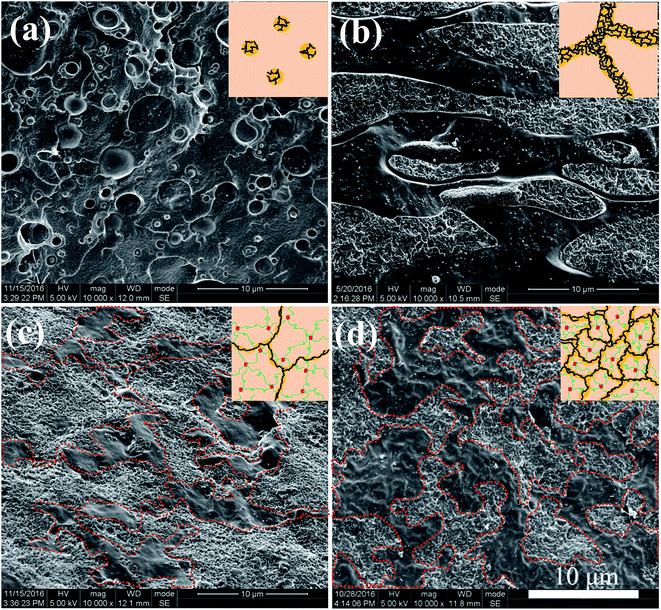 | ||
| Fig. 4 SEM images showing the morphological structures of different composites: (a) PLLA/25TPU–1.5CNTs, (b) PLLA/25TPU–1.5CNTs/15PDLA, (c) PLLA/50TPU–1.5CNTs, and (d) PLLA/50TPU–1.5CNTs/15PDLA. | ||
3.2 Electrical conductivity
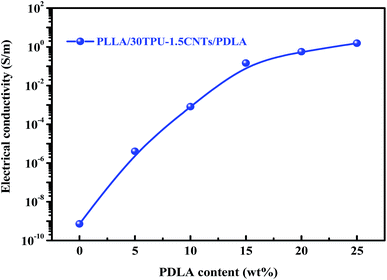
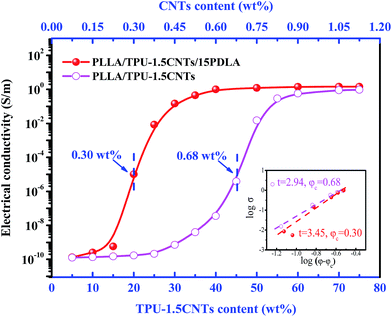
The electrical properties of PLLA/TPU/CNTs composites with various amounts of PDLA are measured and some representative results are shown in Fig. 5 and 6. In all composites, the weight ratio of TPU/CNTs is fixed at 98.5/1.5 to ensure the high electrical conductivity of the CNTs-filled TPU (TPU–1.5CNTs) phase. Expectedly, the electrical conductivity of these composites is dominated by the SC crystallites tailored phase structure of the PLLA/TPU blend matrix. For PLLA/30TPU–1.5CNTs/PDLA composites, the conductivity exhibits a sharp rise of about 7 orders of magnitude as the PDLA concentration increases from 0 to 15 wt% (Fig. 5), clearly indicating that the percolated conductive network of CNTs is formed due to the significantly enhanced continuity of the TPU–1.5CNTs phase. This is in good agreement with the SEM observations of the corresponding phase structure (Fig. 3). However, no notable increase can be achieved with further increasing PDLA concentration up to 25 wt%. Most importantly, the PLLA/TPU–1.5CNTs/15PDLA composites possess much higher electrical conductivity as compared with the PLLA/TPU–1.5CNTs composites at all TPU–1.5CNTs concentrations (Fig. 6). In order to evaluate the percolation threshold (φc), the relationship between the measured electrical conductivity (σ) and the CNTs content (φ) above φc was fitted with using the classical percolation scaling law:| σ = σ0(φ − φc)t | (2) |
3.3 Mechanical properties
Considering that both the good mechanical strength and the fracture toughness are often required to avoid fracture of highly conductive CPCs in various application environments, the tensile properties and impact toughness of the PLLA/TPU–1.5CNTs and PLLA/TPU–1.5CNTs/15PDLA composites were measured via uniaxial tensile and notched Izod impact testing. The results of some representative composites are presented in Fig. 7. One can clearly see that, at the same electrical conductivity level, the PLLA/TPU–1.5CNTs/15PDLA composites exhibit superior Young's modulus and tensile strength over those of the PLLA/TPU–1.5CNTs composites because of the greatly reduced rubbery TPU content with the incorporation of 15 wt% PDLA (Fig. 7a). Meanwhile, the inferior impact toughness is also observed in the composites (Fig. 7b) but it is still comparable to that of many super-tough PLLA blends, such as PLLA/poly[(butylene succinate)-co-adipate] (PBSA)61 and PLLA/polycarbonate (PC)62 blends. Specially, the notched Izod impact strength of the PLLA/30TPU–1.5CNTs/15PDLA composite with a high electrical conductivity is as high as 69.1 kJ m−2. Hence, the highly conductive PLLA/TPU/CNTs composites with balanced mechanical properties have been prepared that are both strong and tough.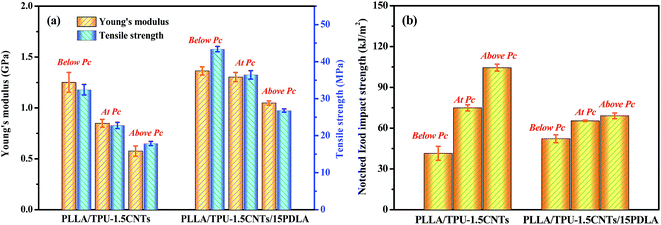 | ||
| Fig. 7 Mechanical properties of PLLA/TPU–1.5CNTs and PLLA/TPU–1.5CNTs/15PDLA composites below, at, and above corresponding electrical percolation threshold (Pc). | ||
4. Conclusions
In summary, we have demonstrated a facile and elegant strategy for the fabrication of highly conductive PLLA/TPU/CNTs composites with very low electrical percolation threshold and balanced mechanical properties via tailoring phase transition behavior of the PLLA/TPU blend matrix with the aid of SC crystallites. The SC crystallites can be rapidly formed in PLLA melt during melt-mixing of the composite components with small amounts of PDLA and then act as physical cross-linking points to dramatically increase PLLA melt-viscosity without affecting the viscosity of the CNTs-filled TPU phase, finally leading to a shift of the critical composition for forming co-continuous phase structure to a much lower TPU content (from 45 wt% to 20 wt%). Compared with the conventional PLLA/TPU/CNTs ternary composites, not only a dramatically reduced electrical percolation threshold (from 0.68 wt% to 0.30 wt%) but also a superior stiffness–toughness balance are obtained in the novel PLLA/TPU/CNTs/PDLA composites due to the decreased critical content for the continuity of the rubbery TPU phase. Moreover, the construction of SC crystallites via industrially meaningful melt mixing is a versatile technique for preparing CPCs with different PLLA blend matrices, such as PLLA/poly(ε-caprolactone) (PCL) and PLLA/poly(butylene succinate) (PBS) matrices. We believe that such a simple and effective technique could offer a new pathway for the large-scale production of various PLLA-based CPCs for practical applications.Acknowledgements
This work was financially supported by National Natural Science Foundation of China (No. 21404075 and 51421061), Science Foundation for The Excellent Youth Scholars of Sichuan University (No. 2015SCU04A28), Scientific Research Foundation for Young Teachers of Sichuan University (No. 2015SCU11007), and the Project of State Key Laboratory of Polymer Materials Engineering (No. sklpme2015-3-01).References
- J. H. Zhao, K. Dai, C. G. Liu, G. Q. Zheng, B. Wang, C. T. Liu, J. B. Chen and C. Y. Shen, Composites, Part A, 2013, 48, 129–136 CrossRef CAS.
- H. Deng, L. Lin, M. Z. Ji, S. M. Zhang, M. B. Yang and Q. Fu, Prog. Polym. Sci., 2014, 39, 627–655 CrossRef CAS.
- H. Liu, Y. L. Li, K. Dai, G. Q. Zheng, C. T. Liu, C. Y. Shen, X. R. Yan, J. Guo and Z. H. Guo, J. Mater. Chem. C, 2016, 4, 157–166 RSC.
- Y. Hu, W. Chen, L. H. Lu, J. H. Liu and C. R. Chang, ACS Nano, 2010, 4, 3498–3502 CrossRef CAS PubMed.
- S. K. Yadav, I. J. Kim, H. J. Kim, J. Kim, S. M. Hong and C. M. Koo, J. Mater. Chem. C, 2013, 1, 5463–5470 RSC.
- J. M. Thomassin, X. Lou, C. Pagnoulle, A. Saib, L. Bednarz, I. Huynen, R. Jerome and C. Detrembleur, J. Phys. Chem. C, 2007, 111, 11186–11192 CAS.
- S. Biswas, G. P. Kar and S. Bose, ACS Appl. Mater. Interfaces, 2015, 7, 25448–25463 CAS.
- L. C. Jia, D. X. Yan, C. H. Cui, X. Jiang, X. Ji and Z. M. Li, J. Mater. Chem. C, 2015, 3, 9369–9378 RSC.
- M. Moniruzzaman and K. I. Winey, Macromolecules, 2006, 39, 5194–5205 CrossRef CAS.
- Z. Spitalsky, D. Tasis, K. Papagelis and C. Galiotis, Prog. Polym. Sci., 2010, 35, 357–401 CrossRef CAS.
- A. I. Isayev, R. Kumar and T. M. Lewis, Polymer, 2009, 50, 250–260 CrossRef CAS.
- P. Potschke, S. Pegel, M. Claes and D. Bonduel, Macromol. Rapid Commun., 2008, 29, 244–251 CrossRef.
- A. A. Vasileiou, M. Kontopoulou, H. Gui and A. Docoslis, ACS Appl. Mater. Interfaces, 2015, 7, 1624–1631 CAS.
- H. Quan, S. J. Zhang, J. L. Qiao and L. Y. Zhang, Polymer, 2012, 53, 4547–4552 CrossRef CAS.
- C. M. Huang, H. W. Bai, H. Xiu, Q. Zhang and Q. Fu, Compos. Sci. Technol., 2014, 102, 20–27 CrossRef CAS.
- Y. Lin, S. Q. Liu and L. Liu, J. Mater. Chem. C, 2016, 4, 2353–2358 RSC.
- C. Wu, X. Y. Huang, G. L. Wang, L. B. Lv, G. Chen, G. Y. Li and P. K. Jiang, Adv. Funct. Mater., 2013, 23, 506–513 CrossRef CAS.
- H. Tsuji, Y. Kawashima, H. Takikawa and S. Tanaka, Polymer, 2007, 48, 4213–4225 CrossRef CAS.
- F. Gubbels, R. Jerome, P. Teyssie, E. Vanlathem, R. Deltour, A. Calderone, V. Parente and J. L. Bredas, Macromolecules, 1994, 27, 1972–1974 CrossRef CAS.
- A. Goldel, G. Kasaliwal and P. Potschke, Macromol. Rapid Commun., 2009, 30, 423–429 CrossRef PubMed.
- C. Mao, Y. T. Zhu and W. Jiang, ACS Appl. Mater. Interfaces, 2012, 4, 5281–5286 CAS.
- J. P. Cao, J. Zhao, X. D. Zhao, F. You, H. Z. Yu, G. H. Hu and Z. M. Dang, Compos. Sci. Technol., 2013, 89, 142–148 CrossRef CAS.
- Y. Lan, H. Liu, X. H. Cao, S. G. Zhao, K. Dai, X. R. Yan, G. Q. Zheng, C. T. Liu, C. Y. Shen and Z. H. Guo, Polymer, 2016, 97, 11–19 CrossRef CAS.
- J. Chen, Y. Y. Shi, J. H. Yang, N. Zhang, T. Huang, C. Chen, Y. Wang and Z. W. Zhou, J. Mater. Chem., 2012, 22, 22398–22404 RSC.
- J. Chen, Y. Shen, J. H. Yang, N. Zhang, T. Huang, Y. Wang and Z. W. Zhou, J. Mater. Chem. C, 2013, 1, 7808–7811 RSC.
- N. K. Shrivastava, S. Suin, S. Maiti and B. B. Khatua, RSC Adv., 2014, 4, 24584–24593 RSC.
- J. P. Cao, X. Zhao, J. Zhao, J. W. Zha, G. H. Hu and Z. M. Dang, ACS Appl. Mater. Interfaces, 2013, 5, 6915–6924 CAS.
- A. Goldel, G. R. Kasaliwal, P. Potschke and G. Heinrich, Polymer, 2012, 53, 411–421 CrossRef.
- F. Fenouillot, P. Cassagnau and J. C. Majeste, Polymer, 2009, 50, 1333–1350 CrossRef CAS.
- A. Goldel, A. Marmur, G. R. Kasaliwal, P. Potschke and G. Heinrich, Macromolecules, 2011, 44, 6094–6102 CrossRef CAS.
- K. Cheah, M. Forsyth and G. P. Simon, J. Polym. Sci., Part B: Polym. Phys., 2000, 38, 3106–3119 CrossRef CAS.
- A. E. Zaikin, R. R. Karimov and V. P. Arkhireev, Colloid J., 2001, 63, 53–59 CrossRef CAS.
- H. Xiu, H. W. Bai, C. M. Huang, C. L. Xu, X. Y. Li and Q. Fu, eXPRESS Polym. Lett., 2013, 7, 261–271 CrossRef CAS.
- L. Liu, Y. Wang, Y. L. Li, J. Wu, Z. W. Zhou and C. X. Jiang, Polymer, 2009, 50, 3072–3078 CrossRef CAS.
- Y. Y. Shi, Y. L. Li, F. M. Xiang, T. Huang, C. Chen, Y. Peng and Y. Wang, Polym. Adv. Technol., 2012, 23, 783–790 CrossRef CAS.
- F. Gubbels, S. Blacher, E. Vanlathem, R. Jerome, R. Deltour, F. Brouers and P. Teyssie, Macromolecules, 1995, 28, 1559–1566 CrossRef CAS.
- M. H. Al-Saleh and U. Sundararaj, Composites, Part A, 2008, 39, 284–293 CrossRef.
- Y. M. Pan, X. H. Liu, X. Q. Hao, Z. Stary and D. W. Schubert, Eur. Polym. J., 2016, 78, 106–115 CrossRef CAS.
- G. Z. Wu, B. P. Li and J. D. Jiang, Polymer, 2010, 51, 2077–2083 CrossRef CAS.
- H. Xiu, Y. Zhou, J. Dai, C. M. Huang, H. W. Bai, Q. Zhang and Q. Fu, RSC Adv., 2014, 4, 37193–37196 RSC.
- X. Q. Liu, R. Y. Bao, Z. Y. Liu, W. Yang, B. H. Xie and M. B. Yang, Polym. Test., 2013, 32, 141–149 CrossRef CAS.
- D. R. Paul and J. W. Barlow, J. Macromol. Sci., Part C: Polym. Rev., 1980, 18, 109–168 CrossRef.
- N. Kitayama, H. Keskkula and D. R. Paul, Polymer, 2000, 41, 8041–8052 CrossRef CAS.
- X. F. Wei, R. Y. Bao, Z. Q. Cao, W. Yang, B. H. Xie and M. B. Yang, Macromolecules, 2014, 47, 1439–1448 CrossRef CAS.
- P. M. Ma, T. F. Shen, P. W. Xu, W. F. Dong, P. J. Lemstra and M. Q. Chen, ACS Sustainable Chem. Eng., 2015, 3, 1470–1478 CrossRef CAS.
- H. W. Zhao, Y. J. Bian, Y. Li, Q. L. Dong, C. Y. Han and L. S. Dong, J. Mater. Chem. A, 2014, 2, 8881–8892 CAS.
- H. Tsuji, Macromol. Biosci., 2005, 5, 569–597 CrossRef CAS PubMed.
- H. Tsuji, Adv. Drug Delivery Rev., 2016, 107, 97–135 CrossRef CAS PubMed.
- L. L. Han, G. R. Shan, Y. Z. Bao and P. J. Pan, J. Phys. Chem. B, 2015, 119, 14270–14279 CrossRef CAS PubMed.
- P. J. Pan, L. L. Han, J. N. Bao, Q. Xie, G. R. Shan and Y. Z. Bao, J. Phys. Chem. B, 2015, 119, 6462–6470 CrossRef CAS PubMed.
- J. Dai, H. W. Bai, Z. W. Liu, L. Chen, Q. Zhang and Q. Fu, RSC Adv., 2016, 6, 17008–17015 RSC.
- Z. W. Liu, Y. L. Luo, H. W. Bai, Q. Zhang and Q. Fu, ACS Sustainable Chem. Eng., 2016, 4, 111–120 CrossRef CAS.
- D. Ponnamma, K. K. Sadasivuni, Y. Grohens, Q. P. Guo and S. Thomas, J. Mater. Chem. C, 2014, 2, 8446–8485 RSC.
- R. Y. Bao, W. Yang, W. R. Jiang, Z. Y. Liu, B. H. Xie, M. B. Yang and Q. Fu, Polymer, 2012, 53, 5449–5454 CrossRef CAS.
- D. Y. Bai, H. L. Liu, H. W. Bai, Q. Zhang and Q. Fu, Sci. Rep., 2016, 6, 20260 CrossRef PubMed.
- Y. J. Li and H. Shimizu, Macromol. Biosci., 2007, 7, 921–928 CrossRef CAS PubMed.
- H. Xiu, C. M. Huang, H. W. Bai, J. Jiang, F. Chen, H. Deng, K. Wang, Q. Zhang and Q. Fu, Polymer, 2014, 55, 1593–1600 CrossRef CAS.
- D. F. Wu, J. H. Wang, M. Zhang and W. D. Zhou, Ind. Eng. Chem. Res., 2012, 51, 6705–6713 CrossRef CAS.
- S. T. Nair, P. P. Vijayan, P. Xavier, S. Bose, S. C. George and S. Thomas, Compos. Sci. Technol., 2015, 116, 9–17 CrossRef.
- M. Bousmina, A. Ait-Kadi and J. B. Faisant, J. Rheol., 1999, 43, 415–433 CrossRef CAS.
- V. Ojijo and S. S. Ray, Polymer, 2015, 80, 1–17 CrossRef CAS.
- L. Lin, C. Deng, G. P. Lin and Y. Z. Wang, Ind. Eng. Chem. Res., 2015, 54, 5643–5655 CrossRef CAS.
Footnote |
| † Electronic supplementary information (ESI) available. See DOI: 10.1039/c6ra27401c |
| This journal is © The Royal Society of Chemistry 2017 |

