
 Open Access Article
 This Open Access Article is licensed under a
 Creative Commons Attribution 3.0 Unported Licence
Extraction and characterization of anti-oxidative polysaccharide–protein complexes from Corbicula fluminea through three-phase partitioning
Yao-Yao Wang,
Wen-Yi Qiu,
Zhen-Bin Wang,
Hai-Le Ma and
Jing-Kun Yan *
*
School of Food & Biological Engineering, Jiangsu University, Zhenjiang, 212013, China. E-mail: jkyan_27@163.com; Tel: +86-15952819661
First published on 13th February 2017
Abstract
In this study, a simple, efficient, and green bioseparation technology called three-phase partitioning (TPP) was employed to extract and separate polysaccharide–protein complexes (PSP) from Corbicula fluminea. The highest extraction yield of PSP was 9.0% under the following optimal conditions: 20% (w/v) ammonium sulfate concentration, 1.5![[thin space (1/6-em)]](https://www.rsc.org/images/entities/char_2009.gif) :1.0 (v/v) t-butanol to crude extract ratio, 30 min, and 35 °C. This value was higher than the yield (7.6%) of E-PSP prepared through conventional enzyme extraction. The carbohydrate content (81.7%) of PSP was higher and its molecular weight (61.5 kDa; 72.4%) was lower than those of E-PSP. Although PSP and E-PSP are proteoglycans with different monosaccharide and amino acid compositions, their primary chemical structures did not remarkably differ after TPP was performed. The antioxidant activities of PSP were more evident than those of E-PSP in vitro. Thus, TPP could be potentially used for separation of active PS or PSP from natural sources.
:1.0 (v/v) t-butanol to crude extract ratio, 30 min, and 35 °C. This value was higher than the yield (7.6%) of E-PSP prepared through conventional enzyme extraction. The carbohydrate content (81.7%) of PSP was higher and its molecular weight (61.5 kDa; 72.4%) was lower than those of E-PSP. Although PSP and E-PSP are proteoglycans with different monosaccharide and amino acid compositions, their primary chemical structures did not remarkably differ after TPP was performed. The antioxidant activities of PSP were more evident than those of E-PSP in vitro. Thus, TPP could be potentially used for separation of active PS or PSP from natural sources.
Introduction
Polysaccharides (PS) represent a major class of bioactive molecules widely derived from renewable sources, such as plants, animals, and microorganisms. These natural polymeric carbohydrates are extensively used in various biomedical applications and functional foods because of their notable and excellent bioactivities, such as immunostimulating, antitumor, and antioxidant activities, and other health benefits.1–3 Crude PS is usually extracted through classical hot water extraction and ethanol precipitation. High-purity homogeneous PS is then obtained through a series of separation and purification procedures, including deproteinization, decoloration, dialysis, and column chromatographies.3 However, these procedures are very tedious and complex, and a large amount of volatile organic solvents, such as methanol, ethanol and chloroform, are consumed. In this case, three-phase partitioning (TPP) was utilized an alternative technique for extraction and separation of bioactive PS from natural resources to solve the mentioned drawbacks.Three-phase partitioning (TPP) is an emerging and promising nonchromatographic bioseparation technology.4,5 In this process, salt, such as ammonium sulfate, is added to an aqueous solution containing proteins. A water-miscible aliphatic alcohol, such as t-butanol, is then added to form a three-phase system comprising upper, middle, and lower phases.4 Pigments, lipids, and hydrophobic compounds are enriched in the upper phase (t-butanol), proteins are concentrated in the middle phase, and saccharides and other polar compounds are mainly found in the lower aqueous phase (ammonium sulfate).6 However, TPP requires complex procedures and usually involves numerous operating principles, including ionic strength, exclusion-crowding effects, kosmotropy, osmotic stress, cavity surface tension enhancement, conformational protein tightening, and protein hydration shifts.4,7 TPP as a simple, rapid, and economical process has been widely investigated and successfully used to separate and purify numerous biomolecules, such as proteins, enzymes, oils or lipids, and small-molecule organic compounds, from crude suspensions or extracts.4,6,8–11 This technology has also been applied to extract and separate starch,12 starch derivatives,12 chitosan,13 alginates,14 levan and hydrolyzed levan.15 More recently, Tan et al. reported that TPP is utilized to separate and purify aloe polysaccharides (APS) and proteins simultaneously through single-step extraction.16 High extraction efficiencies of APS and protein are obtained under the following optimized conditions: 26.4% (w/w) ammonium sulfate and 20.8% (w/w) t-butanol at 30 °C and pH 6.5. APS in the lower phase is further purified through dialysis and a purity of 81.7% is acquired. Therefore, TPP as a fast, cost-effective, energy-saving, and green process can be employed to separate and purify bioactive PS.
Asian clam (Corbicula fluminea) is a freshwater bivalve mollusk native to Asia and consumed as food and traditional Chinese medicine in China. Modern pharmacological studies have reported that C. fluminea may provide a broad spectrum of bioactivities, including antioxidant, anticancer, antihypertensive, hepatoprotective, and hypocholesterolemic effects.17–20 Showing evident antioxidant and antitumor activities, PS or PS–protein complexes (PSP) as important bioactive molecules have been extracted and separated from C. fluminea through enzyme extraction and ultrasound-assisted extraction.21–23 PS or PSP can be explored as a functional food or medicine for potential applications in food industry, cosmetics, and pharmacy. However, PS or PSP have yet to be separated and characterized from C. fluminea through TPP.
This work aimed to extract and separate PSP from C. fluminea through TPP. The effects of extraction variables, such as ammonium sulfate concentration, t-butanol to crude extract ratio, extraction time, and temperature, on the extraction yield (EY) of PSP were investigated. The physicochemical properties and in vitro antioxidant activities of PSP were determined and compared with those of partially purified PSP (E-PSP) prepared through conventional enzyme extraction and separation protocols.
Materials and methods
Materials and chemicals
C. fluminea was obtained from Suqian Chengzihu Food Co., Ltd., Suqian, Jiangsu, China. Fresh C. fluminea was freeze-dried, ground, sieved (60 mesh), and then sealed in airtight plastic bags before use. Monosaccharide standards, hydrogen peroxide (H2O2), 1-phenyl-3-methyl-5-pyrazolone (PMP), 6-hydroxy-2,5,7,8-tetramethylchroman-2-carboxylic acid (Trolox), 2,2′-azinobis(3-ethylbenzothiazoline-6-sulphonic acid) (ABTS) and 2,4,6-tris(2-pyridyl)-s-triazine were purchased from Sigma-Aldrich Chemical Co. (St. Louis, MO, USA). All other chemicals and solvents were of laboratory grade and used without further purification.Preparation of crude enzyme extract
C. fluminea powder (10.0 g) was treated thrice with refluxing petroleum ether for 6 h each treatment to remove lipids and pigments. The residue was air dried and immersed in 300 mL acetic acid-phosphate buffer (0.1 M, pH 6.0). Afterward, 2% (w/w) papain was added into the mixture, and then the mixture was incubated at 60 °C for 2 h under continuous stirring. The mixture was boiled for 10 min to inactivate it and then centrifuged at 4000 rpm for 15 min. The obtained supernatant was used as the crude extract for TPP. The carbohydrate and soluble protein content of the crude extract were determined to be 13.4% and 2.5%, respectively.Three-phase partitioning (TPP)
TPP experiments were performed in a 50 mL graded and transparent centrifuge tube at a desired temperature (20–50 °C) in a shaking incubator according to previously reported method with minor modifications.4 A specific amount of ammonium sulfate ((NH4)2SO4, 10–60%, w/v) was added to the crude extract (10 mL) prepared and vortexed gently, followed by the addition of a measured amount of t-butanol (5–30 mL). The extraction tube was placed in the shaking incubator at 100 rpm for 15–75 min. To ensure a complete and quick phase separation, the mixture was centrifuged (4000 rpm, 10 min) for forming clear three phases. The upper phase consisting of the organic solvents (t-butanol) was collected and reused through evaporation under reduced pressure. Free proteins were almost extracted into the middle phase. The lower aqueous phase was mainly composed of (NH4)2SO4 and PSP. The volume of the lower phase was recorded then collected with a pipette for measurement and analysis. The obtained lower phase was further dialyzed (MWCO 8–12 kDa) against distilled water to remove salts then concentrated and freeze dried to achieve the purified PSP. Effects of process parameters, including (NH4)2SO4 concentration (%, w/v), t-butanol to crude extract ratio (v/v), time (min), and temperature (°C), on the extraction yield of PSP have been investigated. The detailed experimental steps for extraction and separation of PSP from C. fluminea crude extract using TPP are shown in Fig. 1.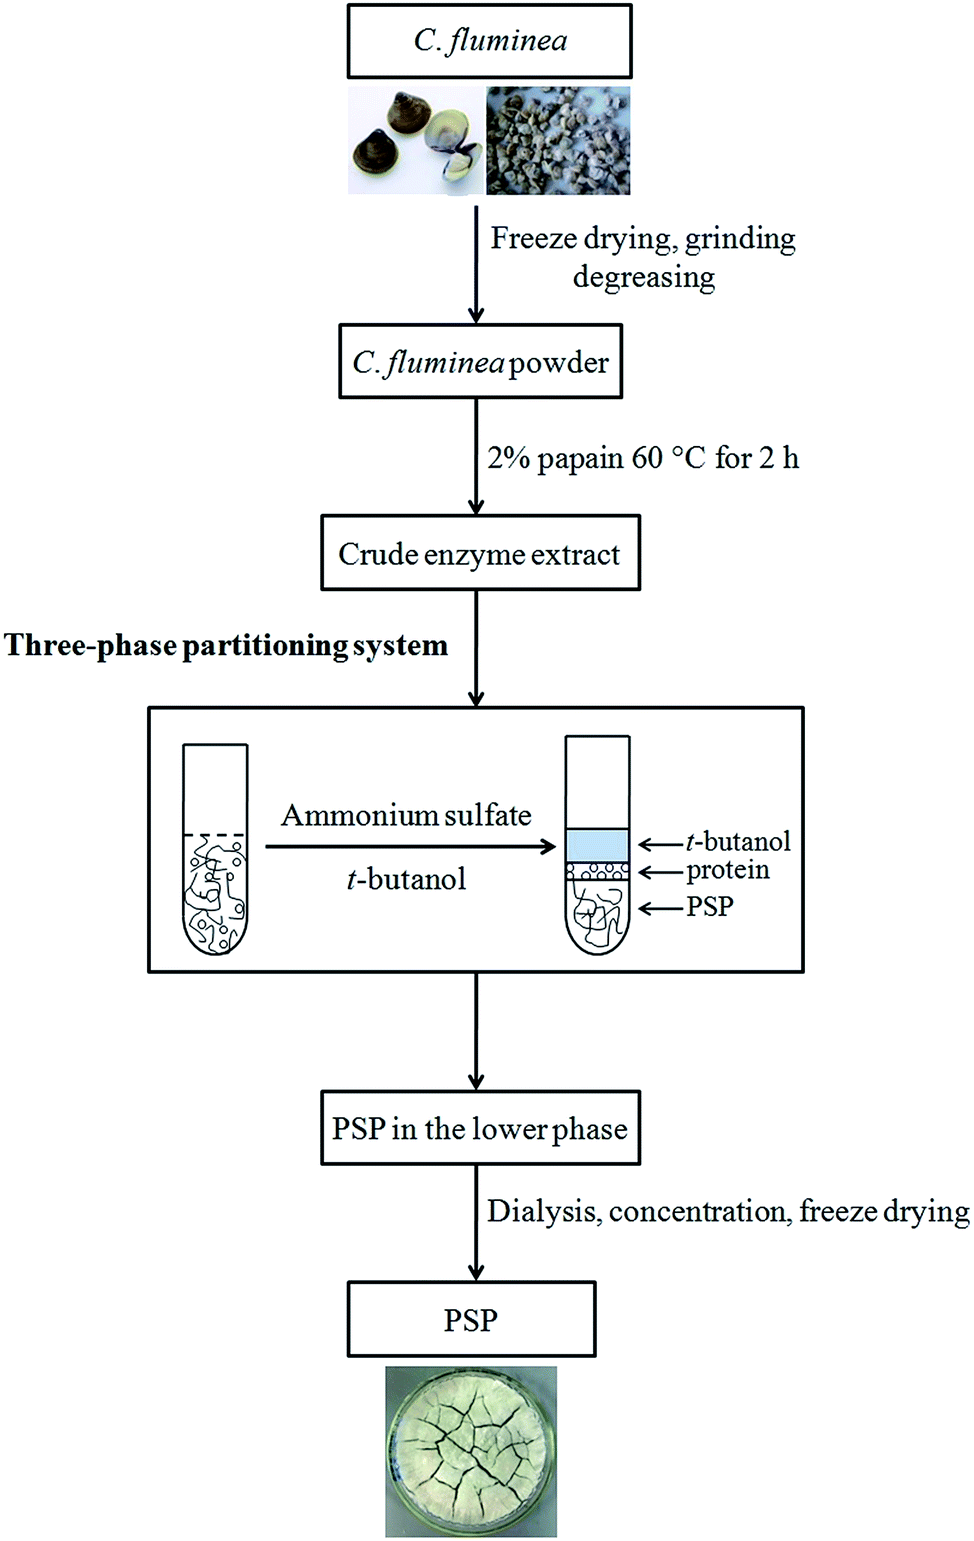 | ||
| Fig. 1 Detailed experimental steps for extraction and separation of PSP from C. fluminea crude extract using TPP system. | ||
The carbohydrate and soluble protein contents in the lower phase were determined through phenol–sulfuric acid method using D-glucose as a standard and Bradford method using bovine serum albumin.24,25 The EY (%) of PSP was calculated through EY = (CLVL)/M0 × 100%, where M0 is the total mass of initial C. fluminea powder and CL and VL are the concentration and volume of PSP in the lower phase at equilibrium.
Conventional enzyme extraction and separation
As for conventional enzyme extraction, the crude extract of C. fluminea obtained by papain extraction was concentrated through vacuum rotary evaporation at 40 °C, precipitated with 4 volumes of 95% ethanol at 4 °C overnight, and centrifuged at 5000 rpm for 20 min to collect the crude PSP. The separated proteins in the crude PSP were removed several times through Sevag agent, dialyzed (MWCO 8–12 kDa) against distilled water for 48 h to remove small molecules and impurities, and lyophilized to yield the partially purified PSP, namely, E-PSP.Determination of molecular weight
The molecular weight (MW) and molecular weight distribution (MWD) of the samples were determined using high performance gel permeation chromatography (HPGPC), with the instruments and conditions as previously reported.26 Dextran MW standards ranging from 5.2 to 1482 kDa (Sigma-Aldrich Chemical Co., St. Louis, MO, USA) were used for calibration. Data were collected and analyzed by the online Breeze software package (Waters Corp., Milford, MA, USA).Monosaccharide composition analysis
HPLC-PMP derivation method was used to quantitatively determine monosaccharide composition of samples based on a previously described study with slight modifications.27 Briefly, 10 mg of sample was completely hydrolyzed with 5 mL 2 M trifluoroacetic acid at 110 °C for 8 h. The hydrolysate was dried through evaporation under reduced pressure at 40 °C and then redissolved in 2.0 mL distilled water. A total of 450 μL of the hydrolysate was mixed with 450 μL of 0.5 M PMP in methanol and 450 μL of 0.3 M NaOH and then reacted at 70 °C for 30 min. The reaction was stopped by neutralizing with 450 μL of 0.3 M HCl, and the product was partitioned thrice with chloroform. The aqueous layer was collected and filtered through a 0.45 μm membrane and applied to HPLC. The HPLC was performed with an Agilent ZORBAX Eclipse XDB-C18 column (5 μm, 4.6 × 150 mm) on an Agilent 1100 instrument at 25 °C with potassium phosphate-buffered saline (0.05 M, pH 6.9) containing 15% (solvent A) and 40% acetonitrile (solvent B) as mobile phases at a flow rate of 1.0 mL min−1, and UV detection was performed at 250 nm.Amino acid composition analysis
The sample (2.0 mg) was hydrolyzed with 1.0 mL of 6 M HCl at 110 °C for 24 h in a sealed tube. The hydrolysate was dried by evaporation under reduced pressure and redissolved in 100 μL of citrate buffer. The amino acid composition was analyzed using an automated amino acid analyzer (HITACHI L-8800, Amino Acid Analyzer, Japan).UV-vis and FT-IR analysis
The UV-visible absorption spectra of samples (1.0 mg mL−1) were measured by a Varian Cary 100 spectrophotometer (Varian Co., USA) in the wavelength range of 190–400 nm at room temperature. The FT-IR spectra of samples were performed with a Nexus 670 FT-IR spectrometer (Thermo Nicolet Co., USA) in the wavenumber ranging from 500 to 4000 cm−1 with KBr pellets and then referenced against air.In vitro antioxidant activity
In this study, four different assays, namely, the DPPH radical scavenging activity, hydroxyl radical scavenging activity, Trolox equivalent antioxidant capacity (TEAC) assay, and ferric reducing ability of plasma (FRAP) assay, were used to determine the in vitro antioxidant activities of PSP and E-PSP.Concerning the DPPH scavenging assay, the samples were previously dissolved in distilled water at various concentrations (0.5–5.0 mg mL−1). A volume of 3 mL of the solution was added into 1 mL 0.1 mM DPPH solution in methanol. The reaction mixture was stirred and incubated at room temperature for 30 min in the dark. The absorbance of the resulting solution was measured at 517 nm using a UV-1600 Spectrophotometer. The DPPH radical scavenging activity was calculated based on the following equation: scavenging activity (%) = [1 − (A1 − A2)/A0] × 100%, where A0, A1, and A2 are the respective absorbance values of the blank control (deionized water), the sample with DPPH solution, and the sample with deionized water. Vc was used as a positive antioxidant reference.
For the adapted hydroxyl radical method, the samples were previously dissolved at different concentrations (0.5–5.0 mg mL−1) in distilled water. A volume of 0.2 mL of the tested solution (sample or control) was added into an equal volume of an aqueous solution of 5 mM FeSO4. Then, a volume of 0.2 mL of 1% (v/v) H2O2 was added into the mixture under continuous stirring. After stirring and incubation at room temperature for 60 min, the absorbance of the resulting solution was measured at 510 nm by a UV-1600 Spectrophotometer (Beijing Ruili Analytical Instrument Co., Ltd., China). The hydroxyl radical scavenging activity (%) was estimated by the following formula: scavenging activity (%) = (1 − A/A0) × 100%, where A, and A0 are the absorbance values of the sample and blank control (distilled water), respectively. Vitamin C (Vc) was used as a positive antioxidant reference.
As for TEAC assay, the TEAC of samples was tested against ABTS·+ radical, which was generated from the oxidation of ABTS by potassium persulphate. The TEAC values were derived from the calibration curve generated with Trolox (0–30 μM). In the FRAP assay, ferric to ferrous ion reduction at low pH led to the formation of a colored ferrous–tripyridyltriazine complex, and the FRAP values of the samples were obtained by calibration with ferrous sulphate (0–30 μM). Details of the operating conditions and methods were described as previously reported.28
Statistical analysis
All experiments are conducted in three replicates and the mean ± standard deviation (SD) is used in the analysis. The figures are plotted by OriginPro Software Version 9.0 (OriginLab Corp., MA, USA).Results and discussion
Extraction and separation of PSP through TPP
In the present work, the freeze-dried C. fluminea powder was selected as the material to extract PS or PSP by using TPP separation system, and the chemical compositions such as protein, carbohydrate, lipid, moisture and ash were determined to be around 64.0%, 11.3%, 10.6%, 5.0% and 4.3%, respectively. According to our preliminary trials (data not shown), the majority of PSP was found to be mainly concentrated in the lower aqueous phase. Thus, in the present work, only the lower aqueous phase of TPP was collected and investigated. To obtain the maximum extraction yield of PSP, different partitioning experiments at different conditions, such as (NH4)2SO4 concentrations of 10, 20, 30, 40, 50, and 60% w/v; t-butanol to crude extract ratios of 0.5:1.0, 1.0:1.0, 1.5:1.0, 2.0:1.0, 2.5:1.0, and 3.0:1.0, v/v; extraction time of 15, 30, 45, 60, and 75 min; and temperatures of 20 °C, 25 °C, 30 °C, 35 °C, 40 °C, 45 °C, and 50 °C, were performed. The results are presented in Fig. 2–5. As shown in the figures, all these TPP experimental conditions are important and effective on extraction and separation of the PSP from C. fluminea.
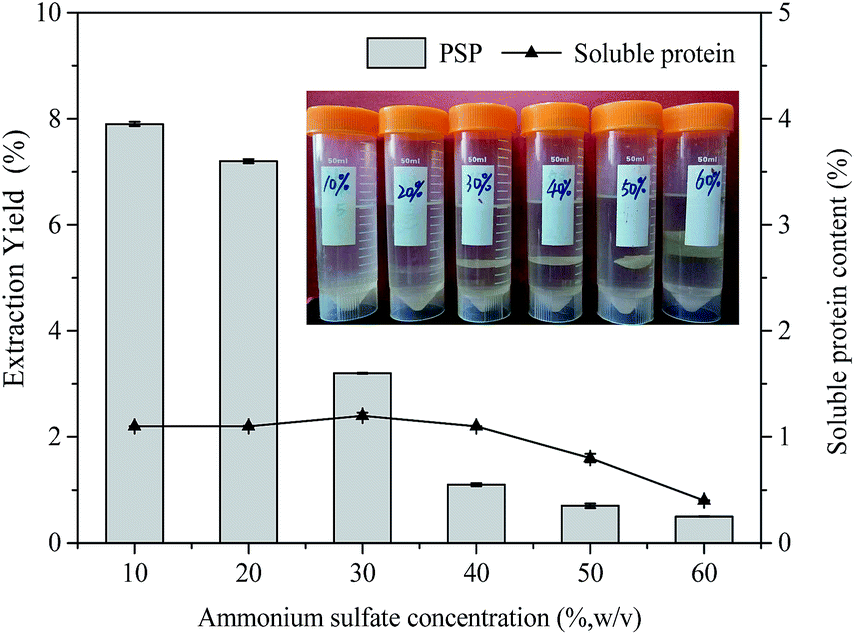 | ||
| Fig. 2 Effects of ammonium sulfate concentration (%, w/v) on extraction yield (%) of PSP and soluble protein content (%) in the lower aqueous phase. The inset is the photo of TPP process affected by ammonium sulfate concentration. | ||
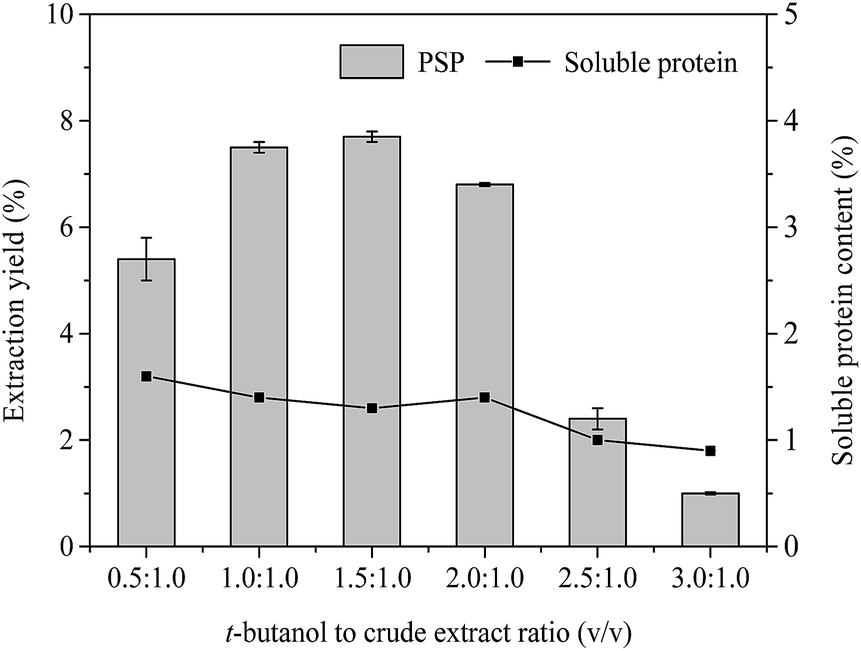 | ||
| Fig. 3 Effects of t-butanol to crude extract ratio (v/v) on extraction yield (%) of PSP and soluble protein content (%) in the lower aqueous phase. | ||
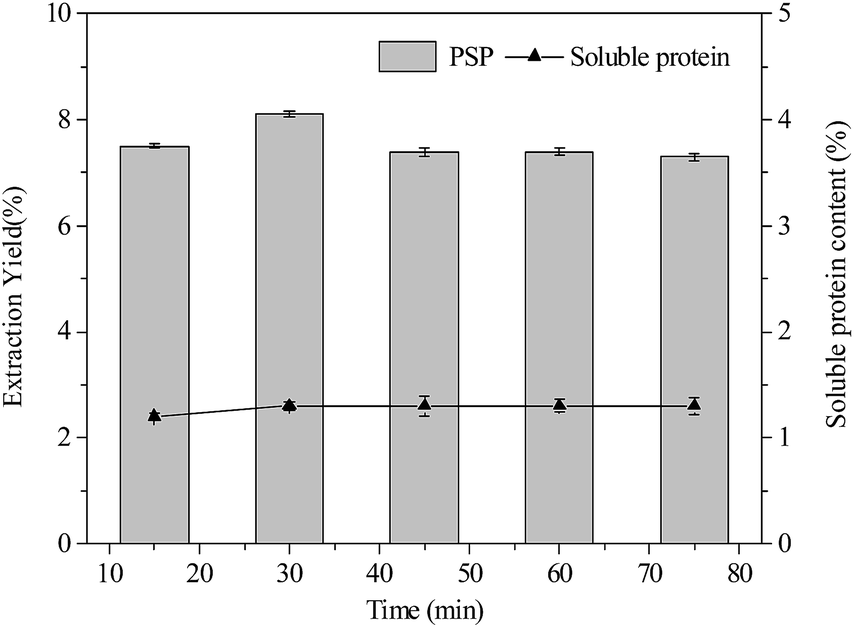 | ||
| Fig. 4 Effects of extraction time (min) on extraction yield (%) of PSP and soluble protein content (%) in the lower aqueous phase. | ||
 | ||
| Fig. 5 Effects of temperature (°C) on extraction yield (%) of PSP and soluble protein content (%) in the lower aqueous phase. | ||
Effect of (NH4)2SO4 concentration
(NH4)2SO4 concentration plays a very important role in TPP for partitioning proteins, which may be attributed to salting out effect. As the salt concentration increases, the protein surface becomes charged, further resulting in protein aggregation.4 Moreover, since a kosmotropic system was formed by (NH4)2SO4 and t-butanol together, (NH4)2SO4 concentration should be optimized to obtain maximum extraction yield. Therefore, in this work, the effect of (NH4)2SO4 concentration on the extraction yield of PSP was studied by varying (NH4)2SO4 concentration from 10% to 60% (w/v) at constant 1.5:1.0 t-butanol to crude extract ratio, 60 min extraction time, and 25 °C. As shown in Fig. 2, the extraction yield of PSP gradually decreased with the increase in (NH4)2SO4 concentration, and the maximum PSP extraction yield of 7.9% in the lower aqueous phase was obtained with 10% (NH4)2SO4 concentration. As (NH4)2SO4 concentration increased, a higher relative amount of proteins are enriched in the middle phase, resulting in the thickening of the middle layer (inset Fig. 2). Accordingly, the soluble protein content in the lower phase was reduced from 1.2% to 0.4% (Fig. 2). This could be because at higher salt concentration, the water molecules are attracted by salts through the stronger salting out effect. This results in the stronger protein–protein interactions and causes coagulations of protein molecules through hydrophobic interactions,29 thereby giving rise to the accumulations of proteins in the middle phase. At the same time, the stronger salting out effect breaks water–water hydrogen bond, which lessens the availability of water molecules for solvation of carbohydrates, leading to a significant decrease in the extraction yield of PSP in the lower aqueous phase. Moreover, excess (NH4)2SO4 will result in the denaturation of protein and reduces the PSP extraction yield.30 A protein salting out in the TPP caused by sulfate is usually related to kosmotropy, osmotic stressor, ionic strength effects, exclusion crowding agent, and the binding of sulfate to cationic sites of protein.4,31 Although the maximum extraction yield of PSP was obtained at 10% (w/v) (NH4)2SO4 concentration, the formed interphase was obscure and unstable (inset Fig. 2) and is not convenient for the separation of PSP. Based on the obtained results, the TPP system containing 20% (w/v) (NH4)2SO4 appeared to have the optimum salt content for partitioning PSP, as this system produced the higher extraction yield in the lower aqueous phase. Tan et al. (2015) also reported that approximately 26% (w/v) (NH4)2SO4 is the best salt concentration for efficiently separating APS through TPP.16
Effect of t-butanol to crude extract ratio
In the TPP system, t-butanol as cosolvent has been reported to possess a number of advantages over other organic solvents (methanol and ethanol), e.g., higher molecular size, branched chain structure, significant crowding, and kosmotropic effects at a temperature range of 20–30 °C.4,32 In general, t-butanol increases the buoyancy of the precipitated protein by binding to the protein, which causes the protein to float above the lower aqueous phase.33 Furthermore, t-butanol has been commonly used in studies on TPP of proteins and PS.4,14 Fig. 3 displays the effect of different t-butanol to crude extract ratios (0.5:1.0, 1.0:1.0, 1.5:1.0, 2.0:1.0, 2.5:1.0, and 3.0:1.0) on the extraction yield of PSP when other conditions, such as 20% (w/v) (NH4)2SO4 concentration, 60 min, and 25 °C, are kept constant. The highest extraction yield of PSP (7.7%) with 1.3% soluble protein was obtained from the lower aqueous phase of a TPP system with the t-butanol to crude extract ratio of 1.5:1.0 (v/v). As the ratio of t-butanol to crude extract continues to increase from 1.5:1.0 to 3.0:1.0 (v/v), the extraction yield of PSP and soluble protein content in the lower phase decreased. Similar results have been previously reported by Mondal et al.12 and Tan et al.16 Higher amount of t-butanol may attract more water molecules from aqueous phase, subsequently increasing salt concentration and weakening the intermolecular interactions of water molecules and carbohydrates in the lower aqueous phase, thus leading to the decrease of PSP yield.34 Additionally, increased surface tension and vapor pressure of mixture, as well as denaturation of proteins in aqueous phase, may result in more precipitation of proteins concentrated in interface, therefore reducing the soluble protein content in the lower phase (Fig. 3). However, if the amount of t-butanol is less, it does not adequately synergize with (NH4)2SO4.29 Therefore, in this study, the 1.5:1.0 ratio of t-butanol to crude extract (v/v), which produced the highest extraction yield of PSP, was selected for further partitioning experiments.
Effect of time
As shown in Fig. 4, variation in extraction time from 15 min to 75 min had minimum to influence on extraction yield of PSP and soluble protein content in the lower phase when constant conditions of 20% (w/v) (NH4)2SO4 concentration 1.5:1.0 (v/v) t-butanol to crude extract ratio, and 25 °C were maintained. The 30 min extraction time was found to be sufficient for the TTP system to reach equilibrium for partitioning PSP. However, after 30 min, a slight decrease in the extraction yield of PSP was noted. Hence, for partitioning C. fluminea PSP in this work, 30 min extraction time in the TPP was found to be the optimum.
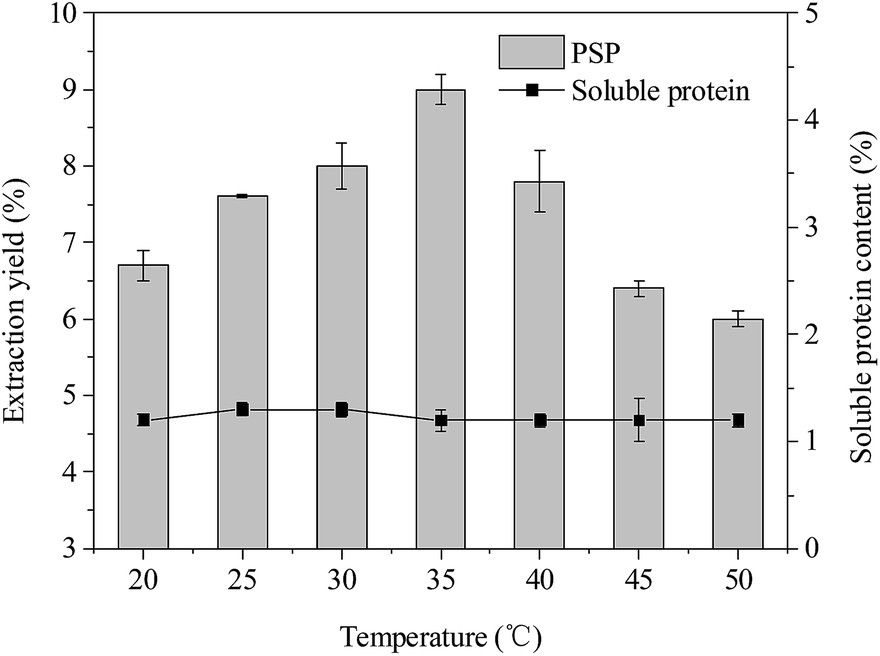
Effect of temperature
According to the reported literatures,14,35 temperature also has an important influence on the TPP, which can be because higher temperature can accelerate the velocity of mass transfer. The temperature range of 20–40 °C was usually considered to be optimal in TPP. As shown in Fig. 5, the extraction yield of PSP first increased and then decreased when the temperature was increased from 20 °C to 50 °C. The highest extraction yield of PSP (9.0%) was obtained at 35 °C while keeping all other parameters, such as 20% (w/v) (NH4)2SO4 concentration, 1.5:1.0 (v/v) t-butanol to crude extract ratio, and 30 min, at a constant value. In addition, within a temperature range of 20–50 °C, the soluble protein content in the lower phase basically remained at approximately 1.2%. The higher extraction yield may be attributed to enhanced mass transfer in this system cause by increasing temperature from 20 °C to 35 °C. The increase in temperature is probably beneficial to the remaining PS in the lower aqueous phase, that is, the increase in energy in this system could have facilitated the unfolding of the PS with exposure of a larger number of hydroxyl groups. This favored the formation of more hydrogen bonds or linkings, making the unfolded PS more hydrophilic, thus, more PS could be concentrated in the aqueous phase.15 Similarly, Mondal et al. and Sharma et al. reported that 40 °C temperature in the TPP system was the optimal for bioseparation of starch and chitosan, respectively.12,13 Recently, Tan et al. (2015) also found that the 30 °C was more favorable for simultaneous purification of APS and protein using TPP and resulted in better extraction efficiency of APS (∼92%).16 However, a higher temperature (>35 °C) also causes higher energy consumption. Hence, 35 °C was the chosen temperature for partitioning experiments.
Characterization of physicochemical properties
To evaluate the superiority of TPP for green and efficient preparation of PSP from C. fluminea, a conventional enzyme extraction and a series of separation protocols, including ethanol precipitation, deproteinization (approximately 10 times), dialysis, and freeze drying, were used to prepare PSP from C. fluminea, namely as E-PSP. The physicochemical properties, chemical compositions, and antioxidant activities in vitro of E-PSP and PSP were compared and investigated. Table 1 presents the physicochemical properties and chemical compositions of PSP and E-PSP. Notably, the extraction yield of PSP (9.05%) was significantly higher than that of E-PSP (7.6%) and EP (6.4%) extracted through enzyme extraction.22 However, the extraction yield of PSP was lower than EP-us (17.8%) extracted through ultrasound-assisted enzyme extraction.22 Extensive volatile organic solvents, such as methanol, ethanol, acetone, and chloroform, are often used for extraction and seperation of PS. Unfortunately, these solvents have harmful effects on the environment and even people's health and also increase the extracting cost and the loss of PS. In addition, the separation procedure of PS is tedious and intricate, making it only useful for analytical or preparative purposes in the laboratory but not favorable for large-scale processing. Although the crude EP-us obtained by Liao et al. had a higher extraction yield,22 PSP obtained from TPP system in this work had very high carbohydrate content (81.7%). In addition, the PSP was colorless (Fig. 1), but the colors of E-PSP, EP, and EP-us were pale yellow or yellow. These results revealed that PSP obtained from TPP had higher extraction yield and purity than those obtained from conventional methods.As shown in Table 1, the protein contents of PSP and E-PSP were approximately 2.7% and 3.4%. Moreover, two characteristic absorption peaks at approximately 205 nm and 280 nm were observed in the UV absorption spectra of PSP and E-PSP (data not shown), thereby further confirming that they might be proteoglycans. On the other hand, the results also suggested that TPP could be developed as an alternative method for effectively removing free proteins from PS instead of Sevag method. The amino acid composition of PSP and E-PSP is summarized in Table 2, and the results revealed that PSP consisted of 14 kinds of amino acids; however, glycine, alanine, and tryptophan were not found. Meanwhile, E-PSP was composed of 16 kinds of amino acids, and only tryptophan was not determined. Because of the difference of extraction and separation methods, there is a discrepancy in amino acid composition like glycine and alanine. PSP was rich in aspartic acid (14.2%), glutamic acid (16.3%), cysteine (14.4%), and valine (9.0%), whereas E-PSP was rich in aspartic acid (9.9%), glutamic acid (12.4%), glycine (10.8%), lysine (11.8%), methionine (11.2%), and arginine (10.1%). The result indicated that PSP is possibly an acidic proteoglycan. The combined amounts of serine and threonine in PSP and E-PSP were 10.6% and 9.5%, respectively, indicating that O-glycosidic bonds may be involved in binding between protein and carbohydrate through GlcN-α-serine/threonine linkages.36
| Amino acids | PSP | E-PSP | Amino acids | PSP | E-PSP |
|---|---|---|---|---|---|
| a Not determined. | |||||
| Aspartic acid | 142.5 | 99.4 | Leucine | 43.4 | 22.1 |
| Threonine | 60.5 | 49.6 | Tyrosine | 26.0 | 23.2 |
| Serine | 45.5 | 45.6 | Phenylalanine | 27.5 | 21.0 |
| Glutamic acid | 163.4 | 123.8 | Lysine | 71.5 | 117.5 |
| Glycine | n.d.a | 108.3 | Methionine | 77.0 | 111.7 |
| Alanine | n.d.a | 24.0 | Histidine | 17.5 | 11.3 |
| Cysteine | 144.3 | 80.8 | Arginine | 62.8 | 101.3 |
| Valine | 90.2 | 43.4 | Tryptophan | n.d.a | n.d.a |
| Isoleucine | 27.9 | 17.0 | Total | 1000 | 1000 |
The monosaccharide composition of PSP and E-PSP was investigated using precolumn PMP derivatization and HPLC method, and the results are shown in Fig. 6a–c and Table 1. PSP was mainly composed of D-Glc, D-GlcN, and D-Man in a molar ratio of 10.8:4.4:1.0, and E-PSP was composed of D-Glc, D-GlcN, and D-Man with molar ratios of 32.0:8.0:1.0. The results suggested that PSP and E-PSP were both heteropolysaccharides and had the same monosaccharide composition with different molar ratios. Moreover, PSP and E-PSP were found to contain D-Glc as major monosaccharide, with certain proportions of D-GlcN and D-Man. The monosaccharide composition of PSP was suggested to be unaltered after TPP compared with E-PSP. Additionally, PSP and E-PSP were different from the previous studies because perhaps of the raw material sources and separation protocols.21,22
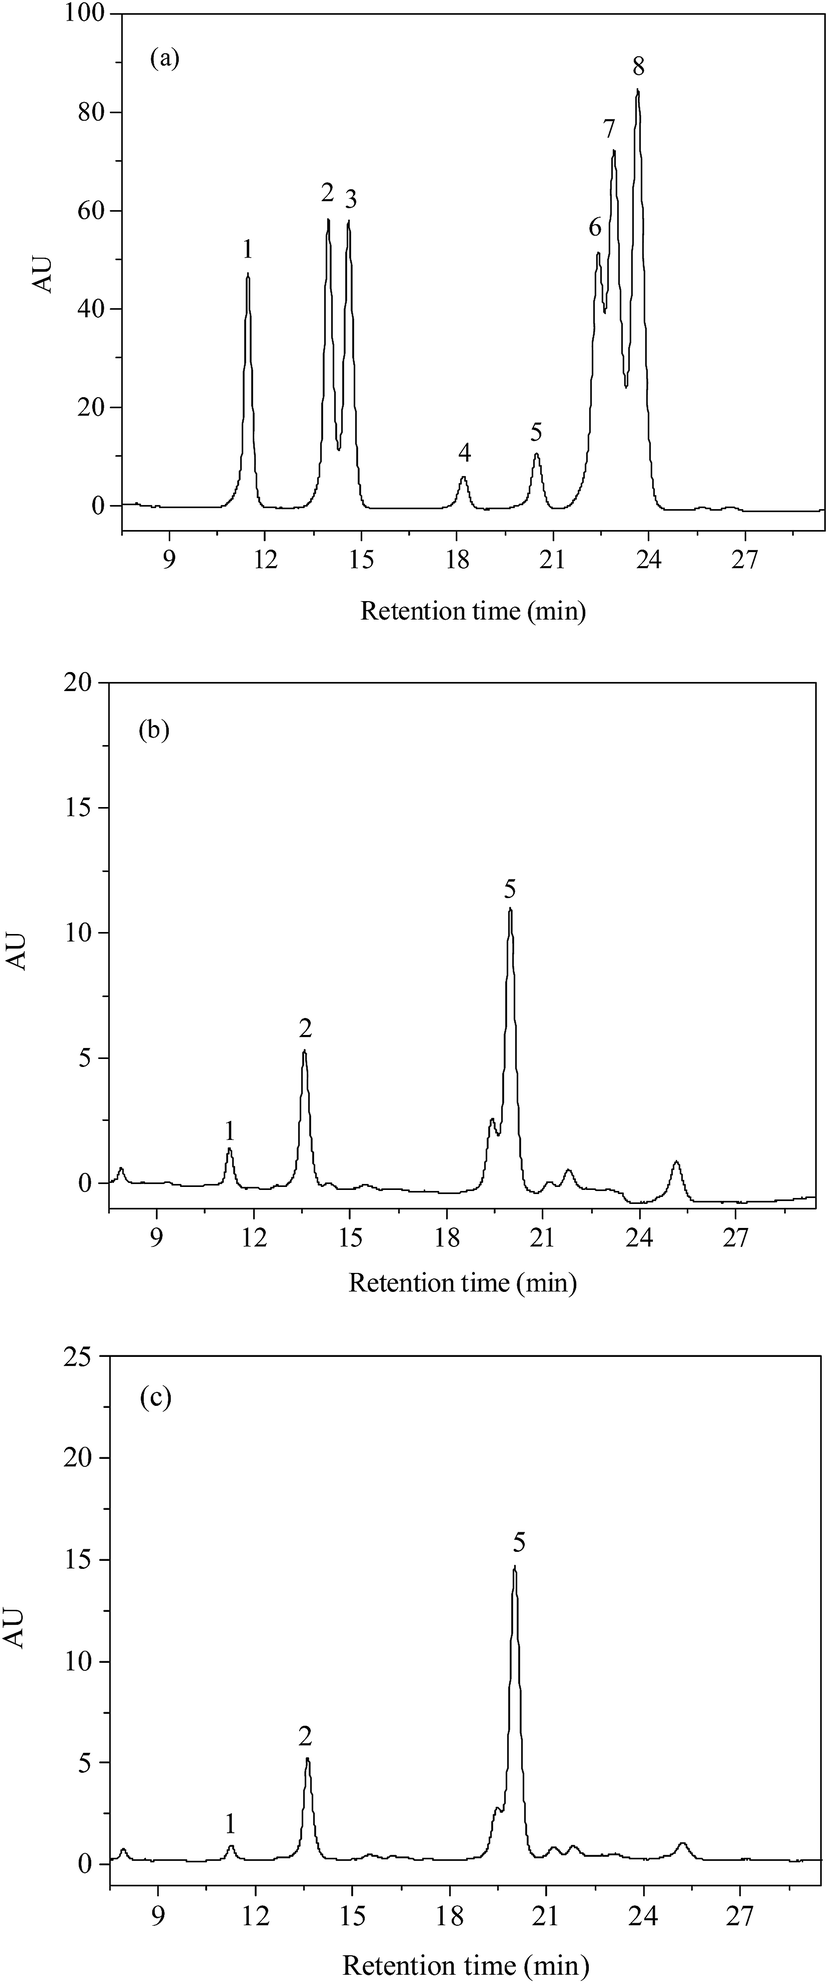 | ||
| Fig. 6 . HPLC chromatograms of (a) monosaccharide standards, (b) PSP, and (c) E-PSP. Peaks: 1, D-Man (Rt: 11.46 min); 2, D-GlcN (Rt: 13.97); 3, L-Rha (Rt: 14.60); 4, D-GalA (Rt: 18.19); 5, D-Glc (Rt: 20.49); 6, D-Gal (Rt: 22.40); 7, D-Xyl (Rt: 22.89); 8, D-Ara (Rt: 23.64). | ||
In this work, HPGPC was used to determine the molecular weights (MWs) and molecular weight distribution of PSP and E-PSP, and the results are summarized in Table 1. Both PSP and E-PSP were found to be composed of high-MW fractions (2113.4 kDa and 1980.9 kDa) and low-MW fractions (61.5 kDa and 248.4 kDa). PSP had significantly higher content of low-MW fraction at 61.5 kDa (72.4%) than that of E-PSP at 248.4 kDa (12.8%). The decrease in MW may be attributed to the degradation of PSP that occurred in the salt-rich phase. The (NH4)2SO4 used in TPP is a weak acidic salt because SO42− ionization degree is greater than the hydrolysis degree in the solution. PSP in acidic solutions can be caused by degradation and transfer of the high-MW fraction into the low-MW fraction, resulting in the decrease of MWs. This may be caused by the destruction of hydrogen-bonding interactions in acidic condition. In summary, TPP had a major effect on the MWs of PSP. The lower MWs are usually attributed to the enhanced antioxidant activity in vitro.37
Fig. 7 shows the FT-IR spectra of PSP and E-PSP. A strong and broad band at approximately 3380 cm−1 was ascribed to the O–H stretching vibration, and a weak peak at approximately 2910 cm−1 was caused by the C–H stretching vibration. The absorption bands at approximately 1643 cm−1 (amide I) and 1541 cm−1 (amide II) were attributed to the presence of protein,22 which is in line with the results presented in Tables 1 and 2. The band at approximately 1390 cm−1 was associated to the C–O stretching vibration and O–H deformation vibration. The strong absorption bands in the range of 1000–1200 cm−1 were associated with the C–O–H and C–O–C stretching vibrations.38 The absorption peaks at 1020 cm−1 and 1076 cm−1 were indicative of pyranose rings in PSP and E-PSP. Moreover, a characteristic peak was found in 816 cm−1, suggesting that the α-glycosidic bond existed in both the PSP and E-PSP. TPP had no apparent effect on the physicochemical properties and primary structures of the PSP isolated from C. fluminea.
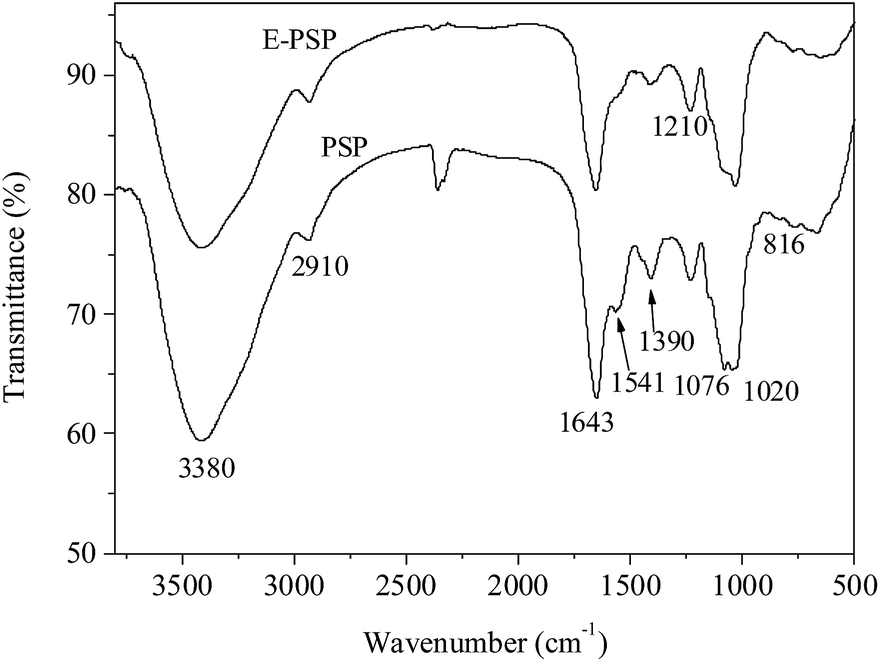 | ||
| Fig. 7 FT-IR spectra of PSP and E-PSP. | ||
In vitro antioxidant activities
The DPPH free radical scavenging activities of PSP and E-PSP compared with that of Vc were determined and shown in Fig. 8a. The DPPH free radical scavenging activities of PSP, E-PSP, and Vc increased with the increase of their concentrations ranging from 0.5 mg mL−1 to 5.0 mg mL−1. At 5.0 mg mL−1 concentration, the DPPH free radical scavenging activities of PSP and E-PSP were 74.8% and 18.4%. The DPPH free radical scavenging activities of PSP and E-PSP were much less than that of Vc (91.6%, 0.5 mg mL−1); however, the scavenging activity of PSP on DPPH free radical was much higher than that of E-PSP. Among reactive oxygen species, the hydroxyl radical is the most harmful to biomolecules, such as proteins, DNA, and lipids, in organisms.39 The scavenging capacity on hydroxyl radical is often used to evaluate the antioxidant activity of natural extracts, using Vc as positive control. As shown in Fig. 8b, PSP, E-PSP, and Vc all exhibited hydroxyl radical scavenging activity in a concentration-dependent manner. At 5.0 mg mL−1 concentration, the hydroxyl radical scavenging activities of PSP and E-PSP were approximately 69.4% and 50.6%, which were far lower than that of Vc (96.7%, 0.5 mg mL−1). Notably, PSP showed stronger scavenging capacity than E-PSP within the concentration range tested. TEAC and FRAP assays were also used to measure the total antioxidant power of the PS, and the results are illustrated in Fig. 8c. Both PSP and E-PSP exhibited the same trend on ABTS·+ radical scavenging activity and ferric reducing activity. However, PSP showed higher antioxidant activities, with TEAC value of 104.1 μmol Trolox per g sample and FRAP value of 45.0 μmol Fe2+ per g sample, than that of E-PSP at TEAC value of 54.3 μmol Trolox per g sample and FRAP value of 27.4 μmol Fe2+ per g sample, respectively.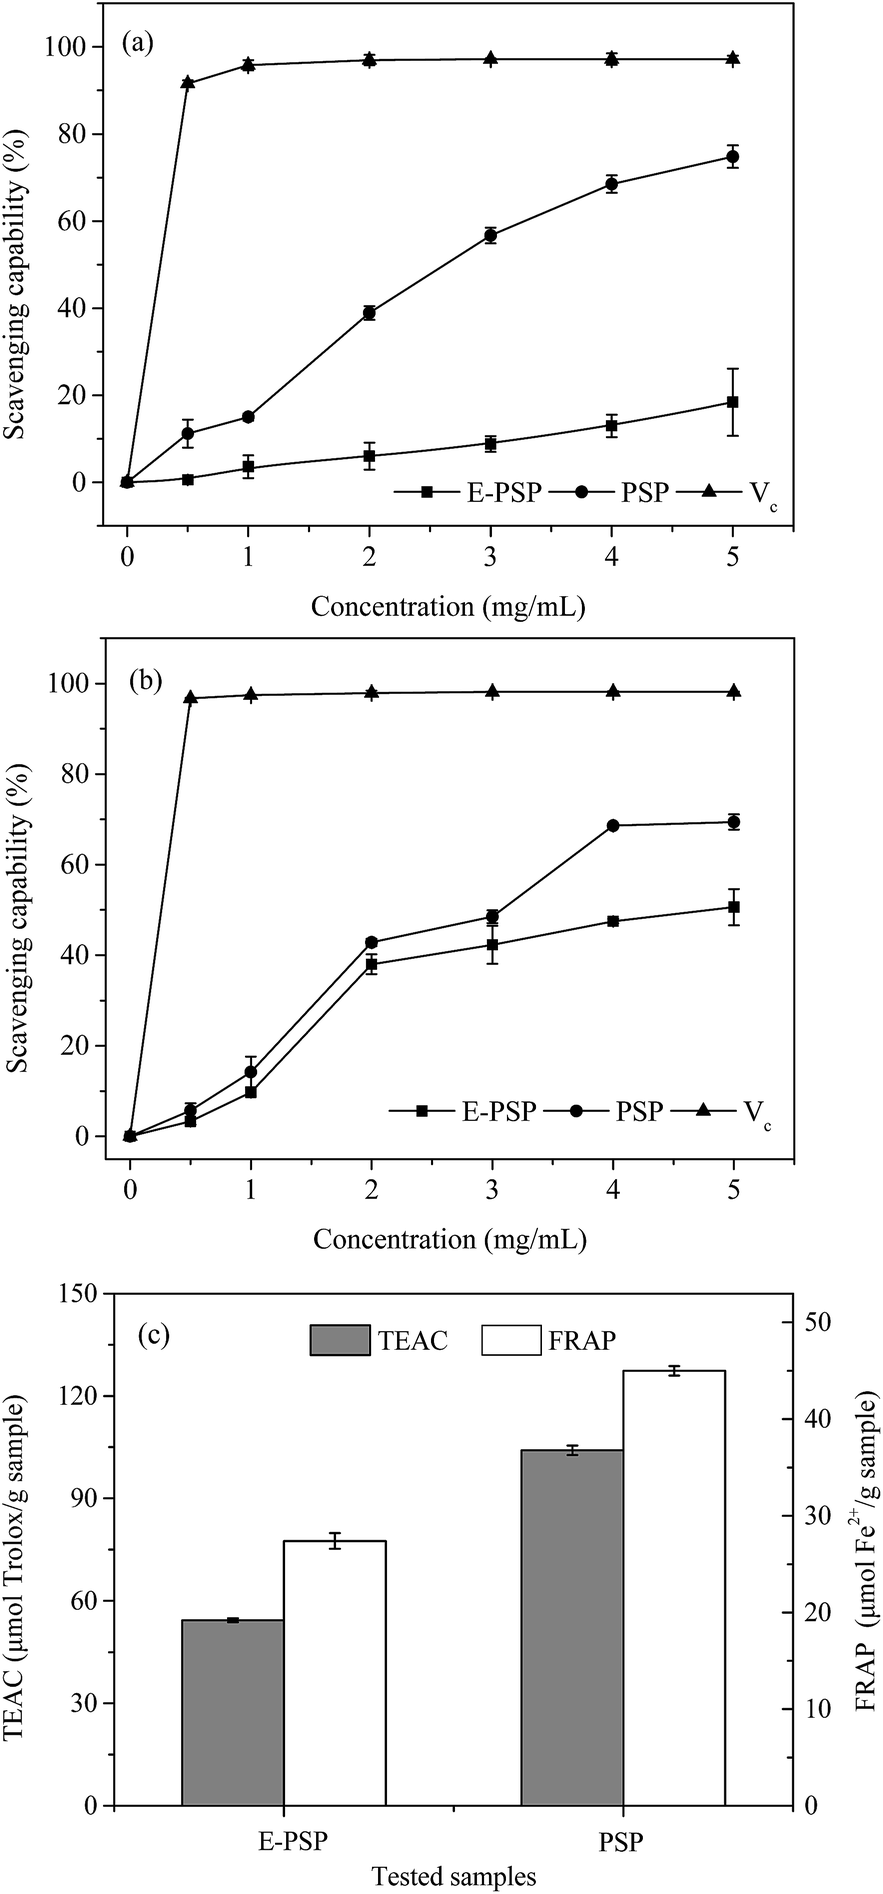 | ||
| Fig. 8 In vitro antioxidant activities of PSP and E-PSP in terms of (a) scavenging activity on DPPH radicals, (b) scavenging capacity on hydroxyl radicals, and (c) TEAC and FRAP assays. Each value is expressed as means ± SD (n = 3). | ||
Based on these results, both PSP and E-PSP possessed potential scavenging capacities on DPPH and hydroxyl free radicals and antioxidant activities (TEAC and FRAP assays). Moreover, the antioxidant activity of PSP was significantly stronger than that of E-PSP. Thus, the in vitro antioxidant activity of PSP from C. fluminea was enhanced after TPP. This may be attributed to the change of MWs during TPP process. PSP with lower MWs (61.5 kDa, 72.4%) exhibited stronger antioxidant capacities than that of E-PSP (248.4 kDa, 12.8%). Xing et al. reported that the radical scavenging activity of low-MW chitosan fractions (9 kDa) was significantly higher than that of high-MW fractions (760 kDa).37 These results indicated that MWs play an important role in anti-oxidation and radical scavenging capacities of PS. In addition, the antioxidant activity of the PSP may be related to carbohydrate content, monosaccharide composition, amino acid composition, chemical structure, and chain conformation.40 Therefore, TPP not only enhances the yield and purity of the PSP, but also reduces the MWs, resulting in an enhancement of antioxidant activities in vitro. Further investigations on the in vivo antioxidant activities and mechanisms of PSP are currently underway.
Conclusions
In summary, TPP was employed in this study to extract and separate PSP from C. fluminea. The highest extraction yield of PSP (9.0%) was obtained under the following optimized conditions: 20% (w/v) ammonium sulfate concentration, 1.5:1.0 t-butanol to crude extract ratio, 30 min, and 35 °C. The extraction yield of PSP was higher than that of E-PSP (7.6%) prepared through conventional enzyme extraction. After TPP was performed, the purified PSP contained an acidic proteoglycan with O-glycosylation and 81.7% carbohydrate mainly composed of D-Glc, D-GlcN, and D-Man with a molar ratio of 10.8:4.4:1.0, high MW of 2113.4 kDa (27.6%), and low MW of 61.5 kDa (72.4%). The purified PSP also exhibited strong radical scavenging capacities and antioxidant activities in vitro. Therefore, TPP as a novel, simple, and green bioseparation method can be explored as a promising technique to separate active PS or PSP from natural resources for food, cosmetic, and pharmaceutical industries.
Acknowledgements
This work was supported financially by the National Natural Science Foundation of China (31671812), the Natural Science Foundation of Jiangsu Province (BK20140542), the Priority Academic Program Development (PAPD) of Jiangsu Higher Education Institutions and Jiangsu Overseas Research & Training Program for University Prominent Young & Middle-aged Teachers and Presidents.References
- A. Lovegrove, C. H. Edwards, I. De Noni, H. Patel, S. N. Ei, T. Grassby, C. Zielke, M. Ulmius, L. Nilsson, P. J. Butterworth, P. R. Ellis and P. R. Shewry, Crit. Rev. Food Sci. Nutr., 2017, 57, 237 CrossRef CAS PubMed.
- V. E. C. Ooi and F. Liu, Curr. Med. Chem., 2000, 7, 715 CrossRef CAS PubMed.
- M. Zhang, S. W. Cui, P. C. K. Cheung and Q. Wang, Trends Food Sci. Technol., 2007, 18, 4–19 CrossRef CAS.
- C. Dennison and R. Lovrien, Protein Expression Purif., 1997, 11, 149 CrossRef CAS PubMed.
- Protein Purification: Micro to Macro, ed. R. Lovrien, C. Goldensoph, P. C. Anderson, B. Odegaard and R. Burgess, A.R. Liss, Inc., New York, 1987, p. 131 Search PubMed.
- I. Roy and M. N. Gupta, Anal. Chem., 2002, 300, 11 CAS.
- R. N. Pike and C. Dennison, Biotechnol. Bioeng., 1989, 33, 335 CrossRef PubMed.
- H. Bayraktar and S. Önal, Sep. Purif. Technol., 2013, 118, 835–841 CrossRef CAS.
- V. M. Kulkarni and V. K. Rathod, Biotechnology Reports, 2015, 6, 8 CrossRef.
- Z. Tan, Z. Yang, Y. Yi, H. Wang, W. Zhou, F. Li and C. Wang, Appl. Biochem. Biotechnol., 2016, 179, 1325 CrossRef CAS PubMed.
- S. Varakumar, K. V. Umesh and R. S. Singhal, Food Chem., 2017, 216, 27 CrossRef CAS PubMed.
- K. Mondal, A. Sharma and M. N. Gupta, Carbohydr. Polym., 2004, 56, 355 CrossRef CAS.
- A. Sharma, K. Mondal and M. N. Gupta, Carbohydr. Polym., 2003, 52, 433 CrossRef CAS.
- A. Sharma and M. N. Gupta, Carbohydr. Polym., 2002, 48, 391 CrossRef CAS.
- C. G. O. Coimbra, C. E. Lopes and G. M. T. Calazans, Bioresour. Technol., 2010, 101, 4725 CrossRef CAS PubMed.
- Z. J. Tan, C. Y. Wang, Y. J. Yi, H. Y. Wang, W. L. Zhou, S. Y. Tan and F. F. Li, Process Biochem., 2015, 50, 482 CrossRef CAS.
- C. F. Chen and C. S. Lin, Taiwanese J. Agric. Chem. Food Sci., 2003, 41, 159 Search PubMed.
- T. Chijimatsu, M. Umeki, Y. Okuda, K. Yamada, H. Oda and S. Mochizuki, Br. J. Nutr., 2011, 105, 526 CrossRef CAS PubMed.
- C. M. Lin, Y. L. Lin, N. M. Tsai, H. Y. Wu, S. Y. Ho, C. H. Chen, Y. K. Liu, Y. H. Chiu, L. P. Ho, R. P. Lee and K. W. Liao, J. Agric. Food Chem., 2012, 60, 4076 CrossRef CAS PubMed.
- J. S. Tsai, T. C. Lin, J. L. Chen and B. S. Pan, Process Biochem., 2006, 41, 2276 CrossRef CAS.
- N. Liao, S. Chen, X. Ye, J. Zhong, N. Wu, S. Dong, B. Yang and D. Liu, Food Funct., 2013, 4, 539 CAS.
- N. Liao, J. Zhong, X. Ye, S. Lu, W. Wang, R. Zhang, J. Xu, S. Chen and D. Liu, LWT--Food Sci. Technol., 2015, 60, 1113 CrossRef CAS.
- W. Zhu, Z. K. Lin, Z. J. Wu and Q. Y. Lin, J. Fish. Sci. China, 2004, 11, 349 CAS.
- M. Bradford, Anal. Biochem., 1976, 72, 248 CrossRef CAS PubMed.
- M. Dubois, K. A. Gilles, J. K. Hamilton, P. A. Rebers and F. Smith, Anal. Chem., 1956, 28, 350 CrossRef CAS.
- Z. B. Wang, J. J. Pei, H. L. Ma, P. F. Cai and J. K. Yan, Carbohydr. Polym., 2014, 109, 49 CrossRef CAS PubMed.
- S. Chen, K. C. Siu, W. Q. Wang, X. X. Liu and J. Y. Wu, Carbohydr. Polym., 2013, 94, 332 CrossRef CAS PubMed.
- P. H. Leung, S. N. Zhao, K. P. Ho and J. Y. Wu, Food Chem., 2009, 114, 1251 CrossRef CAS.
- A. V. Narayan, M. C. Madhusudhan and K. S. M. S. Raghavarao, Appl. Biochem. Biotechnol., 2008, 151, 263 CrossRef CAS PubMed.
- R. Dutta, U. Sarkar and A. Mukherjee, Ind. Crops Prod., 2015, 71, 89 CrossRef CAS.
- C. Dennison, Three-phase partitioning, in Methods in protein biochemistry, ed. H. Tschesche and W. de Gruyter, Berlin, Germany, 2011, p. 1 Search PubMed.
- S. M. Harde and R. S. Singhal, Sep. Purif. Technol., 2012, 96, 20 CrossRef CAS.
- S. Rajeeva and S. S. Lele, Biochem. Eng. J., 2011, 54, 103 CrossRef CAS.
- M. Gagaoua, N. Boucherba, A. Bouanane-Darenfed, F. Ziane, S. Nait-Rabah, K. Hafid and H. R. Boudechicha, Sep. Purif. Technol., 2014, 132, 461 CrossRef CAS.
- R. Garg and B. N. Thorat, Sep. Purif. Technol., 2014, 131, 19 CrossRef CAS.
- M. Kilcoyne, M. Shah, J. Q. Gerlach, V. Bhavanandan, V. Nagaraj, A. D. Smith, K. Fujiyama, U. Sommer, C. E. Costello, N. Olszewski and L. Joshi, J. Plant Physiol., 2009, 166, 219 CrossRef CAS PubMed.
- R. G. Xing, S. Liu, Z. Y. Guo and H. H. Yu, Bioorg. Med. Chem., 2005, 13, 1573 CrossRef CAS PubMed.
- M. Kačuráková, P. Capek, V. Sasinková, N. Wellner and A. Ebringerová, Carbohydr. Polym., 2000, 43, 195 CrossRef.
- V. Vrchovská, C. Sousa, P. Valentão, F. Ferreres, J. A. Pereira, R. M. Seabra and P. B. Andrade, Food Chem., 2006, 98, 416 CrossRef.
- L. M. Tian, Y. Zhao, C. Guo and X. B. Yang, Carbohydr. Polym., 2011, 83, 537 CrossRef CAS.
| This journal is © The Royal Society of Chemistry 2017 |