DOI:
10.1039/C6RA27400E
(Paper)
RSC Adv., 2017,
7, 6114-6122
Formation of cationic hydrophobic micro-blocks in P(AM-DMC) by template assembly: characterization and application in sludge dewatering†
Received
27th November 2016
, Accepted 9th January 2017
First published on 18th January 2017
Abstract
A template assembly method was introduced to obtain a cationic hydrophobic micro-block structure based amphiphilic electrolyte poly(acrylamide-co-2-methacryloxyethyltrimethyl ammonium chloride) P(AM-DMC) in this work, thereby increasing charge density and enhancing charge neutralization ability at the same charge density. The alteration of copolymerization or homo-polymerization was evaluated by the changes in reactivity ratios, so as to unravel the mechanism of template assembly. The micro-blocks generated by the new distribution of sequences were demonstrated by 1H nuclear magnetic resonance spectroscopy (1H NMR) and differential thermal-thermogravimetric analysis (DSC-TGA). Two negative controls were employed in sludge dewatering experiments to further evaluate the advanced properties of the template-assembled polymer. The results further verified that the positive effect of template assembly on flocculation performance of the polymer was achieved mainly through two ways: improving charge density and generating the micro-block structure. It can be concluded that the introduction of template assembly into polymerization can improve the performance of the polymer.
1. Introduction
In recent years, sludge treatment has become a focus due to its large yield and enormous pressure on the ecosystem.1–4 Sludge is a complex, negatively charged colloidal system and contains over 99% water. The problem of dehydration difficulties has become the bottleneck of sludge treatment.5–8 Hence, it is essential to pretreat the sludge with chemicals prior to mechanical dewatering.
It is well known that flocculation is the most commonly used and effective method to agglomerate sludge tiny flocs and improve sludge filterability.3,9,10 Polyelectrolyte is a water-soluble long-chain polymer with ionizable groups, in which polyacrylamide (PAM) and the derivatives appear to be ideal treatment agent in sewage and sludge flocculation process, especially the cationic PAM (CPAM).11,12 At present, CPAM research mainly focus on increasing cationic blocks under the condition of high intrinsic viscosity [η], which can be achieved through selecting a structurally superior cationic monomer and controlling the reactivity ratio. Generally, charge neutralization and bridging were considered to be the dominate flocculation mechanism.13–15 For the flocculation of negatively charged particles, the role of charge neutralization becames particularly important.16,17 The magnitude of the neutralization effect primarily depends on the charge density (CD). Notably, the sequence distribution of the polymer was also closely related to the charge neutralization capacity.18 Studies have shown that the introduction of the template exerted a certain effect on the radical polymerization, which was mainly reflected in the kinetics of the polymer (i.e., the reactivity ratio), the intrinsic viscosity [η], the tacticity or the sequence distribution.18–21 Template-assembled polymerization was defined as such an assembly process that the monomers interacted with a pre-set macromolecule (template) by electrostatic forces, hydrogen bonding and covalent bonds, which can be treated as a simple analogy model for this type of reaction such as DNA or RNA or certain enzymatic reactions, as showed in Fig. 1.20,22
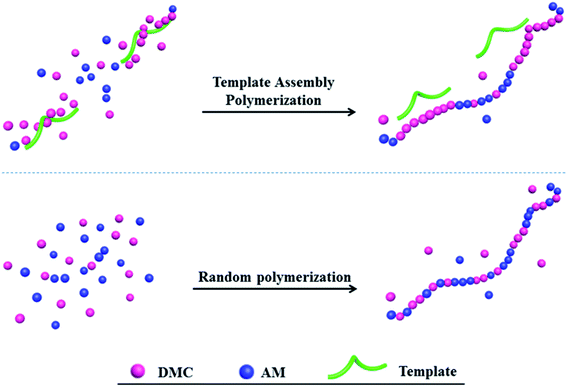 |
| | Fig. 1 Schematic of random copolymerization and template copolymerization. | |
To the best of our knowledge, acryloxyethyltrimethyl ammonium chloride (DAC) and (2-methacryloyloxyethyl) trimethyl ammonium chloride (DMC) are the most commonly used quaternary ammonium salt monomers.23 Comparing the structural formula, it is clear that DMC has an extra hydrophobic group (methyl) than DAC, and some researches confirmed that the extra methyl group could improve the flocculation properties of DMC.24–26 Therefore, DMC is considered as a more amphiphilic cationic monomer containing both hydrophobic groups (methyl and backbone) and hydrophilic groups (quaternary amines groups with permanently positive charges).27 Up to now, majority of researches has been on the preparation of flocculants with DMC, but few studies focused on the optimization of cationic monomers distribution under high intrinsic viscosity [η].15
Thus, the primary objectives of this study were to: (1) prepare micro-blocks based amphiphilic electrolyte poly(acrylamide-co-2-methacryloxyethyltrimethyl ammonium chloride) P(AM-DMC) with high intrinsic viscosity [η] and high charge density CD by template assembly, using AM and DMC as monomers, and sodium polyacrylate as template; (2) unravel the mechanism of template assembly by determining the reactivity ratio of monomers before and after the addition of template; (3) confirm the cationic micro-blocks structure of template-assembled polymers by 1H nuclear magnetic resonance spectroscopy (1H NMR) and differential thermal-thermogravimetric analysis (DSC-TGA); (4) evaluate the effect of micro-blocks structure and CD in the polymer on sludge dewatering performance by exploring their dosage-dependence, pH-dependence, sludge flocs morphology and sedimentation behaviors, and so forth.
2. Materials and methods
2.1. Reagents
Acrylamide (AM) and 2-methacryloxyethyltrimethyl ammonium chloride (DMC, 75 wt% in H2O) were purchased from Lanjie Tap Water Co., Ltd. (Chongqing, China). Sodium poly-acrylate (NaPAA, MW3000, Shandong Xintai Water Treatment Ltd.) was used as template. The photo-initiator 2,2′-azobis[2-(2-imidazolin-2-yl) propane] dihydrochloride (VA-044) was provided by Ruihong Biological Technology Co., Ltd. (Shanghai, China). Silver nitrate concentrate and Potassium dichromate were purchased from the Aladdin Reagent Network. HCl and NaOH were used to adjust the pH. All aqueous and standard solutions were prepared with deionized water. The purity of nitrogen gas was higher than 99.99%.
2.2. Preparation of copolymer
The synthesis reaction of the polymer was initiated by UV light (main radiation wavelength 300–400 nm; average irradiation intensity, 2000 μW cm−2). Setting the total monomer mass concentration as 30%, a certain amount of monomers (AM and DMC), template NaPAA and photo-initiator VA-044 were dissolved in quartz reaction vessel by deionized water. The reaction vessel was purged with nitrogen for 30 min to remove oxygen completely. Afterwards, it was exposed to a high pressure mercury lamp for 60 min to initiate the reaction, then aged for 2 hours to complete the subsequent radical reaction. The gel-like product was dissolved in deionized water (1![[thin space (1/6-em)]](https://www.rsc.org/images/entities/char_2009.gif) :
:![[thin space (1/6-em)]](https://www.rsc.org/images/entities/char_2009.gif) 10; V/V) with the pH of the colloidal system adjusted, and then was washed 3 times with acetone and ethanol respectively, to obtain white extract. Finally, the product poly(acrylamide-co-2-methacryloxyethyltrimethyl ammonium chloride) P(AM-DMC) was granulated, and dried in a vacuum oven at 40 °C for further use.
10; V/V) with the pH of the colloidal system adjusted, and then was washed 3 times with acetone and ethanol respectively, to obtain white extract. Finally, the product poly(acrylamide-co-2-methacryloxyethyltrimethyl ammonium chloride) P(AM-DMC) was granulated, and dried in a vacuum oven at 40 °C for further use.
2.3. Determination of reactivity ratio
The reactivity ratio, one of the most important parameters related to the relative monomer activity, is calculated on the basis of the ratio of the homo-polymerization rate constant and the copolymerization rate constant of the monomer in the binary copolymerization.28 The molar ratio of AM to DMC in the copolymer (i.e., charge density CD) was determined by silver nitrate titration29 and the details were placed in the ESI.† The reactivity ratio of copolymer was determined by Kelen–Tüdös method, and the equation was represented in eqn (1).25,30| |
 | (1) |
where  ,
,  and δ = (Hmax × Hmin)1/2;
  and
and  ;
;  and
and  , R is the feed molar ratio of AM and DMC, and ρ is the molar ratios of AM and DMC in the polymer at low conversion; f is the molar mass fraction of DMC in the feed, and F is the molar mass fraction of DMC in the polymer. After the η and ξ of each point were obtained, the linear fitting curve relating to η and ξ can be plotted, and the rAM and rDMC can be obtained through the slope and intercept of straight line.
2.4. Characterization methods
The dried sample was ground to fine powder for subsequent characterization. The intrinsic viscosity [η] of polymerization was determined by Ubbelohde viscosity meter (Shanghai, China). FTIR samples were prepared as KBr pellets for infrared spectroscopy measuring in the range of 4000–400 cm−1, which was analyzed using a infrared spectrometer (550 Series II, MettlerToledo, Greifensee, Switzerland). 1H NMR spectra were recorded on spectrometer (AVANCE-500, Bruker Company, Karlsruhe, Germany) with deuterium oxide (D2O) as solvent. DSC-DTA was conducted by a synchronal thermal analyzer (DTG-60H, Shimadzu, Kyoto, Japan) to examine the thermal stability of copolymers from Ambient temperature to 600 °C.
2.5. Dewatering experiments
Raw sludge was obtained from Jiguanshi Sewage Treatment Plant in Chongqing. The characteristics of the sludge were listed in Table 1. Buchner-funnel filtration was used in the sludge dewatering. The main index used to indicate sludge conditioning efficiency were specific resistance to filtration (SRF), ζ-potential, floc size and settling rate. In dewatering experiment, an aliquot of 100 mL raw sludge was placed into 500 mL beaker followed with flocculants added. Afterwards, the mixing procedure was conducted by a program-controlled jar test apparatus (ZR4-6, Zhongrun, China): rapidly stirred 30 s at a speed of 200 rpm and then stirred 60 s at a speed of 50 rpm. The pH was adjusted with 1.0 M NaOH solution and 1.0 M HCl solution. The ζ-potential and floc size distribution were measured by ZS90 Malvern potential analyzer (Malvern Instruments Ltd., UK) and a laser diffraction instrument (Mastersizer2000, Malvern, U.K.), respectively. The SRF was determined by the following equation.1,2,31| |
 | (2) |
where P is the filtration pressure (N m−2), A is the filtration area (m2), and μ is dynamic viscosity coefficient (N s m−2), b is the slope calculated from the plot of t/Vf(y) − Vf(x), where Vf is the volume of filtrate (m3) and t is the filtration time (s). c is the weight of solids per unit filtrate volume (kg m−3),  , where ci is the initial moisture content (%) and cf is the final moisture content (%).
Table 1 Characteristics of sludge
| Indicator |
pH |
SRF (×1012 m kg) |
ζ-Potential (mV) |
Moisture content (wt%) |
VSS/TSS |
| Value |
6.81 ± 0.1 |
16.1 |
−24.9 ± 0.2 |
98.8% |
0.72 |
3. Results and discussion
3.1. Property comparison of TPA-D and PA-D at different fDMC
The parameters used to study the properties of the polymers were the molar ratio of template and DMC monomers (T/D), and the molar mass fraction of DMC monomer in the total monomer content (fDMC). As shown in Table 2, CD values of the template-assembled polymers series (TPA-D) were clearly higher than the random polymer series (PA-D) under identical synthetic conditions with other parameters. This is because the template may channel the trajectory of the cationic monomers in the free radical polymerization process, thereby improving the polymerization efficiency to a certain extent.18,19 In general, the activity of DMC monomer is lower than that of AM, so the higher the DMC monomer content, the lower the overall activity of the polymerization reaction system is. This could explain why intrinsic viscosity [η] was decreasing with the increase of fDMC. In addition, judging from the results of CD under different fDMC, it was worth noting that the assembly effect of template on DMC monomers was first enhanced and then weakened, which was the strongest in the range of 20–30%. Since the templates were oligomeric macromolecules, excessive presence in the reaction system may form some spatial resistance, and accelerate the chain transfer and chain termination effects.22
Table 2 Comparison of intrinsic viscosity [η] and CD of TPA-D and PA-D at different fDMC
| fDMC (%) |
Abbreviation |
T/D |
Intrinsic viscosity (dL g−1) |
CD (%) |
| 10 |
PA-D1 |
0 |
11.02 |
4.35 |
| 10 |
TPA-D1 |
1.0 |
10.90 |
7.95 |
| 20 |
PA-D2 |
0 |
10.35 |
10.28 |
| 20 |
TPA-D2 |
1.0 |
10.31 |
18.07 |
| 30 |
PA-D3 |
0 |
10.83 |
17.65 |
| 30 |
TPA-D3 |
1.0 |
10.23 |
27.39 |
| 40 |
PA-D4 |
0 |
9.51 |
23.89 |
| 40 |
TPA-D4 |
1.0 |
8.41 |
37.81 |
| 50 |
PA-D5 |
0 |
8.34 |
31.67 |
| 50 |
TPA-D5 |
1.0 |
7.41 |
43.97 |
3.2. Effect of template on the reactivity ratio
The relevant data for the reactivity ratio by the Kelen–Tüdös method were placed in Tables S1 and S2,† respectively, and the linear fit data are plotted in Fig. 2. It is noteworthy that the accurate determination of the copolymer composition (i.e., the determination of CD) is critical to the estimation of the monomer reactivity ratio, and CD values were also expressed as the FDMC values in Tables S1 and S2.† Furthermore, the reactivity ratios for AM and DMC monomers (i.e., rAM and rDMC) showed a significant change, as listed in Table 3. Generally, AM monomers tend to homo-polymerization (i.e., rAM > 1) in the polymerization reaction, while DMC monomers tend to copolymerize (i.e., rDMC < 1).14 After the addition of the template, the value of rAM was reduced, while the rDMC increased more close to 1, which means that both the copolymerization of AM monomers and the homo-polymerization of DMC monomers were enhanced. Thus, the changes in rAM and rDMC caused a new distribution of the polymer sequence, in particular the distribution of cationic sequences, and facilitated the formation of the micro-blocks.
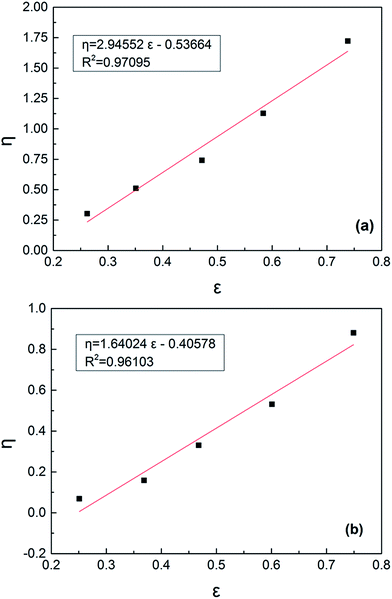 |
| | Fig. 2 Kelen–Tüdös figure of AM and DMC reactivity ratio under (a) T/D = 0 and (b) T/D = 1.0. | |
Table 3 Results of reactivity ratios by Kelen–Tüdös method under T/D = 0 and T/D = 1.0
| Conditions |
rAM |
rDMC |
| T/D = 0 |
2.4089 |
0.7012 |
| T/D = 1.0 |
1.5997 |
0.9508 |
3.3. Characterization
3.3.1. FTIR spectra. Fig. 3 shows that the possible functional groups in PA-D2, TPA-D2, PA-D5 and TPA-D5 were characterized by FT-IR. The broad characteristic absorption peaks around 3436.53 cm−1 was assigned to the stretching vibration of –NH2 groups in the AM units. The adsorption peaks around 1133.94, 1661.86 and 2939.47 cm−1 were attributed to –C–O–C–, –C![[double bond, length as m-dash]](https://www.rsc.org/images/entities/char_e001.gif) O and –CH3 asymmetric stretching vibration respectively.22,32 The band in the vicinity of 954.59 cm−1 in spectra was assigned to the characteristic absorption of N+ (CH3)3.25 What should not be overlooked was the intensity differences in the quaternary ammonium salt peak between template-assembled polymers and random polymers under the same fDMC. The differences may be related to the increase of DMC monomers homo-polymerization in the presence of the template. In brief, the aforementioned characteristic peaks indicated that the product was a copolymer of AM and DMC monomers.
O and –CH3 asymmetric stretching vibration respectively.22,32 The band in the vicinity of 954.59 cm−1 in spectra was assigned to the characteristic absorption of N+ (CH3)3.25 What should not be overlooked was the intensity differences in the quaternary ammonium salt peak between template-assembled polymers and random polymers under the same fDMC. The differences may be related to the increase of DMC monomers homo-polymerization in the presence of the template. In brief, the aforementioned characteristic peaks indicated that the product was a copolymer of AM and DMC monomers.
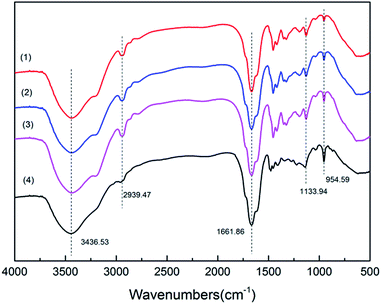 |
| | Fig. 3 Comparison of FITR spectra for (1) PA-D2, (2) TPA-D2, (3) PA-D5 and (4) TPA-D5. | |
3.3.2. 1H NMR spectra. The 1H NMR spectra depicted in Fig. 4 further confirmed the effect of template on the formation of micro-blocks structure in the copolymer. The 1H NMR curves exhibited similar vibration peaks, but the difference of proton characteristic peak intensities cannot be neglected. The asymmetric peaks at Ha1 proton (1.628 ppm) and Hb proton (2.191 ppm) were derived from the resonances of methylene (–CH2–) and methine (–CH–) protons in AM monomers.33 Relatively, the asymmetric peaks of methylene (–CH2–) groups in DMC monomers were shifted to Ha2 proton (1.745 ppm). Besides, Hc proton (1.159 ppm), Hd proton (4.497 ppm), He proton (3.723 ppm), Hf proton (3.208 ppm) were assigned to protons of –CH3, –O–CH2–, –CH2–N+–, and –N+–(CH3)3 in DMC monomers, respectively.11,25 Slightly different phenomenon can be observed that the proton characteristic signal intensity of –N+–(CH3)3, –CH2–N+– and –CH3 in template-assembled polymers TPA-D2 and TPA-D5 was stronger than random polymers PA-D2 and PA-D5, correspondingly and respectively. The differences in peak intensities were closely related to the differences in polymer composition, such as FDMC, thereby leading to the difference in flocculation performance of the polymer. Notably, there are two new peaks surrounded by an elliptical circle in the 1H NMR spectra of TPA-D2 and TPA-D5, which was believed to correlate with the stereo-complexes and micro-blocks of the copolymer, and was reflected in the subsequent sludge dewatering performance.18,20 According to this phenomenon, it can be concluded that several cationic micro-block structures did exist in the template-assembled polymer. Thence, the comparative analysis of 1H NMR spectra further confirmed the formation of the micro-block structure in the template-assembled polymers.
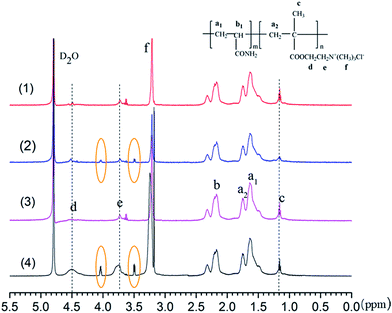 |
| | Fig. 4 Comparison of 1H NMR spectra for (1) PA-D2, (2) TPA-D2, (3) PA-D5 and (4) TPA-D5. | |
3.3.3. DSC-DTA analysis. The thermal stability of the synthesized polymers was analyzed by TGA and DSC. As depicted in Fig. 5a, the four polymers showed three weight loss stages, but the weight loss rate was distinct at the parallel temperature. The first stage of decomposition occurs in the range of 30–231.25 °C for TPA-D2, PA-D2, TPA-D5, but 30–216.33 °C for PA-D5, which can be attributed to the evaporation of intra and intermolecular moisture adsorbed by strong hydrophilic groups in the polymer.22 Therefore, the temperature T0 should be regarded as the true starting point of polymer decomposition, and the decomposition point T02 (216.33 °C) for PA-D5 was lower than T01 (231.25 °C) for TPA-D2, PA-D2, TPA-D5. Moreover, at any temperature in the decomposition stage after T0, the weight loss rate of PA-D5 was the largest, TPA-D2 was the smallest, PA-D2 and TPA-D5 were similar and in the middle. This is because the thermal stability of DMC monomers was relatively poor to AM monomers, and the micro-blocks forced the polymer to be more thermally stable.22,34 Similarly, as it can be seen from the DSC analysis (Fig. 5b), the greater the weight loss rate, the more the endothermic amount of polymer; in addition, a weak absorption peak appeared at about 400 °C in the third weight-loss stage of the template-assembled polymer TPA-D2 and TPA-D5, which may be related to the existence of micro-blocks, and reflected in the subsequent sludge dewatering performance.
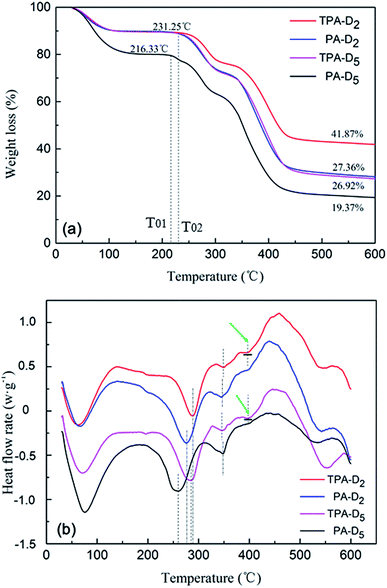 |
| | Fig. 5 Comparison of (a) TGA and (b) DSC for PA-D2, TPA-D2, PA-D5 and TPA-D5. | |
3.4. Dewatering performance
Some external factors can greatly affect the flocculation performance of flocculants, in particular, the dosage and the pH of the application system.35 Herein, the sludge dewatering experiments mainly focused on investigating the influence of the dosage and pH, and taking the SRF and ξ-potential as the main index. The random polymer PA-D2 (with same feed ratio fDMC as TPA-D2) and PA-D3 (similar monomer composition ratio FDMC) were selected for application in sludge dewatering. The intrinsic viscosity [η] and CD of flocculants TPA-D2, PA-D3 and PA-D2 were 10.31 dL g−1, 18.07%; 10.83 dL g−1, 17.65% and 10.35 dL g−1, 10.28%, respectively, as shown in Table 2. Schematic of flocculation process comparison for template-assembled polymer and random polymer was shown in Fig. 6.
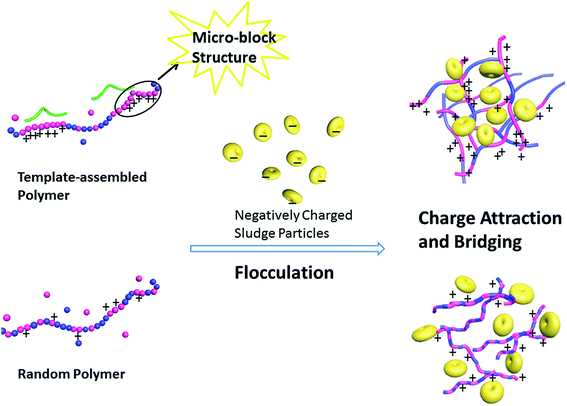 |
| | Fig. 6 Schematic of flocculation comparison for template-assembled polymer and random polymer. | |
3.4.1. Dosage dependence. The dosage-dependence on sludge dewatering performance of the template-assembled polymer TPA-D2 and the random polymers PA-D3 and PA-D2 was depicted in Fig. 7. According to the value of SRF, sludge dehydration performance can be divided into three grades: bad dewaterability (>10 × 1012 m kg−1), medium dewaterability (5–9 × 10¹² m kg−1) and good dewaterability (<4 × 10¹² m kg−1).36 Fig. 7a shows that, when the dosage ≥40 mg L−1, the SRF of sludge treated with TPA-D2 and PA-D3 obtained good dewaterability for the intrinsic viscosity and CD were quite close and relatively ideal. The optimum dosage and the optimal sludge SRF of TPA-D2 was nearby 40 mg L−1 and 1.69 × 10¹² m kg−1 respectively, while that for PA-D3 was 50 mg L−1 and 2.06 × 10¹² m kg−1, displayed slightly difference. In contrast, sludge dewatering performance for PA-D2 was worse than that for TPA-D2 and PA-D3, the optimum sludge SRF only achieved 3.36 × 10¹² m kg−1 with the dosage of 50 mg L−1. It was obvious that due to the higher CD value at similar intrinsic viscosities, TPA-D2 and PA-D3 exhibited much better flocculation efficiency than PA-D2. Notably, template-assembled polymer TPA-D2 showed slightly better flocculation performance than random polymer PA-D3 at same intrinsic viscosities and CD value, for the presence of cationic hydrophobic micro-blocks strengthened the charge neutralization and hydrophobicity of TPA-D2.26 Overall, the three flocculants decreased rapidly with the increase of the dosage and then slightly increased. When the dosage exceeds the optimal dosage to a certain range, the opposite situation occurs, that is, the deterioration trend on sludge dewatering effect for polymer TPA-D2 was more obvious, which can be attributed to the stronger electrostatic repulsion caused by the re-take positively charged sludge.30 The curve shown in Fig. 7b reveals that the sludge system with TPA-D2 added showed higher ζ-potential and achieved the isoelectric point at smaller dosage of 40 mg·L−1, which indicated that TPA-D2 has stronger charge neutralization than PA-D3 and PA-D2. It was well known that the destabilized colloids system exhibited stronger charge neutralization at the isoelectric point.33 Taken together, the results suggested that both the presence of cationic hydrophobic micro-blocks at same intrinsic viscosities and CD, and the higher CD value at same feed ratio fDMC enhanced the charge neutralization and hydrophobicity ability of template-assembled polymer.
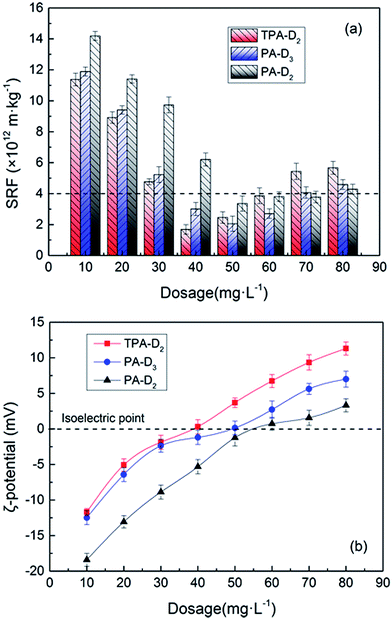 |
| | Fig. 7 Dosage dependence of TPA-D2, PA-D3 and PA-D2 on the (a) SRF and (b) ζ-potential. | |
3.4.2. pH dependence. The pH of the system could exert a great influence on the flocculation performance of the polymers and caused the ζ-potential to change greatly. Some researches have shown that the effect of pH on the sludge dewatering may be related to the breakage of polymeric matrix extracellular polymeric substances, which accounts for nearly 60–80% of total sludge mass and significantly affect the surface chargeability, floc stability and rheological behavior of sludge.6,37,38 Herein, the dosage of three flocculants was fixed as 50 mg L−1. As shown in Fig. 8a, it was obvious that the SRF of the treated sludge decreased drastically at the point of pH = 2. It was confirmed that the extracellular polymeric substances was decomposed when the acidity was close to 2, and released a large amount of bound water that difficult to remove.39 Overall, the SRF of sludge decreased sharply with the increase of pH, then rapidly increased, and be the lowest in the neutral and weakly acidic conditions. This phenomenon was related to the changes in the ionization degree of the ionic group in quaternary ammonium salt11 and the sludge flocs surface properties. The pH range of relatively optimal flocculation effects for template-assembled polymer TPA-D2 was 4–8, whereas that for the random polymer PA-D3 and PA-D2 was 5–7 and 6–7, respectively. Correspondingly, as shown in Fig. 8b, the ζ-potential of TPA-D2 under weak acid weak base and neutral conditions was closer to the isoelectric point, while the random polymer PA-D3 and PA-D2 achieved that only under weak acid and neutral conditions. Thence, it can be concluded that the formation of micro-blocks structure allows the polymer to have better pH adaptability.
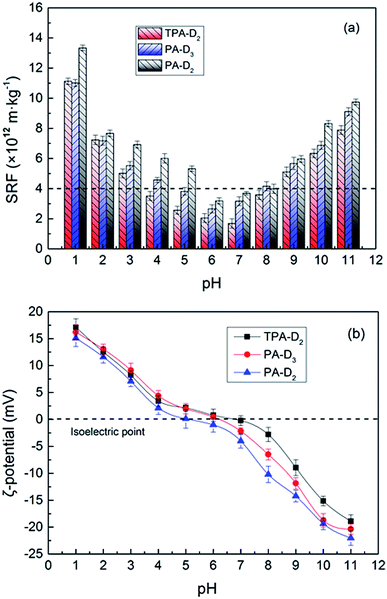 |
| | Fig. 8 pH dependence of TPA-D2, PA-D3 and PA-D2 on the (a) SFR and (b) ζ-potential. | |
3.4.3. Flocs performance and sedimentation. To examine the effect of micro-blocks and charge density CD on flocculation performance, the flocs characteristics including floc size distribution, morphology and sedimentation behavior of the sludge treated with different flocculants were comparative investigated. Fix dosage as 50 mg L−1and the pH as the natural pH of raw sludge. Fig. 9 shows that the size value d10, d50 and d90 of the flocs treated with TPA-D2 were larger than that with PA-D3 and PA-D2, and the size distribution narrower and more concentrated. As shown in Fig. S2,† TPA-D2-treated sludge flocs were tightly connected and stacked, large and densely granulated and with many large voids on the surface of the flocs. Whereas PA-D3-treated sludge flocs were relatively loose, and the supernatant was turbid. In contrast, PA-D2-treated sludge flocs exhibited coarse-grained morphology, and granulated loosely and uniformly. The sludge flocs were further observed and compared by optical microscope images, and the results were shown as the embedded graph in Fig. 9 and S2,† respectively. The sedimentation behavior of sludge was closely related to sludge-water separation performance, which was depend upon the structure of sludge flocs including particle size, floc density, and forth on.30 The sedimentation behavior of the sludge flocs with time was plotted in Fig. 10. Herein, the rate of sludge-water interfacial height variation over time in 10 min was assumed to be the sludge sedimentation rate. It can be estimated that the sedimentation rate of TPA-D2-treated sludge was 1.509 min−1, while that of PA-D3-treated sludge and PA-D2-treated sludge was 1.357 cm min−1 and 1.063 cm min−1, respectively. Based on the findings discussed above, it can be concluded that the combined effect of the compact structure and large size of the sludge floc effectively improved the sedimentation property.
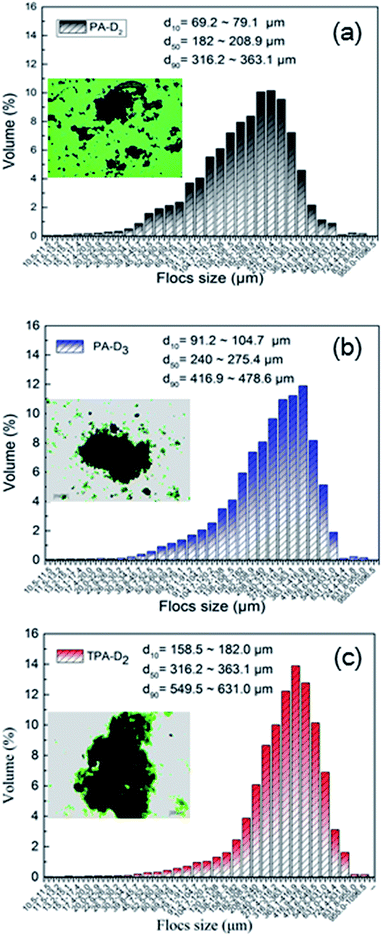 |
| | Fig. 9 Size distribution and morphology of sludge flocs treated with (a) PA-D2, (b) PA-D3 and (c) TPA-D2. | |
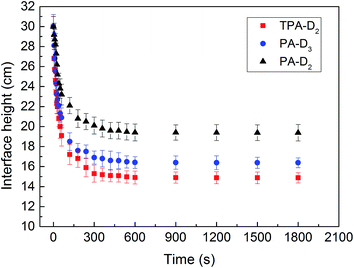 |
| | Fig. 10 Comparison of sedimentation behavior of sludge flocs. | |
4. Conclusions
An amphiphilic electrolyte P(AM-DMC) with cationic hydrophobic micro-blocks structure was synthesized by template assembly method. The micro-blocks were generated by the new distribution of sequence in the presence of template, and closely related to the changes of the reactivity ratio (rAM and rDMC). The micro-blocks were confirmed by 1H NMR and DSC-TGA analysis. Compared with random polymer PA-D3 and PA-D2, template-assembled polymer TPA-D2 showed a relative superiority in the sludge dewatering due to its lower optimum dosage, wider pH adaptation range, and TPA-D2-treated sludge flocs were more compact, larger and settling faster. The optimum SRF values of sludge treated with TPA-D2 reached nearly 1.69 × 10¹² m·kg−1 under the conditions of a lower dosage 40 mg L−1, and the pH application range was 4–8. All the results indicated that the existence of template did play a role of molecular assembly in the radical polymerization, and the cationic hydrophobic micro-blocks in the polymer slightly improved the sludge dehydration performance.
Acknowledgements
The authors gratefully acknowledge the financial support of the National Natural Science Foundation of China (Project No. 21677020 and No. 21477010).
References
- Z. Zhang, S. Xia and J. Zhang, Water Res., 2010, 44, 3087–3092 CrossRef CAS PubMed.
- Y. Qi, K. B. Thapa and A. F. A. Hoadley, Chem. Eng. J., 2011, 171, 373–384 CrossRef CAS.
- Q. Lin, H. Peng, S. Zhong and J. Xiang, J. Hazard. Mater., 2015, 285, 199–206 CrossRef CAS PubMed.
- X. Z. Meng, A. K. Venkatesan, Y. L. Ni, J. C. Steele, L. L. Wu, A. Bignert, A. Bergman and R. U. Halden, Environ. Sci. Technol., 2016, 50, 5454–5466 CrossRef CAS PubMed.
- G. H. Yu, P. J. He, L. M. Shao and P. P. He, Environ. Sci. Technol., 2008, 42, 7944–7949 CrossRef CAS PubMed.
- Z. Chen, W. Zhang, D. Wang, T. Ma, R. Bai and D. Yu, Water Res., 2016, 103, 170–181 CrossRef CAS PubMed.
- M. S. Kim, K. M. Lee, H. E. Kim, H. J. Lee, C. Lee and C. Lee, Environ. Sci. Technol., 2016, 50, 7106–7115 CrossRef CAS PubMed.
- K. Xiao, Y. Chen, X. Jiang, V. K. Tyagi and Y. Zhou, Water Res., 2016, 105, 470–478 CrossRef CAS PubMed.
- S. Bratskaya, S. Schwarz and D. Chervonetsky, Water Res., 2004, 38, 2955–2961 CrossRef CAS PubMed.
- G. V. Franks, J. Colloid Interface Sci., 2005, 292, 598–603 CrossRef CAS PubMed.
- D. Chen, X. Liu, Y. Yue, W. Zhang and P. Wang, Eur. Polym. J., 2006, 42, 1284–1297 CrossRef CAS.
- W. L. Yan, Y. L. Wang and Y. J. Chen, Water Res., 2013, 47, 6445–6456 CrossRef CAS PubMed.
- R. Hogg, J. Colloid Interface Sci., 1984, 102, 232–236 CrossRef CAS.
- D. K. S. L. Besra, S. K. Roy and P. Ay, Int. J. Miner. Process., 2002, 66, 183–202 CrossRef.
- Z. Yang, J. R. Degorce-Dumas, H. Yang, E. Guibal, A. Li and R. Cheng, Environ. Sci. Technol., 2014, 48, 6867–6873 CrossRef CAS PubMed.
- J. Kleimann, C. Gehin-Delva, H. Auweter and M. Borkovec, Langmuir, 2005, 21, 3688–3698 CrossRef CAS PubMed.
- Y. Zhou and G. V. Franks, Langmuir, 2006, 22, 6775–6786 CrossRef CAS PubMed.
- H. L. Frisch and Q. H. Xu, Macromolecules, 1992, 25, 5145–5149 CrossRef CAS.
- I. Rainaldi, C. Cristallini, G. Ciardelli and P. Giusti, Macromol. Chem. Phys., 2000, 201, 2424–2431 CrossRef CAS.
- S. Polowiński, Prog. Polym. Sci., 2002, 27, 537–577 CrossRef.
- Y. X. Zhang, F. P. Wu, M. Z. Li and E. J. Wang, J. Phys. Chem. B, 2005, 109, 22250–22255 CrossRef CAS PubMed.
- Q. Q. Guan, H. L. Zheng, J. Zhai, C. Zhao, X. Zheng, X. Tang, W. Chen and Y. J. Sun, Ind. Eng. Chem. Res., 2014, 53, 5624–5635 CrossRef CAS.
- D. Cuccato, G. Storti and M. Morbidelli, Macromolecules, 2015, 48, 5076–5087 CrossRef CAS.
- H. Ren, W. Chen, Y. Zheng and Z. Luan, React. Funct. Polym., 2007, 67, 601–608 CrossRef CAS.
- Z. Abdollahi, M. Frounchi and S. Dadbin, J. Ind. Eng. Chem., 2011, 17, 580–586 CrossRef CAS.
- T. Lü, X. Liu, D. Qi and H. Zhao, Iran. Polym. J., 2015, 24, 219–227 CrossRef.
- J. J. Shen, L. L. Ren and Y. Y. Zhuang, J. Hazard. Mater., 2006, 136, 809–815 CrossRef CAS PubMed.
- D. Arunbabu, Z. Sanga, K. M. Seenimeera and T. Jana, Polym. Int., 2009, 58, 88–96 CrossRef CAS.
- J. P. Wang, Y. Z. Chen, Y. Wang, S. J. Yuan, G. P. Sheng and H. Q. Yu, RSC Adv., 2012, 2, 494–500 RSC.
- W. Chen, H. L. Zheng, Q. Q. Guan, H. Teng, C. L. Zhao and C. Zhao, Ind. Eng. Chem. Res., 2016, 55, 2892–2902 CrossRef CAS.
- J. P. Wang, S. J. Yuan, Y. Wang and H. Q. Yu, Water Res., 2013, 47, 2643–2648 CrossRef CAS PubMed.
- Y. Liao, H. L. Zheng, L. Qian, Y. J. Sun, L. Dai and W. W. Xue, Ind. Eng. Chem. Res., 2014, 53, 11193–11203 CrossRef CAS.
- H. L. Zheng, J. Y. Ma, C. Zhu, Z. Zhang, L. Liu, Y. Sun and X. Tang, Sep. Purif. Technol., 2014, 123, 35–44 CrossRef CAS.
- J. A. Mapkar, G. Iyer and M. R. Coleman, Appl. Surf. Sci., 2009, 255, 4806–4813 CrossRef CAS.
- R. Rojas-Reyna, S. Schwarz, G. Heinrich, G. Petzold, S. Schütze and J. Bohrisch, Carbohydr. Polym., 2010, 81, 317–322 CrossRef CAS.
- Z. Chen, W. J. Zhang, D. S. Wang, T. Ma and R. Y. Bai, Water Res., 2015, 83, 367–376 CrossRef CAS PubMed.
- M. Raynaud, J. Vaxelaire, J. Olivier, E. Dieude-Fauvel and J. C. Baudez, Water Res., 2012, 46, 4448–4456 CrossRef CAS PubMed.
- P. Zhang, Y. P. Chen, J. S. Guo, Y. Shen, J. X. Yang, F. Fang, C. Li, X. Gao and G. X. Wang, Water Res., 2014, 57, 31–39 CrossRef CAS PubMed.
- Y. G. Chen, H. Z. Yang and G. W. Gu, Water Res., 2001, 35, 2615–2620 CrossRef CAS PubMed.
Footnote |
| † Electronic supplementary information (ESI) available. See DOI: 10.1039/c6ra27400e |
|
| This journal is © The Royal Society of Chemistry 2017 |
Click here to see how this site uses Cookies. View our privacy policy here.  Open Access Article
 ab,
Huaili Zheng*ab,
Xiangrui Dengab,
Bincheng Xuab,
Yongjun Sunc,
Yongzhi Liuab and
Jianjun Liangab
![[thin space (1/6-em)]](https://www.rsc.org/images/entities/char_2009.gif) :
:![[thin space (1/6-em)]](https://www.rsc.org/images/entities/char_2009.gif) 10; V/V) with the pH of the colloidal system adjusted, and then was washed 3 times with acetone and ethanol respectively, to obtain white extract. Finally, the product poly(acrylamide-co-2-methacryloxyethyltrimethyl ammonium chloride) P(AM-DMC) was granulated, and dried in a vacuum oven at 40 °C for further use.
10; V/V) with the pH of the colloidal system adjusted, and then was washed 3 times with acetone and ethanol respectively, to obtain white extract. Finally, the product poly(acrylamide-co-2-methacryloxyethyltrimethyl ammonium chloride) P(AM-DMC) was granulated, and dried in a vacuum oven at 40 °C for further use.

 ,
,  and δ = (Hmax × Hmin)1/2;
  and
and  ;
;  and
and  , R is the feed molar ratio of AM and DMC, and ρ is the molar ratios of AM and DMC in the polymer at low conversion; f is the molar mass fraction of DMC in the feed, and F is the molar mass fraction of DMC in the polymer. After the η and ξ of each point were obtained, the linear fitting curve relating to η and ξ can be plotted, and the rAM and rDMC can be obtained through the slope and intercept of straight line.

 , where ci is the initial moisture content (%) and cf is the final moisture content (%).
![[double bond, length as m-dash]](https://www.rsc.org/images/entities/char_e001.gif) O and –CH3 asymmetric stretching vibration respectively.22,32 The band in the vicinity of 954.59 cm−1 in spectra was assigned to the characteristic absorption of N+ (CH3)3.25 What should not be overlooked was the intensity differences in the quaternary ammonium salt peak between template-assembled polymers and random polymers under the same fDMC. The differences may be related to the increase of DMC monomers homo-polymerization in the presence of the template. In brief, the aforementioned characteristic peaks indicated that the product was a copolymer of AM and DMC monomers.
O and –CH3 asymmetric stretching vibration respectively.22,32 The band in the vicinity of 954.59 cm−1 in spectra was assigned to the characteristic absorption of N+ (CH3)3.25 What should not be overlooked was the intensity differences in the quaternary ammonium salt peak between template-assembled polymers and random polymers under the same fDMC. The differences may be related to the increase of DMC monomers homo-polymerization in the presence of the template. In brief, the aforementioned characteristic peaks indicated that the product was a copolymer of AM and DMC monomers.


