
 Open Access Article
 This Open Access Article is licensed under a
 Creative Commons Attribution 3.0 Unported Licence
Electrospun tungsten trioxide nanofibers decorated with palladium oxide nanoparticles exhibiting enhanced photocatalytic activity†
Hoik Leea,
Myungwoong Kimb,
Daewon Sohnc,
Seong Hun Kimd,
Seong-Geun Ohe,
Seung Soon Im*f and
Ick Soo Kim*a
aNano Fusion Technology Research Lab, Division, of Frontier Fibers, Institute for Fiber Engineering (IFES), Interdisciplinary Cluster for Cutting Edge Research, (ICCER), Shinshu University, 3-15-1, Tokida, Ueda, Nagano 386-8567, Japan. E-mail: kim@shinhsu-u.ac.jp
bDepartment of Chemistry, Inha University, Incheon 22212, Korea
cDepartment of Chemistry and Research Institute for Natural Sciences, Hanyang University, Seoul 133-791, Korea
dDepartment of Chemical Engineering, Hanyang University, Seoul 133-791, Korea
eDepartment of Organic and Nano Engineering, College of Engineering, Hanyang University, 17 Haengdang-dong, Seongdong-gu, Seoul, 133-791, Korea
fDepartment of Organic and Nano Engineering, College of Engineering, Hanyang University, 17 Haengdang-dong, Seongdong-gu, Seoul, 133-791, Korea. E-mail: imss007@hanyang.ac.kr
First published on 18th January 2017
Abstract
Tungsten trioxide (WO3) based nanofibers have many advantages as photocatalysts due to its band gap which fits with readily accessible light sources. We successfully fabricated novel palladium oxide (PdO) particles decorated WO3 nanofibers by electrospinning combined with chemical deposition processes, leading to improved photocatalytic efficiency for organic dye degradation up to 86.4%. Morphologies, elemental compositions and structural analyses confirmed the successful uniform decoration of PdO particles along WO3 nanofibers. Photodegradation of methylene blue as a model pollutant in water media was performed under UV and visible light in the presence of fabricated nanofibers as a photocatalyst. As a result, improved photocatalytic activity by PdO decoration was observed compared to commercially available WO3 NFs without PdO, attributed to its ability to hold excited electrons and increase surface area of NFs. This fibrous hybrid catalytic materials platform will open up a new and practical route and stimulate further research to improve photocatalytic performance.
Introduction
In the past decades, photocatalysis has been considered as a “green” process as a variety of organic and toxic water pollutants can be decomposed and eliminated by light or UV irradiation.1,2 For this purpose, semiconducting nanostructured metal oxides have become a promising photocatalyst platform in environmental remediation due to their availability, nontoxic nature and biological/chemical stability.3,4 The semiconducting metal oxides such as TiO2, WO3, ZnO and Fe2O3 have been explored as photocatalytic nanomaterials.5,6 Among those metal oxides, much effort has been devoted to TiO2 based photocatalysts due to its excellent photoactivity and high stability,7,8 however, its wide bandgap (3.2 eV) limits its applicability as the catalytic activity can be activated by only UV light.9 In addition, easy recombination of photogenerated electron–hole pairs in TiO2 results in a low quantum efficiency.10,11 Therefore, the focus has moved to find an alternative to TiO2 for more efficient excitation of electrons to trigger photocatalytic processes. Another type of promising metal oxide is tungsten trioxide (WO3), which has been widely used for catalytically active materials and electrochromic devices,12,13 as it has a wide range of band gap from 2.4 eV to 2.8 eV which ensures considerable photocatalytic activity with visible light.14 For example, it was reported that composite photocatalysts such as CuBi2O4/WO3 and CuO/WO3 efficiently catalyzed an oxidation of acetaldehyde with visible light illumination.15There have been much efforts to improve the photocatalytic activity of WO3 by fabricating metal-supported WO3. In order for improving photocatalytic efficiency of WO3, metal such as Pt and Pd (generally Pd due to high cost of Pt), which can act as electron acceptors to effectively separate generated hole/electron pair for interfacial charge-transfer, can be incorporated to WO3.15–18 Several reports have shown the improvement of charge separation of the excited electrons by deposited metal on WO3.19 A number of holes are available due to the hydrogen peroxide generated on the support metal site, which can improve charge segregation efficiency of the excited electrons.16,20,21 Arai et al. reported mechanically mixed PdO/WO3 nanoparticles showing seven times higher photocatalytic activity than that of nitrogen doped TiO2 under visible light.15 The enhancement in photocatalytic performance is partially due to the alteration of the band gap of the semiconductor upon doping in accordance to Moss–Burstein effect.22–24 Furthermore, PdO incorporation has been utilized for a variety of applications such as gas sensing,25,26 hydrogen production through water splitting,27 catalytic conversion of methane into methanol,28 and the removal of phenol and dyes from wastewater.29,30 Recently, the ability of Pd-loaded WO3 nanoparticles was highlighted for sensitive and selective hydrogen detection,31 and for photocatalysis to oxidize alcohols.32
Nanofibers (NFs) are featured with very small diameter, extremely long length, large surface area per unit mass and small pore size providing a high surface-to-volume ratio.33 Their physical and chemical properties make them versatile for various applications, e.g. solar energy harvesting,34,35 sensors,36 catalysis,37 optoelectronics.38 Electrospinning is an effective, straightforward, and facile method to fabricate NFs and also, semiconducting metal oxide NFs.39,40 It has been reported that electrospun metal oxide NFs have high photocatalytic activities due to their one dimensional nanostructure properties with high specific surface area. Furthermore, NFs can be easily collected and recycled with various methods, maximizing its potential for practical and economic photocatalytic applications. Herein, we demonstrate the PdO nanoparticle decorated WO3 (PdO/WO3) NFs prepared by electrospinning to enhance photocatalytic efficiency to degrade methylene blue (MB) upon both UV and visible light illuminations. The PdO/WO3 NFs exhibited excellent photocatalytic activity compared to WO3 NFs, suggesting that PdO enhances photocatalytic activity of WO3 by preventing exciton recombination and increasing the efficiency of charge separation. Typically, Au, Pt and Pd type metals are loaded on the semiconductor surface for such purpose.41,42 Complexing two kind of metal oxides, PdO and WO3, was found to be effective for enhancing photocatalytic property for degradation of organic dyes. To fabricate the NFs, poly(vinyl alcohol) (PVA) was used as a template, which can be easily decomposed through annealing at high temperature (500 °C), resulting in successful formation of WO3 NFs. Pd precursor was deposited on pre-thermal-treated PVA/WO3 NFs at 200 °C. Further calcination at 500 °C allowed to form PdO particles on WO3 NFs, confirmed with various characterizations. Resulting PdO/WO3 exhibited enhanced catalytic efficiency for MB degradation with UV or visible light illumination compared to WO3 NFs without PdO particles. Also, visible light was more effective for the catalysis than UV light. The results suggest that it can be useful to efficiently degrade other types of harmful organic pollutants such as acetaldehyde and azo-dyes, and also other types of inorganic salts, possibly.
Experimental
Materials
Ammonium metatungstate hydrate (AMT, (NH4)6[H2W12O40]·nH2O, molecular weight = 2956 g mol−1), PVA (Mw = 75![[thin space (1/6-em)]](https://www.rsc.org/images/entities/char_2009.gif) 000 g mol−1) were purchased from Sigma Aldrich (USA), and palladium(II) chloride (PdCl2), ethanol, sodium hydroxide (NaOH), hydrochloric acid (HCl), methylene blue (98.5%, MB, C16H18N3SCl·3H2O) were obtained from Wako Pure Chemical Industries (Japan). All reagents were used without further purification. Deionized water (DI water) was obtained using Milli-Q system.
000 g mol−1) were purchased from Sigma Aldrich (USA), and palladium(II) chloride (PdCl2), ethanol, sodium hydroxide (NaOH), hydrochloric acid (HCl), methylene blue (98.5%, MB, C16H18N3SCl·3H2O) were obtained from Wako Pure Chemical Industries (Japan). All reagents were used without further purification. Deionized water (DI water) was obtained using Milli-Q system.
Preparation of nanofibers
10 wt% PVA aqueous solution (10 mL) was prepared by vigorously stirring the solution at 60 °C for 6 hours, then stored at room temperature. Then, AMT (1 g, 0.33 mmol) was added to the solution, followed by further stirring for 6 h. To fabricate NFs, the AMT/PVA solution was supplied to an electrospinning apparatus through a plastic syringe and a capillary tip with an inner diameter of 0.6 mm. A high-voltage power supply (Har-100*12, Matsusada Co., Tokyo, Japan), which is capable of generating voltages up to 100 kV, was used as the source of the electric field. A copper wire connected to a positive electrode (anode) was attached to an ejection needle with an inner diameter of 0.8 mm, and a negative electrode (cathode) was linked to a metallic drum (collector). The voltage was fixed at 10 kV, and the distance between the capillary tip and the metal collector was 10 cm under ambient condition with the humidity of about 40%. The resulting NF sheet was tied up with alumina frame at the edge of sheet to prevent the thermal shrinking of nanofiber. Since the fiber structure can be easily deformed when the fibers are directly heated at elevated temperature, the fiber sheet was stabilized at 200 °C for one hour in an electric furnace, resulting in stabilized AMT/PVA nanofiber (ST AMT/PVA NF) sheet. Direct elevation of temperature up to 500 °C without stabilization step can induce the fast decomposition of PVA before WO3 structure formation, resulting in mechanically unstable nanofibers mat. However, by annealing at 200 °C prior to temperature elevation for oxidation of tungsten, we found that the fiber structure is preserved during decomposition of PVA at high temperature. Fabricated ST AMT/PVA NFs were subjected to calcination process in air at 500 °C for 3 h using electric furnace (NHV-1515D, Motoyama, Co., heating rate = 3 °C min−1), to form WO3 NFs. In order to obtain PdO decorated WO3 nanofibers (PdO/WO3 NFs), ST AMT/PVA NFs was immersed in the mixture of DI water and ethanol (2/1 v/v), followed by adding 5 mM PdCl2 aqueous solution (PdCl2 solution/mixed DI water and ethanol, 1/9 v/v). The pH of resulting solution was adjusted to 3.8–4.2 using NaOH solution, then it was heated with 90 °C oil bath for 6 h. Resulting sample was washed copiously with water and ethanol for 4–5 times, followed by drying under vacuum. The PdCl2 treated NF sheet sample was subjected to the calcination process to produce PdO/WO3 NFs with the same procedure for WO3 NF samples. The scheme for whole process is presented in Fig. 1.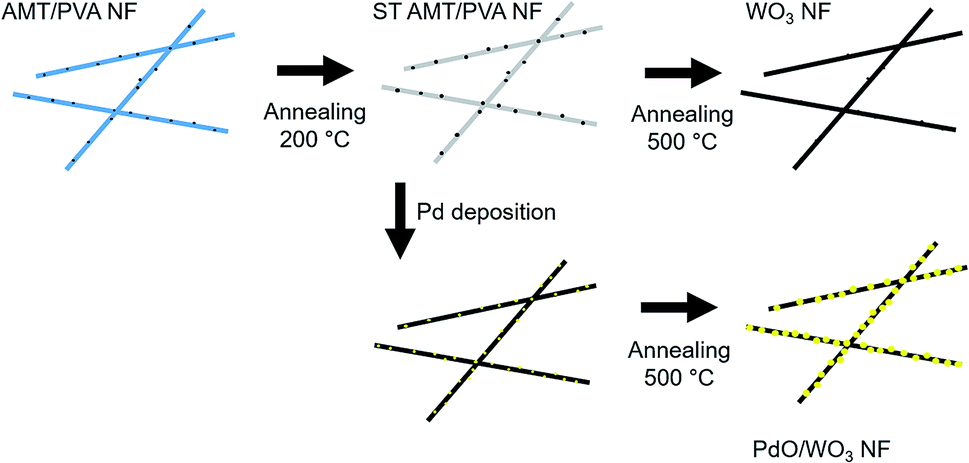 | ||
| Fig. 1 Schematic illustration depicting nanofiber fabrication process via electrospinning, chemical deposition and thermal annealing. | ||
Characterization
The morphologies of fabricated nanofibers were observed with field emission scanning electron microscopy (FE-SEM, S-5000, Hitachi, Japan). The average diameter values were extracted from the SEM micrographs using image analysis software (ImageJ). Fifty points in a single SEM image was randomly selected and analyzed to obtain a diameter distribution and its average value. Thermogravimetric analysis (TGA) was carried out using a thermogravimetric analyzer controlled by Rigaku Thermoplus TG 8120 (Rigaku Co., Japan) in the range of 25–700 °C (heating rate: 10 °C min−1) with the pyrolysis condition of high purity nitrogen as the carrier gas with flow rate of 3.5 L min−1. Wide-angle X-ray diffraction (XRD) experiments were conducted at room temperature using a Rotaflex RTP300 X-ray diffractometer (Rigaku Co., Japan) operating at 50 kV and 200 mA. Nickel-filtered CuKα radiation was used as X-ray source, and diffracted X-ray was detected with an angular range of 10° to 80°. X-ray photoelectron spectroscopy (XPS) was carried out on Shimadzu-Kratos AXIS-ULTRA HAS SV (Shimadzu Co., Ltd.) using Al X-ray source to study chemical compositions of prepared nanofibers. The binding energy for the C(1s) peak at 284.6 eV was used as the reference for spectrum calibration. To study photocatalytic behaviors of NFs, a commercial haloline visible light lamp (500 W, Osram) and UV lamp (100 V, 60 Hz, 0.7 A, XX-15NF/J, Spectroline, USA) were used. The NF samples were suspended in MB solution (3.75 × 10⁻² mM) in a batch reactor with the concentration of 0.3 mg mL−1, then sequentially exposed to UV light (345 nm) for 24 h and visible light (450–700 nm) for 12 h, then stored in dark for 24 h. The change in MB concentration was studied using UV/vis absorption spectrometry (Lambda 35 UV-vis spectrophotometer, PerkinElmer, USA).Results and discussion
Morphologies of AMT/PVA, ST AMT/PVA, WO3 and PdO/WO3 NFs were examined using FE-SEM (Fig. 2) and the average diameter of the nanofibers extracted from the SEM images was plotted in Fig. S1c.† Low magnification images of PVA and AMT/PVA nanofibers were presented in Fig. S1a and b.† As-spun PVA nanofibers exhibit a typical fibrous structure: randomly oriented, bead-free, and smooth surfaces. AMT addition makes the average diameter of nanofibers smaller: fabricated PVA nanofiber diameter was 337 ± 72 nm, while it decreased by adding AMT precursor to 264 ± 74 nm. It is due to high conductivity of AMT which leads to the reduction of an electrostatic potential that typically makes a fiber thinner in electrospinning process. Then, calcination was conducted to decompose PVA and oxidize AMT simultaneously to form WO3 alloy structure. Upon this process, the colour of AMT/PVA NF sheet changed from white to yellow (Fig. S2†). As shown in Fig. 2c, calcination significantly altered the surface morphologies of the PVA nanofibers. The diameters of pre-thermal-treated AMT/PVA nanofibers at 200 °C (ST AMT/PVA NFs) and WO3 NFs were 228 ± 72 nm and 153 ± 42 nm, respectively (Fig. S1c†). It is worth noting that the fibrous structure preserved upon the calcination process while the diameter abruptly decreased, indicating successful decomposition of PVA nanofibers. Also, the morphology and structure of WO3 nanofiber were closely examined using TEM as presented in Fig. S3.† However, in case of PdO/WO3 NFs, the formation of PdO nanoparticles formed by Pd precursor deposition and subsequent calcination process occurred along the fiber orientation. As a result, the surface of nanofibers became rougher than that of AMT/PVA NFs, with fairly small PdO particles (approximately 20–30 nm) without severe agglomeration, resulting in increase of the diameter of nanofibers to 232 ± 98 nm. We note that the calcination condition was optimized using TGA results of AMT/PVA NFs, presented in Fig. S4.† In TGA graphs, first weight decrease at up to ∼100 °C is attributed to the removal of residual solvent and water. Then, the decompositions of PVA and ATM were observed at 300 °C and 500 °C, respectively.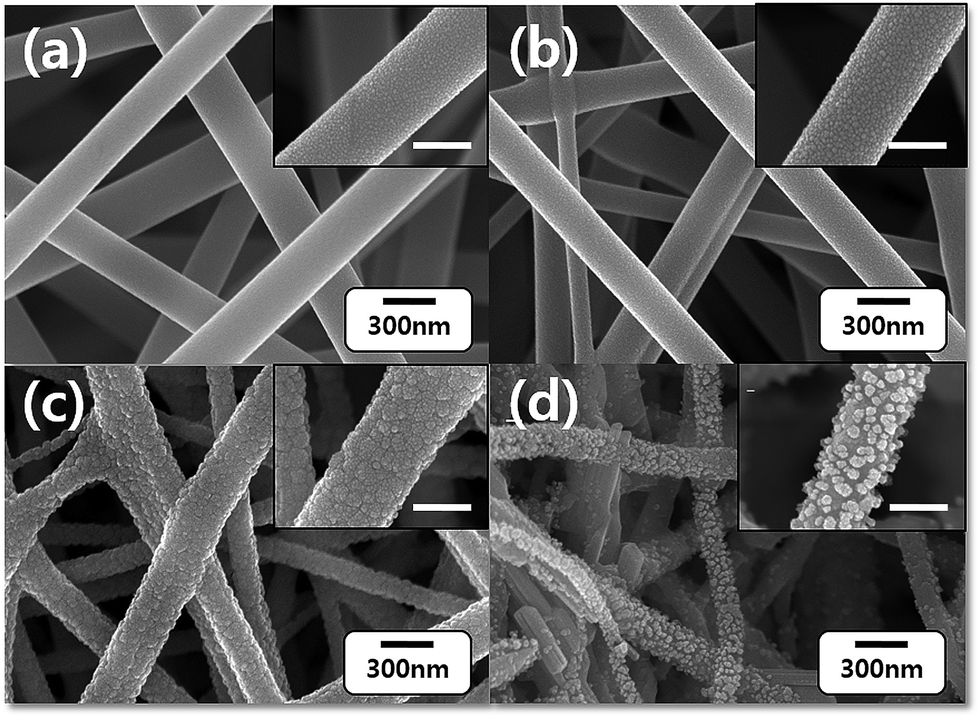 | ||
| Fig. 2 SEM micrographs of (a) AMT/PVA NFs, (b) ST AMT/PVA NFs, (c) WO3 NFs, and (d) PdO/WO3 NFs. Insets are zoomed SEM images (scale bar = 200 nm). | ||
The chemical compositions of NFs at each stage of the fabrication process were studied using XPS analysis, shown in Fig. 3a. In the survey spectra, W, Pd, O and C peaks were observed in the step wisely prepared NFs. The emergence of the peaks at ∼35 eV assigned to W(4f) and at ∼340 eV assigned to Pd(3d) confirms successful fabrication of WO3 and PdO/WO3. In a multiplex spectrum of AMT/PVA sample (Fig. 3a), the weak photoelectron emissions at 34.1 eV (W(4f7/2)) and 36.2 eV (W(4f5/2)) were both up-shifted to 35.7 eV and 37.8 eV after calcination process, respectively.43 The results suggest that the WO3 nanofibers are successfully formed after calcination process. The initial peaks of both W(4f7/2) and W(4f5/2) are typically found in W6+ ions in materials, in this case AMT,44 which also typically upshift to higher binding energy when W6+ is converted to oxidized tungsten, WO3.45 Also, in the multiplex spectra of PdO/WO3 NFs (Fig. S5b†), two intense peaks at 342.7 eV (Pd(3d5/2)) and 337 eV (Pd(3d3/2)) are observed, which are assigned to doublet peaks typically observed from PdO.46 As the formation of nanoparticles was clear in morphological studies, the emergence of the peaks confirms the formation of PdO particles and hence, PdO/WO3 NFs.
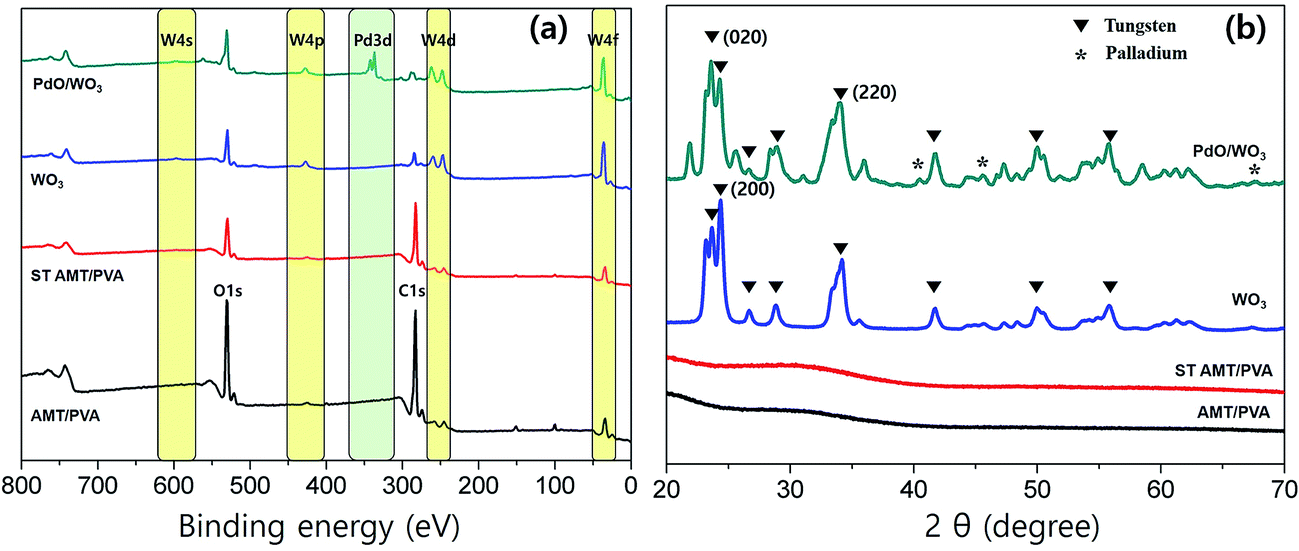 | ||
| Fig. 3 (a) XPS spectra and (b) XRD profiles of AMT/PVA, ST AMT/PVA, WO3 and PdO/WO3 NFs. | ||
We further investigated the crystal structures of metal oxides on fabricated NFs using XRD. XRD profiles of the PVA, AMT/PVA, ST AMT/PVA, WO3 and PdO/WO3 NFs also are presented in Fig. 3b, showing the metallization of WO3 and PdO. As predicted, AMT/PVA and ST AMT/PVA NFs show non-crystalline structures in materials. After calcination process, the metal crystalline peaks were observed, strongly suggesting that the WO3 and PdO/WO3 NFs were successfully produced. It is worth noting that although pre-thermal-treatment at 200 °C does not convert the AMT precursors to tungsten oxide, and it helps to avoid the collapse of nanofiber during Pd deposition process. The diffraction peaks for the WO3 and PdO were clearly presented in XRD profiles. The results suggest that all WO3 and PdO/WO3 nanofibers are highly crystalline, and both XRD spectra indicate monoclinic WO3 phase having dominant planes at (020), (200) and (220).47 Also, the XRD peaks at 40°, 46° and 68° in Fig. 3b are assigned to (111), (200) and (220) diffraction of palladium, respectively.48 It indicates that PdO particles are deposited on the WO3 NFs, which were confirmed with the SEM (Fig. 2d) and XPS studies. The SEM images of PdO–WO3 NFs prepared at 200 °C and 500 °C are presented in Fig. S6a and b,† respectively. The size of PdO particles of resulting samples obtained at 500 °C is typically larger than that of the particles fabricated at 200 °C, underscoring the importance of temperature as an essential parameter for successful synthesis of PdO/WO3 NFs.
Photocatalytic activities of prepared NFs were evaluated by measuring their performances for degradation of MB in an aqueous solution. Fig. 4 shows the results of MB degradation studies using WO3 NFs and PdO/WO3 NFs upon UV light and visible light illuminations. As a control, the blank solution (without NF catalysts) were measured simultaneously. The degradation efficiency was given by the equation of η (%) = [(C − Ci)/C] × 100, where η is a degradation efficiency, Ci is an initial concentration of MB solution, C is a concentration of MB solution after light illumination obtained using the equation extracted from linear fitting of absorbance at 665 nm (λmax) as a function of MB concentration (Fig. S7†). Since WO3 is known to absorb UV light in wavelength range less than 443 nm due to its band gap (∼2.8 eV),14,49,50 leading to quite high degradation efficiency (62.4%) upon UV degradation at 12 h as presented in Fig. 4a. On the other hand, the degradation efficiency sharply decreased with visible light illumination to 36.1% and 47.5% with illumination for 12 and 24 h, respectively, which are less efficient compared to degradation under UV light. Typically, dye degradation efficiency becomes higher when light with absorbable wavelength range is illuminated intensively, which leads to high hole/electron pair generation efficiency.51 Consequently, UV light results in the higher degradation efficiency in WO3 NFs than visible light. PdO/WO3 NFs show ∼10% higher efficiency when visible light is utilized for degradation rather than UV light (Fig. 4b and c). More importantly, the efficiency of PdO/WO3 NFs was measured to be two times higher than WO3 NFs (Fig. 4d). In addition, the degradation efficiency of PdO/WO3 NFs was 86.4%, which is much improved compared to commercially available WO3 nanofibers (Fuji Pigment, ∼55% efficiency under visible light for 24 h). These results are meaningful as it shows a potential for further efficiency enhancement of catalytic nanofibers by introducing Pd metals on them. And note that all WO3 based NFs retained their structure after photodegradation, indicating their high stability upon photocatalysis.
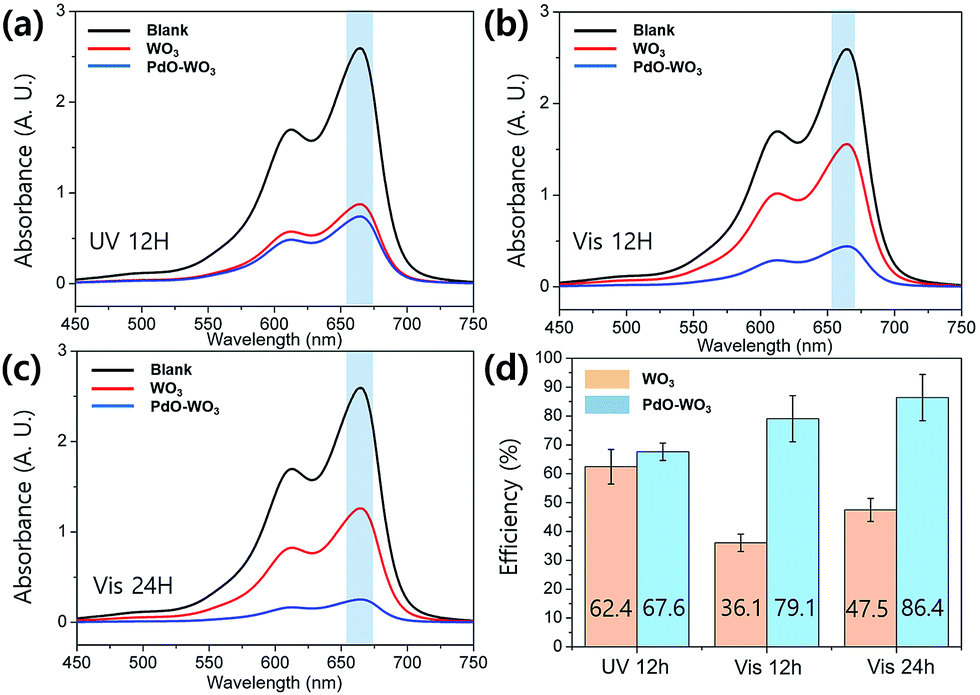 | ||
| Fig. 4 UV/vis spectra from MB aqueous solutions with WO3 and PdO/WO3 NFs with different irradiation time and sources, (a) UV light for 12 h, (b) visible light for 12 h, (c) visible light for 24 h, and (d) extracted degradation efficiencies. | ||
From these results, it is clear that PdO particles enhance the photocatalytic activity of WO3 support. It has been widely accepted that metal oxide particles can act as an electron acceptor in the metal photocatalytic system.10,52 Particularly, PdO particle is known to have an ability to capture electrons during photocatalytic process and as a result, recombination of electron–hole pair can be minimized.53 When WO3 absorbs the light having energy equal to or greater than the band gap of the material, electron–hole pairs are generated in WO3. Then the photogenerated hole/electron pairs migrate to the surface of the Pd, allowing reaction with adsorbed chemical species. In this system, adsorbed oxygen scavenges generated electron, leading to H2O2, followed by generation of hydroxyl radicals. The active hydroxyl radicals are responsible for the degradation of the MB. The photocatalyst mechanism is illustrated in Fig. 5. For an effective photocatalysis, more electrons in conduction band should be used for the catalytic activity to avoid recombining with holes in the valance band. Note that the combination of nanofibers with nanoparticles significantly enhances an active surface area, leading to enhanced catalytic activities to react with target molecules.54 The combination of nanoparticle and nanofiber would greatly enhance their surface area. Therefore, when PdO particles are presented on the surface of WO3 nanofiber, higher catalytic activity is expected as the Pd particles are able to hold excited electrons, followed by transfer of the electrons to MB molecules, and are able to increase the total surface area by decorating PdO particles.
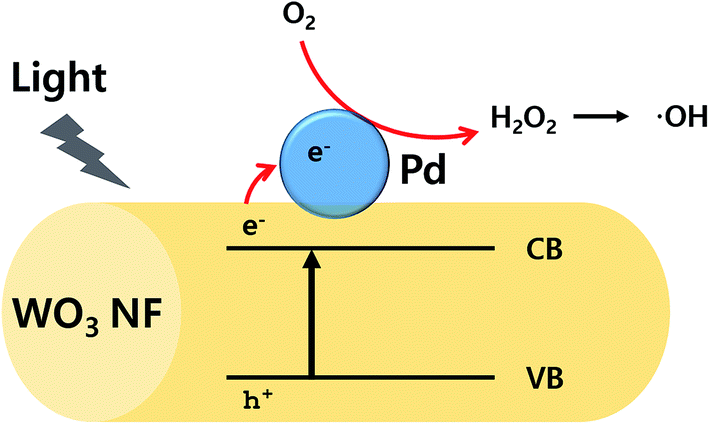 | ||
| Fig. 5 Schematic illustration of photocatalytic process of Pd/WO3 NFs. | ||
Conclusions
PdO decorated WO3 nanofibers exhibiting a high photocatalytic performance were fabricated via combination of electrospinning and annealing processes. The morphologies of nanofibers at each fabrication step were observed by FE-SEM, and resulting nanofibers showed the PdO particles distributed over the surface of WO3 nanofiber, further confirmed by XPS and XRD. The photocatalytic activity of WO3 nanofibers was enhanced when PdO particles were loaded on the surface of nanofibers due to increased charge separation efficiency and total surface area, leading higher photocatalytic activities for degradation of MB upon both visible and UV light illuminations. The degradation efficiency of PdO/WO3 NFs was improved about two times compared to WO3 NFs without PdO. Furthermore, generally, one-dimensional nanofibers have a high sedimentation rate, leading to high possibility for recycling after catalytic reaction. Therefore, this fibrous hybrid catalytic materials platform with enhanced photocatalytic activities will open the feasibility toward a number of industrial applications to eliminate organic pollutants from wastewater.Funding sources
This research did not receive any specific grant from funding agencies in the public, commercial, or not-for-profit sectors.Acknowledgements
H. L. gratefully acknowledges the support from Division of Frontier Fibers, Institute for Fiber Engineering (IFES), Interdisciplinary Cluster for Cutting Edge Research (ICCER) at Shinshu University. S. O. acknowledges support from Basic Science Research Program through the National Research Foundation of Korea (NRF) funded by the Ministry of Education (2016R1A6A1A03013422). D. S. thanks to the National Research Foundation of Korea (NRF-2015M2B2A9032029). We acknowledge support from the staff and the use of equipment at Shinshu University.Notes and references
- H. Yoneyama, Y. Yamashita and H. Tamura, Nature, 1979, 282, 817–818 CrossRef CAS.
- R. Asahi, T. Morikawa, T. Ohwaki, K. Aoki and Y. Taga, Science, 2001, 293, 269–271 CrossRef CAS PubMed.
- A. Testino, I. R. Bellobono, V. Buscaglia, C. Canevali, M. D'Arienzo, S. Polizzi, R. Scotti and F. Morazzoni, J. Am. Chem. Soc., 2007, 129, 3564–3575 CrossRef CAS PubMed.
- K.-i. Katsumata, C. E. J. Cordonier, T. Shichi and A. Fujishima, J. Am. Chem. Soc., 2009, 131, 3856–3857 CrossRef CAS PubMed.
- F. Dong, S. Guo, H. Wang, X. Li and Z. Wu, J. Phys. Chem. C, 2011, 115, 13285–13292 CAS.
- C. Santato, M. Ulmann and J. Augustynski, J. Phys. Chem. B, 2001, 105, 936–940 CrossRef CAS.
- A. Fujishima, Nature, 1972, 238, 37–38 CrossRef CAS PubMed.
- M. R. Hoffmann, S. T. Martin, W. Choi and D. W. Bahnemann, Chem. Rev., 1995, 95, 69–96 CrossRef CAS.
- K. Nagaveni, M. S. Hegde, N. Ravishankar, G. N. Subbanna and G. Madras, Langmuir, 2004, 20, 2900–2907 CrossRef CAS PubMed.
- X. Zhang, F. Zhang and K.-Y. Chan, Mater. Chem. Phys., 2006, 97, 384–389 CrossRef CAS.
- B. Xie, Y. Xiong, R. Chen, J. Chen and P. Cai, Catal. Commun., 2005, 6, 699–704 CrossRef CAS.
- C. G. Granqvist, Sol. Energy Mater. Sol. Cells, 2000, 60, 201–262 CrossRef CAS.
- W. Erbs, J. Desilvestro, E. Borgarello and M. Graetzel, J. Phys. Chem., 1984, 88, 4001–4006 CrossRef CAS.
- J. Desilvestro and M. Neumann-Spallart, J. Phys. Chem., 1985, 89, 3684–3689 CrossRef CAS.
- T. Arai, M. Horiguchi, M. Yanagida, T. Gunji, H. Sugihara and K. Sayama, Chem. Commun., 2008, 5565–5567 RSC.
- F. Yang, Y. Takahashi, N. Sakai and T. Tatsuma, J. Phys. Chem. C, 2011, 115, 18270–18274 CAS.
- M. Miyauchi, Phys. Chem. Chem. Phys., 2008, 10, 6258–6265 RSC.
- T. Arai, M. Horiguchi, M. Yanagida, T. Gunji, H. Sugihara and K. Sayama, J. Phys. Chem. C, 2009, 113, 6602–6609 CAS.
- H. Irie, S. Miura, K. Kamiya and K. Hashimoto, Chem. Phys. Lett., 2008, 457, 202–205 CrossRef CAS.
- J. Kim, C. W. Lee and W. Choi, Environ. Sci. Technol., 2010, 44, 6849–6854 CrossRef CAS PubMed.
- T. Arai, M. Horiguchi, M. Yanagida, T. Gunji, H. Sugihara and K. Sayama, Chem. Commun., 2008, 5565–5567 RSC.
- F. Shan, B. Kim, G. Liu, Z. Liu, J. Sohn, W. Lee, B. Shin and Y. Yu, J. Appl. Phys., 2004, 95, 4772–4776 CrossRef CAS.
- E. Burstein, Phys. Rev., 1954, 93, 632 CrossRef CAS.
- T. Moss, Proc. Phys. Soc., London, Sect. B, 1954, 67, 775 CrossRef.
- A. Aznarez, A. Gil and S. A. Korili, RSC Adv., 2015, 5, 82296–82309 RSC.
- M. Huang, Z. Cui, X. Yang, S. Zhu, Z. Li and Y. Liang, RSC Adv., 2015, 5, 30038–30045 RSC.
- H. Zeng, P. Liu, W. Cai, S. Yang and X. Xu, J. Phys. Chem. C, 2008, 112, 19620–19624 CAS.
- M. A. Gondal, A. Hameed and Z. H. Yamani, J. Mol. Catal. A: Chem., 2004, 222, 259–264 CrossRef CAS.
- M. Qamar, M. Gondal and Z. Yamani, Catal. Commun., 2009, 10, 1980–1984 CrossRef CAS.
- M. A. Gondal, M. N. Sayeed and Z. Seddigi, J. Hazard. Mater., 2008, 155, 83–89 CrossRef CAS PubMed.
- S. Kabcum, D. Channei, A. Tuantranont, A. Wisitsoraat, C. Liewhiran and S. Phanichphant, Sens. Actuators, B, 2016, 226, 76–89 CrossRef CAS.
- O. Tomita, T. Otsubo, M. Higashi, B. Ohtani and R. Abe, ACS Catal., 2016, 6, 1134–1144 CrossRef CAS.
- H. Lee, J. M. Koo, D. Sohn, I.-S. Kim and S. S. Im, RSC Adv., 2016, 6, 40383–40388 RSC.
- B. Weng, S. Liu, Z.-R. Tang and Y.-J. Xu, RSC Adv., 2014, 4, 12685–12700 RSC.
- S. Liu, C. Han, Z.-R. Tang and Y.-J. Xu, Mater. Horiz., 2016, 3, 270–282 RSC.
- P. Sahatiya and S. Badhulika, RSC Adv., 2015, 5, 82481–82487 RSC.
- C. Jiang, J. Nie and G. Ma, RSC Adv., 2016, 6, 22996–23007 RSC.
- J. H. Jang, K.-S. Jeon, S. Oh, H.-J. Kim, T. Asahi, H. Masuhara and M. Yoon, Chem. Mater., 2007, 19, 1984–1991 CrossRef CAS.
- Y. Zheng, R. H. Gong and Y. Zeng, RSC Adv., 2015, 5, 48533–48540 RSC.
- A. Jindal, S. Basu and C. P. Aby, RSC Adv., 2015, 5, 69378–69387 RSC.
- M. Sadeghi, W. Liu, T. Zhang, P. Stavropoulos and B. Levy, J. Phys. Chem., 1996, 100, 19466–19474 CrossRef CAS.
- T. Sakata, T. Kawai and K. Hashimoto, Chem. Phys. Lett., 1982, 88, 50–54 CrossRef CAS.
- C. Navío, S. Vallejos, T. Stoycheva, E. Llobet, X. Correig, R. Snyders, C. Blackman, P. Umek, X. Ke, G. Van Tendeloo and C. Bittencourt, Mater. Chem. Phys., 2012, 134, 809–813 CrossRef.
- I. A. Mkhalid, Ceram. Int., 2016, 42, 15975–15980 CrossRef CAS.
- M. Ma, K. Zhang, P. Li, M. S. Jung, M. J. Jeong and J. H. Park, Angew. Chem., 2016, 128, 11998–12002 CrossRef.
- T. H. Fleisch and G. J. Mains, J. Phys. Chem., 1986, 90, 5317–5320 CrossRef CAS.
- T. Samerjai, N. Tamaekong, C. Liewhiran, A. Wisitsoraat, A. Tuantranont and S. Phanichphant, Sens. Actuators, B, 2011, 157, 290–297 CrossRef CAS.
- T. Teranishi and M. Miyake, Chem. Mater., 1998, 10, 594–600 CrossRef CAS.
- F. Wang, C. Di Valentin and G. Pacchioni, ChemCatChem, 2012, 4, 476–478 CrossRef CAS.
- M. Miyauchi, A. Nakajima, K. Hashimoto and T. Watanabe, Adv. Mater., 2000, 12, 1923–1927 CrossRef CAS.
- Q. Xue, Y. Liu, Q. Zhou, M. Utsumi, Z. Zhang and N. Sugiura, Chem. Eng. J., 2016, 283, 614–621 CrossRef CAS.
- F. B. Li and X. Z. Li, Chemosphere, 2002, 48, 1103–1111 CrossRef CAS PubMed.
- G. Facchin, G. Carturan, R. Campostrini, S. Gialanella, L. Lutterotti, L. Armelao, G. Marcì, L. Palmisano and A. Sclafani, J. Sol-Gel Sci. Technol., 2000, 18, 29–59 CrossRef CAS.
- B. J. Gallon, R. W. Kojima, R. B. Kaner and P. L. Diaconescu, Angew. Chem., Int. Ed., 2007, 46, 7251–7254 CrossRef CAS PubMed.
Footnote |
| † Electronic supplementary information (ESI) available: SEM image, EDX spectrum, digital photograph of nanofiber and Pd deposition process, resistance change, hydrogen sensing device. See DOI: 10.1039/c6ra24935c |
| This journal is © The Royal Society of Chemistry 2017 |