 Open Access Article
Creative Commons Attribution 3.0 Unported Licence
Nitrogen-doped TiO2(B) nanorods as high-performance anode materials for rechargeable sodium-ion batteries
Yingchang Yang *,
Shijia Liao,
Wei Shi,
Yundong Wu,
Renhui Zhang and
Senlin Leng*
College of Material and Chemical Engineering, Tongren University, Tongren 554300, China. E-mail: yangyc612@gmail.com; 764546880@qq.com
First published on 10th February 2017
Abstract
To achieve better anode materials for sodium ion batteries, a nitrogen-doped TiO2(B) nanorod structure is developed utilizing hydrothermal treatment, ion exchange and a subsequent low temperature calcination process. Transmission electron microscopy, X-ray photoelectron spectroscopy and X-ray diffraction are employed to characterize the structure and properties of the nitrogen-doped TiO2(B). Compared with anatase TiO2 powder (325 mesh) raw materials and the TiO2(B) nanorods without N-doping, the as-fabricated nitrogen-doped TiO2(B) nanorods with a nitrogen-doping amount of 1.23 atom% exhibit higher specific capacity (224.5 mA h g−1), good cycling stability (the capacity retention ratios after 200 cycles at 2C is 93.4%) and enhanced rate capability (110 mA h g−1 at 3.35 A g−1), which is likely to be associated with enhanced conductivity due to N-doping.
1. Introduction
Owning to its intrinsic safety, low cost, long cycle life and environmental friendliness, titanium dioxide (TiO2) has attracted widespread attention in the areas of lithium-ion batteries (LIBs), sodium-ion batteries (SIBs) and hybrid supercapacitors.1–5 Among the polymorphs of TiO2, the bronze-phase (TiO2(B)), has a unique monoclinic C2/m structure with an open tunnel structure parallel to the b-axis, which favors rapid lithium-ion intercalation/de-intercalation capability.6 In contrast to LIBs, room-temperature the SIB has gained more interest in large-scale energy storage systems because of the greater abundance and lower cost of sodium-containing precursors in recent years.7 In 2013, the feasibility of electrochemical sodium storage of TiO2(B) nanotubes was first investigated as anodes for SIBs.8 These TiO2(B) nanotubes designed by Huang et al. with large interlayer spacing (0.56 nm) of the (001) plane could deliver a discharge capacity of 50 mA h g−1 at 40 mA g−1 after 90 cycles. And then, Wu et al. reported a noodle-like nanocrystalline TiO2(B) fabricated through hydrolysis of TiCl3 using a mixture of ethylene glycol and water at moderate temperature for anode materials of SIBs.9 The reversible capacity of this nanocrystalline TiO2(B) can reach to about 100 mA h g−1 at 33.5 mA g−1 over 70 cycles and the rate capability has been improved (50 mA h g−1 at 3.35 A g−1). More recently, TiO2-B nanowires developed by Lee et al. with a hydrothermal method possessed long and stable cyclability with a specific capacity of 150 mA h g−1 at 20 mA g−1 over 50 cycles.10 These results suggest that TiO2-B is a promising candidate anode material for SIB but the rate performance is still not good enough for applications in large-scale electrochemical storage device.To improve the rate capability of electrode materials, many strategies such as designing carbon nanocomposite and doping with foreign atoms (N, S, Sn, et al.) have been introduced, as the introduction of carbon additive and foreign atom can enhance electron transport.11–14 For example, Henry et al. introduced anatase TiO2@C nanocomposites by pyrolysis of cellulose.11 These composites with improved electrical contact and faster electron/ion transfer show better lithium/sodium storage properties than pure TiO2 samples. Wu et al. reported N-doped ordered mesoporous anatase TiO2 nanofibers fabricated via electrospinning method and subsequent nitridation treatment.12 This material exhibits superior cycling stability and rate performance when used as an anode material for sodium-ion batteries. Sn-doped anatase TiO2 nanotubes synthesized by Yan et al. through sol–gel method and subsequent hydrothermal process exhibit improved sodium storage performance,13 due to the increase of electrical conductivity by Sn-doping.
In this paper, hydrothermal treatment, ion exchange and subsequent low temperature calcination process is utilized to design nitrogen-doped TiO2(B) with nanorods structure. Ammonium carbonate is used as the nitrogen source. When tested as anode materials for sodium ion battery, the N-doped TiO2(B) nanorods show high specific capacity, good rate capability and enhanced cycling performance.
2. Experimental section
2.1. Chemicals and materials
Carboxymethyl cellulose (CMC), propylene carbonate (PC) and NaClO4 were purchased from Alfa Aesar. Sodium and fluoroethylene carbonate (FEC) were bought from Sigma-Aldrich. All other chemicals (purchased from Sinopharm Chemical Reagent Co., Ltd, Shanghai, China) used in this experiment were analytical grade and were used without further purification.2.2. Materials preparation
In a typical synthesis, 1.0 g anatase TiO2 powders (325 mesh) were dispersed in 60 ml of a NaOH aqueous solution (10 M) and then transferred into a Teflon-lined stainless steel autoclave and kept at 180 °C for 12 h to obtain Na2Ti3O7 nanorods. Then, the as-obtained Na2Ti3O7 nanorods were immersed in 1 M (NH4)2CO3 solution to yield (NH4)2Ti3O7 nanorods. After ion exchange for 6 h, the sample was rinsed with deionized water to remove the redundant NH4+ and was dried at 60 °C for 12 h. Then, the product was calcined at 350 °C under Ar for 1.5 h to obtain N-TiO2(B) nanorods sample. For comparison, the TiO2(B) nanorods sample without N-doping was obtained using 1 M HCl as reagent during the ion exchange process with other conditions unchanged.2.3. Materials characterization
Transmission electron microscopy (TEM) analysis were conducted using a JEM-2100F instrument with an accelerating voltage of 200 kV. Surface compositions were analyzed with an ESCALab250 X-ray photoelectron spectroscopy (XPS). X-ray diffraction (XRD) patterns were obtained with a Rigaku D/max 2550 VB+ 18 kW X-ray diffractometer with Cu Kα radiation (0.1542 nm).2.4. Evaluation of Na storage properties
Active materials dried at 60 °C for 24 h in a vacuum oven were mixed with a binder carboxymethyl cellulose (CMC) and Super P at weight ratios of 70![[thin space (1/6-em)]](https://www.rsc.org/images/entities/char_2009.gif) :
:![[thin space (1/6-em)]](https://www.rsc.org/images/entities/char_2009.gif) 15
15![[thin space (1/6-em)]](https://www.rsc.org/images/entities/char_2009.gif) :
:![[thin space (1/6-em)]](https://www.rsc.org/images/entities/char_2009.gif) 15 in water solvent to form slurry. Then, the resultant slurry was uniformly pasted on Cu foil with a blade. The average mass of the active material in the prepared electrode sheets is 1.5 mg cm−2. The calculation of specific capacity is based on the total mass of active materials. These prepared electrode sheets were dried at 100 °C in a vacuum oven for 12 h and pressed under a pressure of approximately 20 MPa. CR2016-type coin cells were assembled inside an mBraun glovebox (H2O < 0.5 ppm, O2 < 0.5 ppm) using the metallic sodium counter/reference electrode and a polypropylene separator (Celgard 2400). The electrolyte solution is 1 M NaClO4 in propylene carbonate (PC) with 5 vol% FEC additive. Galvanostatic charge/discharge cycles were carried out with an Arbin battery cycler (BT2000) between 3.0 and 0.01 V vs. Na+/Na. The electrochemical impedance measurements were performed on Solartron Analytical at an AC voltage of 7 mV amplitude in the frequency range of 105 to 10−2 Hz. Cyclic voltammetry (CV) tests were also conducted on Solartron Analytical.
15 in water solvent to form slurry. Then, the resultant slurry was uniformly pasted on Cu foil with a blade. The average mass of the active material in the prepared electrode sheets is 1.5 mg cm−2. The calculation of specific capacity is based on the total mass of active materials. These prepared electrode sheets were dried at 100 °C in a vacuum oven for 12 h and pressed under a pressure of approximately 20 MPa. CR2016-type coin cells were assembled inside an mBraun glovebox (H2O < 0.5 ppm, O2 < 0.5 ppm) using the metallic sodium counter/reference electrode and a polypropylene separator (Celgard 2400). The electrolyte solution is 1 M NaClO4 in propylene carbonate (PC) with 5 vol% FEC additive. Galvanostatic charge/discharge cycles were carried out with an Arbin battery cycler (BT2000) between 3.0 and 0.01 V vs. Na+/Na. The electrochemical impedance measurements were performed on Solartron Analytical at an AC voltage of 7 mV amplitude in the frequency range of 105 to 10−2 Hz. Cyclic voltammetry (CV) tests were also conducted on Solartron Analytical.
3. Results and discussions
3.1. Material synthesis and characterization
It is well known that TiO2 particles can react with NaOH in strongly alkaline solution and recrystallize into Na2Ti3O7 with various morphologies like nanorods, nanowires, and nanosheets during the hydrothermal treatment.15 In this work, ion exchange of (NH4)2CO3 with the Na2Ti3O7 nanorods prepared through hydrothermal treatment and subsequent calcination at low temperature are used to fabricate nitrogen-doped TiO2(B) with nanorods structure. For comparison, TiO2(B) nanorods sample without N-doping was also fabricated utilizing 1 M HCl as reagent during the ion exchange process with other conditions unchanged. Fig. 1 displays the XRD patterns of the anatase TiO2 powders raw materials, the as-prepared TiO2(B) nanorods, N-TiO2(B) nanorods, and the JCPDS standard cards for anatase and bronze TiO2. It is apparently that the raw materials is anatase TiO2 and the products are monoclinic TiO2(B). The major diffraction peaks for N-TiO2(B) nanorods at 15.1, 24.8, 28.6, 43.8, 48.3, 57.8, and 67.4 can be indexed to (001), (110), (002), (003), (020), (022) and (023) of metastable monoclinic TiO2(B) (JCPDS no. 46-1237).16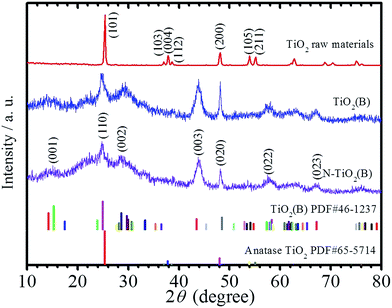 | ||
| Fig. 1 XRD patterns of the anatase TiO2 powders raw materials, the as-prepared TiO2(B) nanorods, N-TiO2(B) nanorods, and the JCPDS standard cards for bronze and anatase TiO2. | ||
Fig. 2 shows the TEM, high-resolution TEM (HRTEM) and the corresponding selected area electron diffraction (SAED) of the N-TiO2(B) nanorods and the TiO2(B) nanorods samples. As can be seen in Fig. 2a and b, the N-TiO2(B) shows clear rods structures and the rods are hundreds nanometers in length. The HRTEM image given in Fig. 2c displays clear crystal planes in the rods corresponding to the (001) plane and the (110) plane of TiO2(B). The SAED pattern (Fig. 2d) shows weak diffraction rings corresponding to the (110), (020), (113), (602), and (621) crystalline planes of the bronze TiO2, confirming the formation of polycrystalline TiO2(B).6 The TEM and HRTEM images of TiO2(B) sample are given in Fig. 2e and f, displaying similar rod like morphology with the N-TiO2(B) sample.
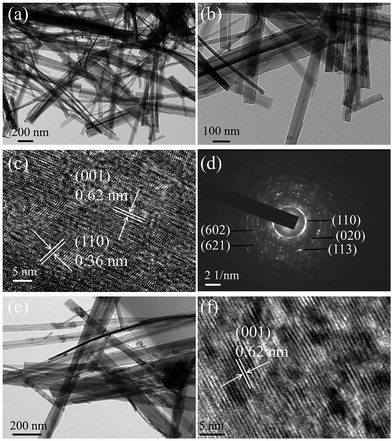 | ||
| Fig. 2 TEM (a and b), HRTEM (c) images and SAED pattern (d) of the N-TiO2(B) sample. TEM (e) and HRTEM (f) images of TiO2(B) sample. | ||
To investigate the nitrogen species and contents of the as-obtained N-TiO2(B) rods, XPS was performed to characterize the N-TiO2(B) sample. The survey XPS curve (Fig. 3a) confirms the existence of Ti, O and N in the sample, approving the successful doping of nitrogen in TiO2(B).17,18 The amount of N species in the N-TiO2(B) was calculated to be 1.23 atom%. The high resolution XPS spectra of Ti 2p and O 1s were shown in Fig. 3b and c. In Fig. 3b, two strong peaks at 458.5 and 464.6 eV are assigned to Ti 2p3/2 and Ti 2p1/2, respectively, which are in agreement with the binding energies of Ti4+ in the TiO2 lattice.17,19 The binding energy of O 1s band (Fig. 3c) at 529.9 eV corresponds to O2− in TiO2 lattice.17,19 These assignments are in good agreement with the results of N-TiO2 reported in the recent literatures.17,19 In order to gain detailed information on the chemical state of N in the N-TiO2(B), deconvolution of the N 1s XPS is shown in Fig. 3d. The N 1s peaks at 395.9, 399.5 and 401.8 eV for N-TiO2(B) rods can be assigned to the substituted atomic N species in the TiO2 lattice (Ti–N), interstitial N anions at interstitial site with an O–Ti–N linkage and the molecularly chemisorbed nitrogen atoms located at the interstitial sites of the TiO2 lattice,20 respectively. It has been reported that the role of N species on the electrical conductivity of TiO2 is mainly related to the narrowing of the band gap and the substitutional N plays a key role in narrowing the band gap by elevating the valence band maximum, while the interstitial N can only introduce some localized N 2p states in the gap.19
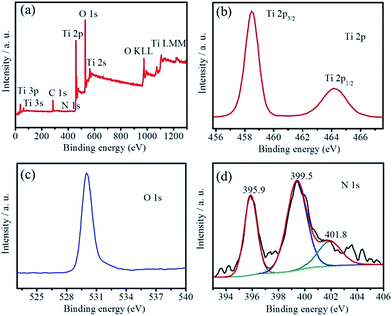 | ||
| Fig. 3 The survey scan of XPS (a), Ti 2p (b), O 1s (c), and N 1s (d) core level XPS spectra of the N-TiO2(B) sample. | ||
3.2. Electrochemical sodium-storage properties
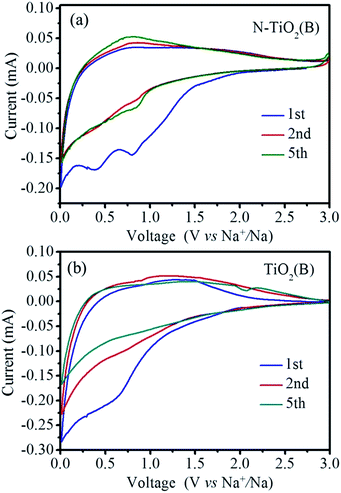
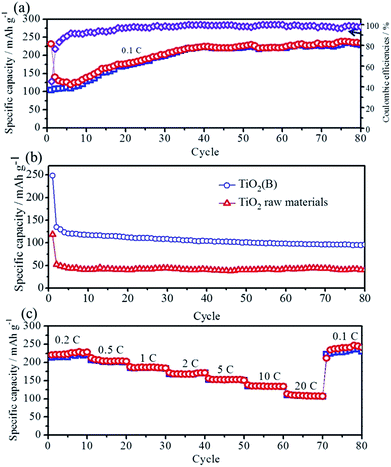
The sodium-storage performance of the as-prepared N-TiO2(B) were evaluated in a half-cell using the metallic sodium as the counter/reference electrode. Firstly, cyclic voltammetry (CV), a powerful and sensitive electrochemical method, is utilized to investigate the electrochemical sodiation/desodiation reactions related to fast double-layer capacitance or faradaic redox processes. Fig. 4a depicts CVs of the as-obtained N-TiO2(B) rods electrode for the first, second and fifth cycles at a scanning rate of 0.1 mV s−1 within the voltage range from 3.0 to 0.01 V. In general, no visible peak can be observed in the CV curves, which is consistent with most of the TiO2 materials,8,21,22 demonstrating similar electrochemical sodiation/desodiation (redox) ways. During the first cycle, two wide peaks at 0.8 and 0.4 V are observed in the cathodic sweep, and disappeared in the subsequent cycles, which might be associated with the irreversible cathodic decomposition and irreversible side reactions of the electrolyte at the surface of bronze TiO2.8–10,23 In the subsequent cycles, only broad and weak redox peaks can be observed during the cathodic and anodic scan, respectively, which are probably related to the reduction of Ti4+ to Ti3+ and the subsequent oxidation back to Ti4+.9 This phenomenon is obviously different from anatase TiO2 and hollandite-type TiO2,24,25 however, similar with rutile TiO2.26,27 Interesting, the anodic and cathodic current are apparently increasing upon cycling, indicating the reversible insertion/extraction of sodium, which is in agreement with the previous works.28–30 The continuous increase of anodic and cathodic current is probably associated with the kinetically hindered reversible sodiation/desodiation that call for some kind of activation.31,32 The CV results of the TiO2(B) nanorods electrode are also shown in Fig. 4b for comparison. As can be seen, no noticeable peak can be observed in the CV curves, which is similar with the electrochemical sodiation/desodiation performance of the N-TiO2(B) nanorods electrode. However, the anodic and cathodic current of the TiO2(B) electrode decrease upon cycling, indicating some kinds of electrochemical irreversibility for the TiO2(B) electrode.The cycling stability and rate capability of the N-TiO2(B) rods electrode were further tested. Fig. 5a displays the cycling performance of the N-TiO2(B) rods electrode at a low current density of 16.75 mA g−1 (0.1C) within the voltage range of 3.0–0.01 V. It is seen that the initial discharge capacity is 231.5 mA h g−1, and a reversible capacity of 104.3 mA h g−1 can be achieved. Interestingly, the reversible specific capacity gradually increases upon cycling up to 224.5 mA h g−1. After 40 cycles, the reversible specific capacity turns to be stable in the following cycles. Such an increase in specific capacity associated with gradual activation of TiO2 upon iterative sodiation/desodiation was already reported for Nb-doped rutile TiO2,33 anatase TiO2,31,32 and amorphous TiO2,34 possibly due to a relatively low initial adsorption of sodium ions to the TiO2 surface,31,35 which deserves certainly further investigation by complementary techniques in future. The first coulombic efficiency is calculated to be 45.1%, indicating huge irreversible capacity loss, which is in accordance with most of the TiO2 anode materials for sodium ion batteries.13,16,24,25,27,29,31,36 The origin of the initial huge irreversibility of TiO2(B) anode materials, recently discussed by Wu et al.,9 may be related to electrolyte decomposition and reorganization of TiO2 during the initial sodiation. Nevertheless, further studies will have to be carried out in future to define the detailed reasons for this huge irreversible capacity loss in case of TiO2(B). During the subsequent charge/discharge cycling, the coulombic efficiencies of N-TiO2(B) ascend to 98.6% in the 30th cycle, where the sodiation/desodiation process becomes almost reversible. It is noted that after ca. 35 cycles the coulombic efficiency occasionally surpasses 100%, which is due to the formation of high impedance short circuits initiated by small dendrites growing on the surface of sodium counter electrode just before the end of desodiation of the TiO2 materials. For comparison, the cycling test of anatase TiO2 raw materials and TiO2(B) nanorods sample without N-doping at 16.75 mA g−1 were also carried out. As shown in Fig. 5b, the reversible specific capacity of anatase TiO2 raw materials is lower than 50 mA h g−1. The reversible specific capacity of TiO2(B) nanorods sample without N-doping can reach to 120 mA h g−1, however, no activation process can be observed during the whole cycling process. It is a notable result that the N-TiO2(B) nanorods electrode displayed better electrochemical performance than that of the TiO2(B) nanorods electrode without N-doping. The possible mechanism for the improved performance by N-doping into TiO2 can be associated with enhancement of its electronic conductivity. In fact, electrical resistance measurement under a uniaxial press of active material powders demonstrates that the electronic resistivity of the N-TiO2(B) pellet (2.9 × 10³ Ω cm) is much lower than that of TiO2(B) pellet (3.3 × 10⁵ Ω cm). After activation of the N-TiO2(B) electrode completely, rate capability studies at different current densities was carried out, and the results are summarized in Fig. 5c. The N-TiO2(B) electrode can deliver a discharge specific capacity of 223, 205, 188,168, and 154 mA h g−1 using a charge and discharge rate of 0.2, 0.5, 1, 2, and 5C (1C = 167.5 mA g−1), respectively. Even charge/discharge at high rates of 10 and 20C, this electrode can still carry a discharge specific capacity of 135 and 110 mA h g−1, much higher than the previous reports on TiO2(B) based electrodes.8–10 Notably, the specific capacity can be recovered to the initial value when the current density is reduced back to 0.1C.
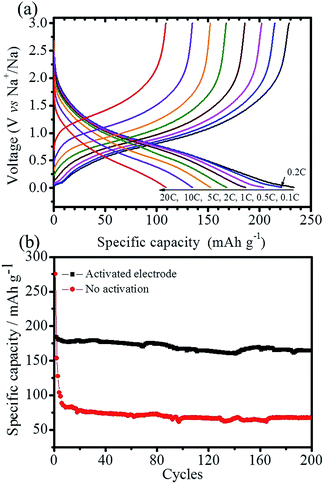
Fig. 6a shows the galvanostatic charge/discharge curves of the N-TiO2(B) electrode at different rates. As can been seen that the electrode show a slope profile of the voltage–capacity relationship during both the charge and discharge state at different rates, which are in accordance with the CV curves (Fig. 4). Fig. 6b compares the cycling performance of N-TiO2(B) electrode activated at a low current density of 0.1C for 30 cycles and the freshly prepared electrode at a moderate rate of 2C. It is apparent that the reversible capacity of the freshly prepared N-TiO2(B) electrode without activation is about 81 mA h g−1, much lower than that of the activated electrode (175 mA h g−1). In addition, the retention ratios of the activated electrode and electrode without activation after 200 cycles are 93.4 and 83.2%, respectively, indicating the necessity of activation process at low current density.
To evaluate the resistance against electron transfer during the activation process, electrochemical impedance spectroscopy (EIS) measurements of the anatase TiO2 powder, TiO2(B), and N-TiO2(B) electrodes were also conducted. To maintain uniformity, EIS measurements were performed at full charge state after the 3rd discharge/charge cycle. Generally, the high-frequency semicircle and the semicircle in the medium-frequency region are attributed to the SEI layer and/or contact resistance, and the charge-transfer impedance on the electrode–electrolyte interface, respectively.37–39 The linear portion is designated to Warburg impedance which is attributed to the diffusion of sodium ion into the bulk of the electrode materials.37–39 According to the modified Randles equivalent circuit shown in the inset of Fig. 7, the charge-transfer resistance (Rct) of N-TiO2(B) electrode is 185.1 Ω, which is much lower than those of TiO2 powder electrode (708.7 Ω) and TiO2(B) electrode (456.3 Ω). In addition, the SEI resistance (Rs) of N-TiO2(B) electrode (8.1 Ω) is also lower than those of TiO2 powder (14.7 Ω) and TiO2(B) electrode (14.3 Ω), revealing better electronic and ionic conduction of N-TiO2(B) electrode. It is well-known that better electronic and ionic conduction during cycling means better electrochemical performance, which is consistent with the cycling performance of these electrodes at the same current density.
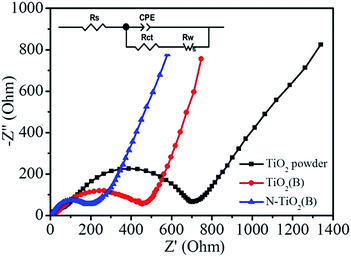 | ||
| Fig. 7 Electrochemical impedance spectroscopy (EIS) measurements of the anatase TiO2 powder, TiO2(B), and N-TiO2(B) electrodes. | ||
4. Conclusions
In conclusion, nitrogen-doped polycrystalline TiO2(B) nanorods with a nitrogen-doping amount of 1.23 atom% have been synthesized through hydrothermal reaction of anatase TiO2 powders (325 mesh) with concentrated NaOH solutions, ion exchange with (NH4)2CO3 and subsequent calcination at 350 °C. Due to the nanostructure design and nitrogen-doping, the N-TiO2(B) nanorods used as anode materials for sodium ion battery show a reversible specific capacity up to 224.5 mA h g−1 after electrochemical activation at low current density. Additionally, the activated N-TiO2(B) nanorods electrode exhibits good cycling stability (the capacity retention ratios after 200 cycles at 2C is 93.4%) and enhanced rate capability (110 mA h g−1 at 3.35 A g−1).Acknowledgements
Financial supports from Department of Education of Guizhou Province (No. KY[2016]106, KY[2016]009) and the Research Fund for the Doctoral Program of Tongren University (No. trxyDH1513) are greatly appreciated.References
- Z. Chen, I. Belharouak, Y. K. Sun and K. Amine, Adv. Funct. Mater., 2013, 23, 959–969 CrossRef CAS.
- M. Fehse and E. Ventosa, ChemPlusChem, 2015, 80, 785–795 CrossRef CAS.
- G.-N. Zhu, Y.-G. Wang and Y.-Y. Xia, Energy Environ. Sci., 2012, 5, 6652–6667 CAS.
- H. Kim, M.-Y. Cho, M.-H. Kim, K.-Y. Park, H. Gwon, Y. Lee, K. C. Roh and K. Kang, Adv. Energy Mater., 2013, 3, 1500–1506 CrossRef CAS.
- Y. Zhang, C. Wang, H. Hou, G. Zou and X. Ji, Adv. Energy Mater., 2016, 1600173 CrossRef.
- M. Zhen, S. Guo, G. Gao, Z. Zhou and L. Liu, Chem. Commun., 2015, 51, 507–510 RSC.
- H. Pan, Y.-S. Hu and L. Chen, Energy Environ. Sci., 2013, 6, 2338–2360 CAS.
- J. P. Huang, D. D. Yuan, H. Z. Zhang, Y. L. Cao, G. R. Li, H. X. Yang and X. P. Gao, RSC Adv., 2013, 3, 12593–12597 RSC.
- L. Wu, D. Bresser, D. Buchholz and S. Passerini, J. Electrochem. Soc., 2015, 162, A3052–A3058 CrossRef CAS.
- J. Lee, J. K. Lee, K. Y. Chung, H.-G. Jung, H. Kim, J. Mun and W. Choi, Electrochim. Acta, 2016, 200, 21–28 CrossRef CAS.
- A. Henry, N. Louvain, O. Fontaine, L. Stievano, L. Monconduit and B. Boury, ChemSusChem, 2016, 9, 264–273 CrossRef CAS PubMed.
- Y. Wu, X. Liu, Z. Yang, L. Gu and Y. Yu, Small, 2016, 12, 3522–3529 CrossRef CAS PubMed.
- D. Yan, C. Yu, Y. Bai, W. Zhang, T. Chen, B. Hu, Z. Sun and L. Pan, Chem. Commun., 2015, 51, 8261–8264 RSC.
- J. Ni, S. Fu, C. Wu, J. Maier, Y. Yu and L. Li, Adv. Mater., 2016, 28, 2259–2265 CrossRef CAS PubMed.
- S.-T. Myung, N. Takahashi, S. Komaba, C. S. Yoon, Y.-K. Sun, K. Amine and H. Yashiro, Adv. Funct. Mater., 2011, 21, 3231–3241 CrossRef CAS.
- W. Zhuang, L. Lu, X. Wu, W. Jin, M. Meng, Y. Zhu and X. Lu, Electrochem. Commun., 2013, 27, 124–127 CrossRef CAS.
- Y. Li, Z. Wang and X.-J. Lv, J. Mater. Chem. A, 2014, 2, 15473–15479 CAS.
- J.-C. Chang, W.-J. Tsai, T.-C. Chiu, C.-W. Liu, J.-H. Chao and C.-H. Lin, J. Mater. Chem., 2011, 21, 4605–4614 RSC.
- Y. Zhang, F. Du, X. Yan, Y. Jin, K. Zhu, X. Wang, H. Li, G. Chen, C. Wang and Y. Wei, ACS Appl. Mater. Interfaces, 2014, 6, 4458–4465 CAS.
- N. Shi, X. Li, T. Fan, H. Zhou, D. Zhang and H. Zhu, Int. J. Hydrogen Energy, 2014, 39, 5617–5624 CrossRef CAS.
- H. Kang, Y. Liu, K. Cao, Y. Zhao, L. Jiao, Y. Wang and H. Yuan, J. Mater. Chem. A, 2015, 3, 17899–17913 CAS.
- Y. Ge, H. Jiang, J. Zhu, Y. Lu, C. Chen, Y. Hu, Y. Qiu and X. Zhang, Electrochim. Acta, 2015, 157, 142–148 CrossRef CAS.
- C. Chen, Y. Wen, X. Hu, X. Ji, M. Yan, L. Mai, P. Hu, B. Shan and Y. Huang, Nat. Commun., 2015, 6, 6929 CrossRef CAS PubMed.
- H. Liu, K. Cao, X. Xu, L. Jiao, Y. Wang and H. Yuan, ACS Appl. Mater. Interfaces, 2015, 7, 11239–11245 CAS.
- J. C. Perez-Flores, C. Baehtz, A. Kuhn and F. Garcia-Alvarado, J. Mater. Chem. A, 2014, 2, 1825–1833 CAS.
- X. Gu, L. Li, Y. Wang, P. Dai, H. Wang and X. Zhao, Electrochim. Acta, 2016, 211, 77–82 CrossRef CAS.
- Z. Hong, J. Hong, C. Xie, Z. Huang and M. Wei, Electrochim. Acta, 2016, 202, 203–208 CrossRef CAS.
- H. A. Cha, H. M. Jeong and J. K. Kang, J. Mater. Chem. A, 2014, 2, 5182–5186 CAS.
- Y. Xu, E. Memarzadeh Lotfabad, H. Wang, B. Farbod, Z. Xu, A. Kohandehghan and D. Mitlin, Chem. Commun., 2013, 49, 8973–8975 RSC.
- S.-M. Oh, J.-Y. Hwang, C. S. Yoon, J. Lu, K. Amine, I. Belharouak and Y.-K. Sun, ACS Appl. Mater. Interfaces, 2014, 6, 11295–11301 CAS.
- L. Wu, D. Buchholz, D. Bresser, L. Gomes Chagas and S. Passerini, J. Power Sources, 2014, 251, 379–385 CrossRef CAS.
- L. Wu, A. Moretti, D. Buchholz, S. Passerini and D. Bresser, Electrochim. Acta, 2016, 203, 109–116 CrossRef CAS.
- H. Usui, S. Yoshioka, K. Wasada, M. Shimizu and H. Sakaguchi, ACS Appl. Mater. Interfaces, 2015, 7, 6567–6573 CAS.
- H. Xiong, M. D. Slater, M. Balasubramanian, C. S. Johnson and T. Rajh, J. Phys. Chem. Lett., 2011, 2, 2560–2565 CrossRef CAS.
- B. Enright, G. Redmond and D. Fitzmaurice, J. Phys. Chem., 1994, 98, 6195–6200 CrossRef CAS.
- D. Bresser, B. Oschmann, M. N. Tahir, F. Mueller, I. Lieberwirth, W. Tremel, R. Zentel and S. Passerini, J. Electrochem. Soc., 2015, 162, A3013–A3020 CrossRef CAS.
- K. Li, D. Su, H. Liu and G. Wang, Electrochim. Acta, 2015, 177, 304–309 CrossRef CAS.
- C. Nithya and S. Gopukumar, J. Mater. Chem. A, 2014, 2, 10516–10525 CAS.
- Y. Xiong, J. Qian, Y. Cao, X. Ai and H. Yang, J. Mater. Chem. A, 2016, 4, 11351–11356 CAS.
| This journal is © The Royal Society of Chemistry 2017 |

