 Open Access Article
Creative Commons Attribution 3.0 Unported Licence
AgNP and rhEGF-incorporating synergistic polyurethane foam as a dressing material for scar-free healing of diabetic wounds
Hyun Jun Choi†
a,
Thavasyappan Thambi†b,
Yool Hee Yangc,
Sa Ik Bangc,
Bong Sup Kimb,
Do Gi Pyun*a and
Doo Sung Lee *b
*b
aBiomedical Polymer R&D Institute, T&L Co., Ltd., Anseong 456-812, Republic of Korea. E-mail: pyundg@tnl.co.kr; Fax: +82-31-651-6256; Tel: +82-31-651-6255
bSchool of Chemical Engineering, College of Engineering, Sungkyunkwan University, Suwon 440-746, Republic of Korea. E-mail: dslee@skku.edu; Fax: +82-31-299-6857; Tel: +82-31-299-6851
cDepartment of Plastic Surgery, Samsung Medical Center, Sungkyunkwan University, School of Medicine, Seoul 135-710, Republic of Korea
First published on 28th February 2017
Abstract
Diabetic wounds are a major health concern in diabetic wound care management. Various factors influence the biological phases of diabetic wound healing, causing improper wound healing. To surmount the issues associated with diabetic wounds, designing dressing materials with antibacterial and re-epithelization properties has the potential to promote successful wound healing. Here we prepared synergistic dressing materials by incorporating silver nanoparticles (AgNP) and recombinant human epidermal growth factor (rhEGF) into polyurethane foams (PUFs) and tested these materials in an animal model of diabetic full-thickness wounds. The AgNP/rhEGF-PUFs dressings exhibited excellent absorbency, fluid retention, and fluid handling properties. The hydrophilic surface of the PUF dressing could potentially enhance its antibacterial properties against pathogenic bacteria. In vitro cytotoxicity tests demonstrated that the PUFs are cytocompatible, and the AgNP/rhEGF-PUFs significantly enhanced the growth of L-929 cells. More importantly, examination of in vivo wound healing in a full-thickness balb/c mice model demonstrated that the AgNP/rhEGF-PUFs could significantly accelerate the healing of diabetic wounds. Furthermore, histological examination demonstrated that the AgNP/rhEGF-PUF dressings successfully reconstructed the impaired epidermis, as demonstrated by proper re-epithelization and collagen deposition. The wounds treated with the AgNP/rhEGF-PUFs dressings were completely closed by day 20, while wounds treated with AgNP-PUFs and gauze only closed 87 ± 2.30 and 64 ± 4.76%, respectively. These results demonstrated that our synergistic AgNP/rhEGF-PUFs comprise a successful fusion of antibacterial and re-epithelization agents, with promising future applications in diabetic wound healing.
1. Introduction
Wound healing is a highly orchestrated biological process in the healthy human body in which healing is achieved through four highly programmed overlapping phases, including: hemostasis, inflammation, tissue formation, and remodeling.1,2 For successful wound healing, these phases must occur consecutively in a short time frame. However, in diabetic wound healing, various factors interrupt the healing process and the wound persists in an inflamed state for weeks to months, resulting in inadequate wound healing.2,3 In the first few moments after an injury, numerous intracellular and intercellular biological processes must be activated to restore tissue integrity and homeostasis.1 Diabetic foot ulcers (DFUs) are the leading cause of lower limb amputations, with more than 75![[thin space (1/6-em)]](https://www.rsc.org/images/entities/char_2009.gif) 000 new cases registered every year in the United States alone.4,5 A series of biophysiological mechanism failures, including decreased cell and growth factor responses that led to decreased peripheral blood flow and low angiogenesis, contribute to the lack of healing in persons with DFUs.6 In addition, microbes also contribute to wound infection and impair wound healing.7 Staphylococcus aureus (S. aureus) and Escherichia coli (E. coli) can both invade and colonize wounds easily, resulting in major infection that can impede the healing process and sometimes even result in internal infection.8 Furthermore, wound dehydration can impede moist environment and thus further delay wound healing.9 To surmount these limitations, substantial efforts are being made to develop wound dressing biomaterials for protecting damaged skin from infections and dehydration.
000 new cases registered every year in the United States alone.4,5 A series of biophysiological mechanism failures, including decreased cell and growth factor responses that led to decreased peripheral blood flow and low angiogenesis, contribute to the lack of healing in persons with DFUs.6 In addition, microbes also contribute to wound infection and impair wound healing.7 Staphylococcus aureus (S. aureus) and Escherichia coli (E. coli) can both invade and colonize wounds easily, resulting in major infection that can impede the healing process and sometimes even result in internal infection.8 Furthermore, wound dehydration can impede moist environment and thus further delay wound healing.9 To surmount these limitations, substantial efforts are being made to develop wound dressing biomaterials for protecting damaged skin from infections and dehydration.
Traditional dressing materials, including cotton wool, natural and synthetic bandages, and gauze, are sufficient for aiding the initial stage of wound healing.10 Such dressing materials are, however, dry and neither provide moist environment to wounds nor absorb wound exudates. The non-degradable nature of these dressings also makes them liable to adhere to the wound surfaces, thereby creating trauma upon removal. More recently, biomaterial-based natural polymer dressings such as chitosan dressings, bioengineered skin equivalents, and platelet-rich plasma treatments have been used to treat chronic wounds.11–14 However, in order to fine tune their mechanical properties and biodegradation rates, chitosan and other natural polymer dressings need to be blended with synthetic polymers.15,16 Thus, an ideal wound dressing material should be non-toxic and non-adherent to the wound, possess antibacterial activity, and be biocompatible. All of these properties are important for the material to accelerate wound healing. In order to address these issues, much attention has been paid to the development of dressing materials that can maintain the moist environment at the wound surface and absorb wound exudates, inhibit the passage of microorganisms, and accelerate wound healing by promoting re-epithelization. Most importantly, dressings should be removed easily without trauma.
Synthetic dressing materials based on poly(lactic acid) (PLA), poly(glycolic acid) (PGA), and poly(ε-caprolactone) (PCL) have a number of advantages with respect to their tunable physicochemical and biodegradation characteristics.17–19 Owing to these properties, these materials have been approved by the Food and Drug Administration (FDA) as surgical suture and drug delivery platforms.18 Although these homopolymers are not elastomers, their copolymers (e.g., PCLA and PLGA) display elastomeric properties, perhaps due to the phase separation of the crystalline and amorphous segments.20,21 However, certain characteristic features of these materials, including the generation of acidic degradation products, are not optimal for soft tissue engineering. Elastomeric materials generally possess favorable mechanical strength, elasticity, viscosity and biodegradability. Compared with biopolymeric materials, elastomeric materials have the advantages of easy handling, a long shelf-life, and easy preparation with well-defined structures. Elastomeric materials were the first synthetic polymers used in tissue engineering applications to mimic the extracellular matrix of soft tissues, including ligaments, tendons, cartilage, and blood vessels.17
In recent years, polyester urethanes have received special attention as surgical scaffolds for tissue engineering applications.22 Scaffolds prepared using polyurethanes have been shown to form non-toxic degradation products and stimulate cell migration and new tissue growth in vivo. The tunable physicochemical properties of polyurethanes also allow them to be processed in several forms, including sheets, sponges and foams, with the absorbency, thickness, and pore size able to be controlled according to the desired application.10 In particular, hydrophilic polyurethane foams (PUFs) are promising dressing materials owing to their constant maintenance of moist environment and their substantial ability to absorb of exudates.23–25 Incorporation of antimicrobial nanomaterials such as silver, copper oxide, zinc oxide or bio-glass into the wound dressing materials has been shown to be an effective strategy for the treatment of bacterial wound infection.7,11,24,26–30 In particular, nanometer-sized metal particles with a high surface area exhibited high antibacterial activity. Their antibacterial activity is attributed to their large contact area with bacteria, which presumably leads to the destruction of the bacterial membrane.31 However, these metal particles did not promote re-epithelialization; therefore, a combination of growth factors and metal particles in dressing materials may be needed for synergistic acceleration of the healing process.32,33 Therefore, we aimed to maximize diabetic wound healing by adding both recombinant human epidermal growth factors (rhEGF) as a growth factor and silver nanoparticles (AgNPs) as an antimicrobial agent to polyurethane foam (PUF). We then evaluated the in vivo wound healing efficiency of the prepared PUF samples by measuring wound contraction in a full-thickness wound model in diabetic balb/c mice and performing histological examinations on tissue samples from these mice.
2. Materials and methods
2.1. Materials
Toluene diisocyanate (TDI, an 80–20% mixture of the 2,4 and 2,6 isomers) was kindly supplied from BASF Company Ltd., Korea. Lutrol F-127 (BASF Korea., LTD) and glycerin (P&G Chemicals, Korea) were used as a surfactant and cross-linker, respectively. The ethylene oxide/propylene oxide random copolymer (EO/PO 75%/25%, Mn = 5000 g mol−1) and poly(ethylene glycol) (PEG, Mn = 1000 g mol−1) were obtained from KPX Chemicals Co., Ltd., Korea. The hydrophilic copolymers EO/PO and PEG were dehydrated at 80 °C for 24 h in a vacuum oven before use. All other chemicals were used as received. The residual water content of EO/PO and PEG was measured by Karl Fisher titration. Copolymers were used for synthesis when the residual water content was less than 0.01 wt%. Antimicrobial silver nanoparticles (AgNPs) were prepared by electric explosion of wire (EEW) in liquid. Recombinant human EGF (rhEGF) was purchased from BIO-FD&C Co., Ltd., Korea. Breathable polyurethane film (AIDFIL-20FC, thickness, 20 μm) was purchased from Pion-Tech Co., Ltd., Korea.2.2. Synthesis of the isocyanate-terminated polyurethane (PU) copolymer
The PU copolymer was synthesized according to our previously reported procedure, with slight modifications.24,25 In brief, TDI-80 was charged into a four-neck round-bottom flask equipped with a mechanical stirrer and reflux condenser, and then heated to 60 °C. Afterwards, a polyol mixture, prepared by mixing EO/PO with PEG, was added dropwise under a nitrogen atmosphere. The resulting mixtures were vigorously stirred for 6 h at 70 °C until the NCO group content reached 5%, which was determined by the titration method using di-n-butylamine.2.3. Preparation of AgNP and rhEGF-incorporating PUF (AgNP/rhEGF-PUF)
The AgNP/rhEGF-PUF was made by separately preparing an aqueous phase and an organic phase, mixing both phases at room temperature, and pouring the mixture into a mold. The aqueous phase was prepared by dissolving and dispersing glycerin, Lutrol F-127, and rhEGF in distilled water. The final concentrations of these constituents in the aqueous phase were 3 wt% of Lutrol F-127, 41 wt% of glycerin, and 56 wt% of distilled water. rhEGF was added at a concentration of 4.3 mg per 50 g of the aqueous phase. The organic phase was prepared by adding AgNP to the PU polymer. The organic phase was added to the aqueous phase (50 wt%) in a dispensing and mixing at room temperature. The two phases were agitated at 4000 rpm for approximately 15 s. The resulting mixture was poured into a rectangular hexahedral aluminum mold (internal size of 10 cm × 10 cm × 0.2 cm), after which the mold was covered by a breathable PU film (thickness, 20 μm). The mixture was then allowed to react for 10 min. After this incubation, the temperature of the mold was approximately 35 °C. The AgNP/rhEGF-PUF was separated from the mold at 10 min after the resulting mixture was poured into the mold. The amount of liquid poured into the mold was carefully controlled to maintain the same density (210 kg m−3) for all samples. The resulting AgNP/rhEGF-PUF material was cut into 10 cm × 10 cm squares, packaged, sterilized by ultraviolet light, and refrigerated until testing.2.4. Characterization of the AgNP/rhEGF-PUFs
2.5. Extraction of PUFs
Test samples were extracted in Dulbecco's Modified Eagle's Medium (DMEM) at 37 °C for 24 h according to the ISO 10993-5 and ISO 10993-12 protocols. Briefly, the test sample was mixed with culture medium (DMEM) (1 g/10 mL) and incubated in Pyrex bottles (Pyrex, USA) at 37 °C for 24 h in an SI-300R shaker (JeioTech, Korea), thus forming the extraction medium. This ratio was above the absorptive capacity of the test sample. Culture medium was used as a negative control and was incubated under same conditions. Samples were prepared under sterile conditions, and extra care was taken to avoid cross-contamination.2.6. Cell culture
The cytotoxic effects of the PUFs were evaluated in the mouse-derived fibroblast cell line L-929 (NCTC Clone 929). Briefly, L-929 cells were grown in DMEM supplemented with 10% fetal bovine serum (FBS; Hyclone, USA) and 1% penicillin–streptomycin (Gibco-BRL, USA) at 37 °C in a humidified atmosphere containing 5% CO2. Once adhered, cells were harvested through trypsin-EDTA treatment. Cells were then seeded in 96-well cell culture plates (TPP, Switzerland) at a density of 1 × 10⁴ cells per well. After 24 h, the culture medium was replaced with either fresh DMEM (negative control) or the DMEM extract of the test sample in. Cells were then further incubated for 24 h.2.7. In vitro cytotoxicity
The cytotoxicity of the PUFs was evaluated in vitro using a 3-(4,5-dimethyl-2-thiazolyl)-2,5-diphenyl tetrazolium bromide (MTT) assay. This assay is based on the reductive cleavage of MTT (yellow crystals) to formazan (purple crystals) by mitochondrial dehydrogenase.38 In brief, MTT stock solution in phosphate-buffered saline (PBS, pH 7.4, 5 mg mL−1) was added to each well to reach a final concentration of 0.5 mg mL−1. After 4 h, unreacted MMT was removed and the insoluble formazan crystals were dissolved in 100 μL of dimethyl sulfoxide. The absorbance of each well was then measured at a wavelength of 540 nm using a microplate reader (ELx 800, Bio-tex, USA). Cells that were not treated with test sample extract were used as controls. The relative cell viability (%) was calculated using the following equation:| Cell viability (%) = absorbance of samples/absorbance of control × 100 |
2.8. In vitro antimicrobial test
The antimicrobial activity of AgNP-incorporating PUFs was tested by an inhibition zone test.39 Antibacterial activity was assessed against Staphylococcus aureus (ATCC 25923, Gram-positive bacterium) and Escherichia coli (ATCC 35218, Gram-negative bacterium). For the assays, the PUFs were cut into discs (1.5 cm in diameter), spread onto an agar plate, and incubated for 24 h at 37 °C. Then, the diameter of the inhibition zone was measured. To ensure that the PUF did not have any inherent antibacterial effects, unincorporated PUF was used as a control. The plates were examined, and each zone was measured three times. The presence of a “no growth” around the sample indicated that the silver ions had leached from the sample. Larger zones corresponded to greater silver ion leaching.2.9. In vivo study
2.10. Histologic analysis
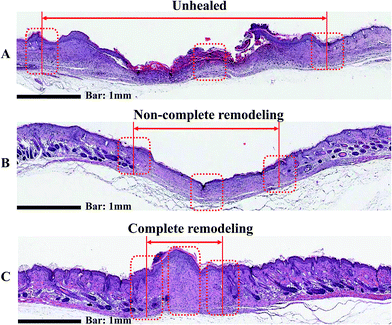
On day 20, three mice from each group were sacrificed. Biopsied tissue sections were fixed with 10% formalin and embedded in paraffin. Skin tissues samples were cut into 4 μm sections for histopathological examination by hematoxylin and eosin (H & E) staining. The stained sections of each skin tissue sample were then examined under a light microscope.2.11. Statistical analysis
Experimental results are presented as means ± standard deviations of the mean. Significance was analyzed via the one-way ANOVA test.3. Results and discussion
3.1. Physicochemical characterization of PUFs
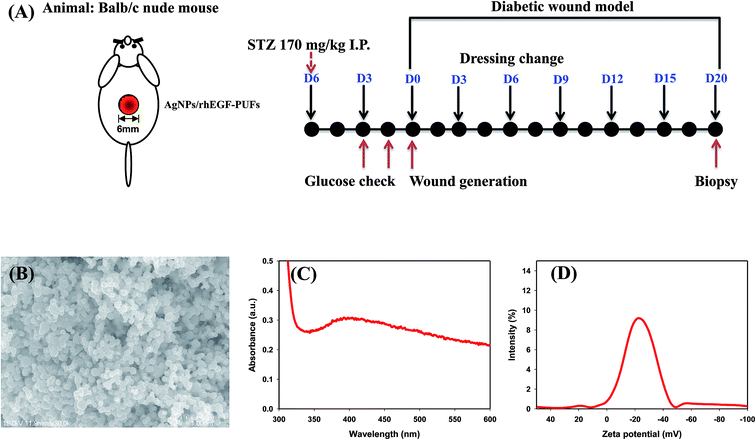
The physicochemical properties of AgNPs, prepared using the EEW method, were shown in Fig. 1B–D. SEM images demonstrated that the AgNPs are spherical in shape; and the average size of AgNPs was found to ∼90 nm in diameter. The absorption spectrum of AgNPs supports the existence of silver in its colloidal form led to the appearance of the characteristic peak at ∼400 nm. This characteristic peak is attributed to the surface plasmon resonance of colloidal silver. The zeta potential of pristine AgNPs was −23.44 mV, which indicated the anionic surface of AgNPs. The anionic nature of the particle may effectively interact with PUFs by ionic interaction that may facilitate AgNPs loading.The FT-IR spectra of the PU copolymers and the PUFs, which were synthesized through the polyaddition polymerization reaction between TDI and polyols, are shown in Fig. 2. The isocyanate group in the PU copolymers was cross-linked using glycerin through urethane bond (–NH–CO–O–) formation. The peaks around 1540 cm−1 are caused by the amine groups (–NH bending) in the urethane linkage. The characteristic peaks at 1705 cm−1 and 1642 cm−1 were assigned to the –C![[double bond, length as m-dash]](https://www.rsc.org/images/entities/char_e001.gif) O group in the carbonyl and urethane linkages.40 The –CH vibration in the PEG group was observed at 2878 cm−1.41 The peak around 3365 cm−1 is caused by the amine group (–NH) in the urea linkage.42 For the PUFs, an –NCO peak was not observed around 2265 cm−1. The disappearance of the –NCO peak after reaction with the –OH group in glycerin and water indicates that the urethane and urea linkage was well-formed without an unreacted –NCO group.24
O group in the carbonyl and urethane linkages.40 The –CH vibration in the PEG group was observed at 2878 cm−1.41 The peak around 3365 cm−1 is caused by the amine group (–NH) in the urea linkage.42 For the PUFs, an –NCO peak was not observed around 2265 cm−1. The disappearance of the –NCO peak after reaction with the –OH group in glycerin and water indicates that the urethane and urea linkage was well-formed without an unreacted –NCO group.24
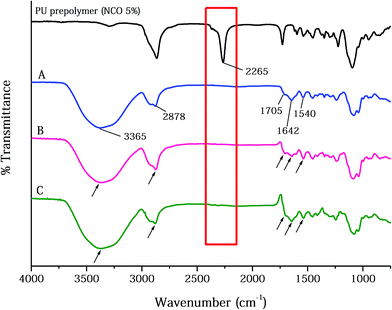 | ||
| Fig. 2 The FT-IR spectra of PU polymer, PUFs, and dressing materials: (A) PUF, (B) AgNP-PUF, and (C) AgNP-rhEGF-PUF. | ||
Various physical properties of the copolymers such as texture, pore size, and thickness affect the fluid absorption of PUF dressings.23 The absorbency of the PUFs was examined after immersing the PUFs into test solution A for 24 h (Fig. 3A). This analysis revealed that the PUF absorbency was 0.22 g cm−2. The high absorbency of PUFs is mainly due to the chemical structure of the PUFs. Generally, PUFs are composed of hydrophilic soft segments (PEG and EO in EOPO), which help to absorb water molecules. Furthermore, PUFs are non-woven, hydrophilic, flexible fibers arranged in a sponge-like structure with closed shells. Thus, it is feasible to retain liquids in the foam, because water molecules are confined in the cell window when external pressure is placed on the foam.43 Such high absorptive PUFs effectively absorb high levels of wound exudates, thereby reducing the risk of maceration.
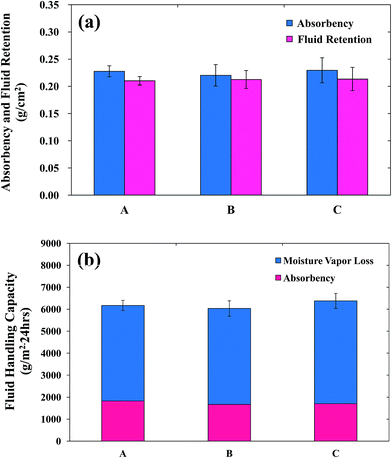 | ||
| Fig. 3 The absorbency, fluid retention, and fluid handling capacity of (A) PUF, (B) AgNP-PUF, and (C) AgNP/rhEGF-PUF. | ||
For optimal wound dressing, the fluid absorbed by the dressing no longer contacts the surrounding tissue or periwound area. Thus, avoidance of maceration is a critical factor for success.44 These complications are surmounted by the foam dressings, because foam dressing materials effectively retain absorbed fluid via “lateral wicking”. Thus, foam dressing materials with a high degree of fluid retention can prevent the passage of exudate to the surrounding tissue. Fig. 3a shows the fluid retention of the PUFs after 24 h of immersion in test solution. The fluid retention of the PUFs was approximately 0.21 g cm−2. This high fluid retention under compression prevents the exudate from reaching the edges of the wound and also prevents the absorbed exudate from being discharged back onto the wound surface or onto the edges of the wound under pressure.
The FHC is defined as the sum of the moisture vapor loss (MVL) and absorbency values (Fig. 3b). For optimal wound healing, the moisture content of the wound is carefully controlled, suggesting that the healing process is influenced by changes in the wound moisture content.45 In addition, wound dehydration may delay or impair wound healing, whereas excess fluids in the wound may cause maceration. Hence, to achieve effective wound healing, the applied dressing should possess high absorbency and a good MVL capacity. MVL is defined as the evaporation of a proportion of the aqueous component of wound fluid through the outer surface of the dressing to the external environment. Queen et al. found that an ideal water vapor transmission rate (2000–2500 gm−2 per day) could prevent excessive dehydration and the accumulation of exudates on the wound area.46 On the other hand, dressings with higher water vapor transmission rates resulted in rapid wound drying and produced scars, whereas dressings with lower water vapor transmission rates accumulated exudates that retarded or delayed the healing process. This delayed healing increased the risk of bacterial growth. The water vapor transmission rate of the PUFs was approximately 4000 gm−2 per day, which is close to the desired range. Therefore, PUFs are suitable dressing materials for wound healing.
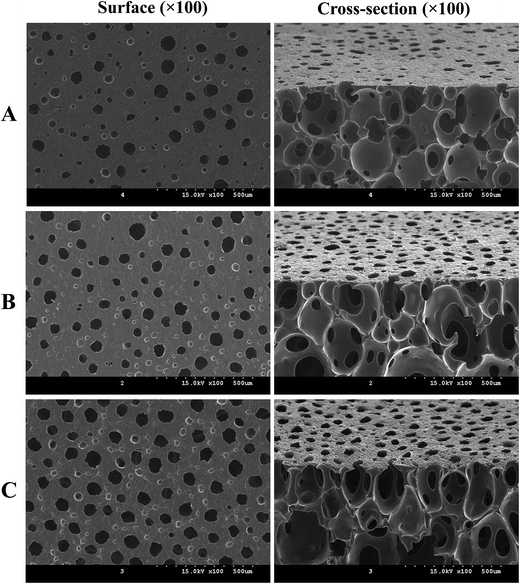
Morphological characteristics of wound dressings such as surface (wound contact layer) and cross-sectional area are important factors in wound healing because the foam pore size affects the generation of granulation tissue.47,48 Furthermore, the porous structure plays an important role in oxygen supply and the maintenance of wound exudates. Dressings with pore sizes ranging from 400 to 600 μm have exhibited granulation rates ranging from 76–100% in the healing of diabetic foot ulcers.49 In addition, surface contact between foam pores and wound beds has also been shown to stimulate cell proliferation. To observe the morphologies of the PUFs, the surface (wound contact layer) and cross-section views were analyzed using FE-SEM (Fig. 4). SEM images demonstrated that the PUFs exhibited a relatively uniform pore size. Interestingly, incorporation of AgNPs, rhEGF or a combination thereof did not significantly affect the porosity of the PUFs. In particular, for all formulations the surface pore sizes (wound contact layer) ranged from 200–400 μm. The microporous properties in the PUFs help to prevent the penetration of the newly formed epithelium into the foam. In addition, the pores can prevent the dressing from adhering to the wound bed, thereby avoiding secondary damage and yielding improved patient compliance. These properties of PUFs suggest that AgNPs/rhEGF-incorporating dressing materials are sufficiently thin for wound dressing, a finding that has potential in vivo properties.
The elemental composition of the AgNPs in the PUFs was analyzed using a FIB-SEM-associated energy-dispersive detector (Fig. 5). Cross-sectional FIB-SEM images of the AgNP-PUFs and AgNP/rhEGF-PUFs revealed a porous structure in which the AgNPs are embedded inside the pores. Moreover, EDS analysis of the AgNPs confirmed their identity by the existence of Ag, C, and O. AgNPs were not observed in the PUF to which AgNPs were not added. This analysis also revealed that the AgNPs were dispersed throughout the AgNP-PUFs and AgNP/rhEGF-PUFs dressings.
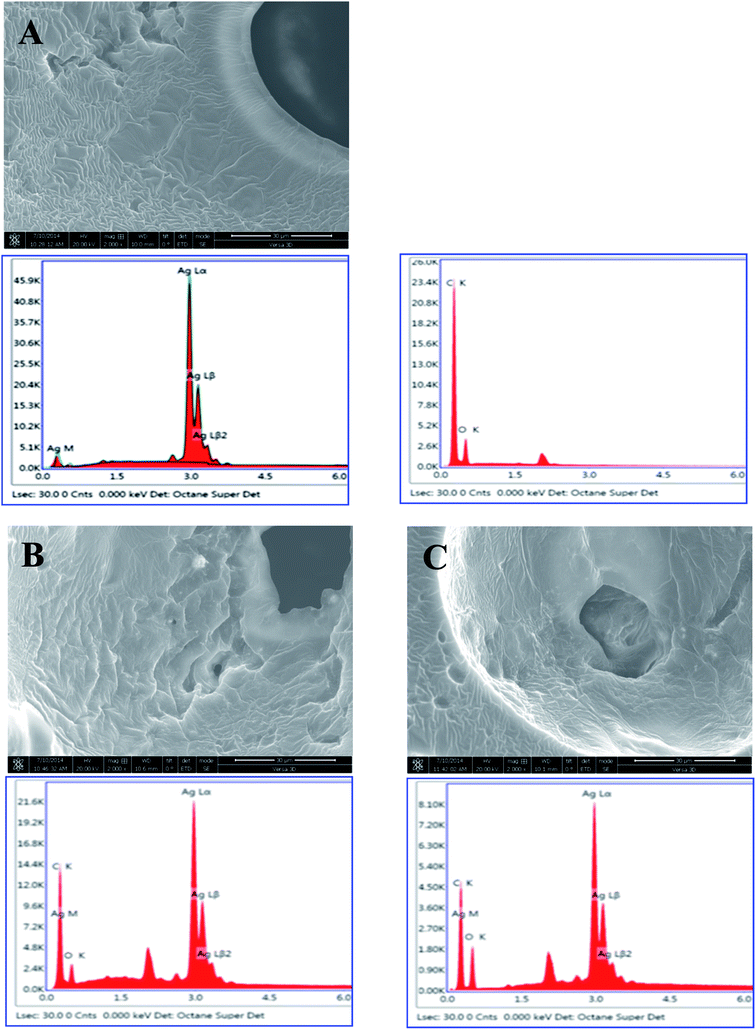 | ||
| Fig. 5 SEM images and EDS analysis of AgNP, (A) PUF, (B) AgNP-PUF, and (C) AgNP/rhEGF-PUF (magnification 2000×). | ||
3.2. Cytocompatibility test
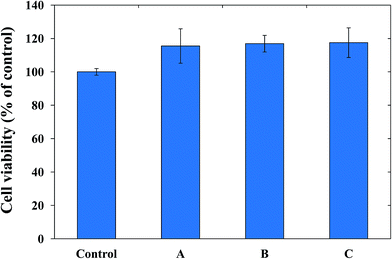
Aside from good physicochemical characteristics, biocompatibility is an important criterion to examine the feasibility of PUFs as a wound dressing materials. Cytocompatibility is often measured using the MTT assay, which quantifies the toxicity of given materials to the cell lines of interest. For our cytocompatibility analysis, we exposed L-929 cells to PUFs, AgNP-PUFs, and AgNP/rhEGF-PUFs (Fig. 6). The PUFs did not show obvious cytotoxicity to L-929 cells, indicating the cytocompatibility of the dressing materials. Interestingly, the AgNP-PUFs and AgNP/rhEGF-PUFs both enhanced the viability of L-929 cells. This enhancement could be due to the cytocompatibility of highly porous PUF dressings. To examine the morphology of the exposed cells, we also analyzed the morphology of PUF-treated L-929 cells by microscopy (Fig. 7). Normal L-929 mouse fibroblasts are large, spindle-shaped, adherent cells that grow as a confluent monolayer. Both control and experimental groups grew as uniform confluent monolayers and exhibited visible lamellipodia.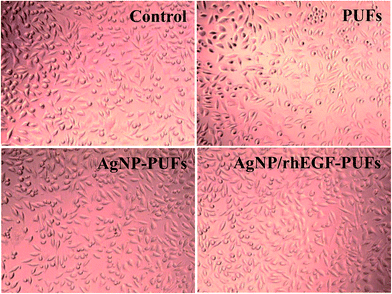 | ||
| Fig. 7 Microscopy images of the L-929 cells cultured control, (A) PUF, (B) AgNP-PUF, and (C) AgNP/rhEGF-PUF for 24 h. | ||
3.3. Antibacterial activity
Bacterial infections are the major cause of wound infection. Therefore, before applying the materials as wound dressings, we examined the antibacterial activity of the PUFs, AgNP-PUFs, and AgNP/rhEGF-PUFs using the disc diffusion method or the inhibition zone method.7,11 Fig. 8 shows the antibacterial activity of various PUFs against Staphylococcus aureus (S. aureus, Gram-positive) and Escherichia coli (E. coli, Gram-negative). The PUF exposed strains did not exhibit an inhibition zone, reflecting poor antibacterial activity. This finding is in agreement with previous reports.24,25 Interestingly, the inhibition zones of the AgNP-PUFs and AgNP/rhEGF-PUFs were significantly larger than that of the PUFs, indicating increased antibacterial activity. In general, exposure of AgNP/rhEGF-PUFs or AgNP-PUFs to wound fluids initially triggers the release of silver ions coated on the surface followed by sustained release of silver ions through diffusion controlled mechanism. It should be noted that esterase activity has been found in wound fluids, which allowed the biodegradation of PUFs via the hydrolysis of ester bonds.41,50 As a result, sustained biodegradation of PUFs triggered the release of AgNPs completely for effective wound healing. The inhibition zone diameters of the AgNP-PUFs and AgNP/rhEGF-PUFs were significantly higher against S. aureus than against E. coli. This difference in antibacterial activity is explained by the different cell walls of Gram-positive versus Gram-negative bacteria. In general, the cell wall of Gram-negative bacteria is composed of lipids, proteins, and lipopolysaccharides (LPS) that act as an effective protective barrier against antibacterial agents. In contrast, the cell wall of Gram-positive bacteria does not contain LPS. The outermost membrane of Gram-negative bacteria is composed of LPS, whereas the inner leaflet is composed of phospholipids. AgNPs exhibit activity by anchoring the cell wall of pathogens, which led to the damage of the cell membrane, resulting enhanced permeability of AgNPs to pathogens.51 The intracellularly delivered silver ions strongly interact with DNA and prevent the cell division and replication, which led to cell death. Hence, the cell death is directly proportional to number or concentration of nanoparticles. Higher content of AgNPs will potentially allow interaction with large number of cells when comparison with low content AgNPs group. Therefore, the high concentration of AgNPs in wound dressing exhibits the best antibacterial activity.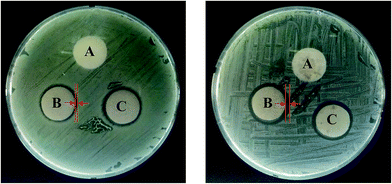 | ||
| Fig. 8 Inhibitory or antibacterial effect (A) PUF, (B) AgNP-PUF, and (C) AgNP/rhEGF-PUF against E. coli and S. aureus. | ||
3.4. In vivo diabetic wound healing
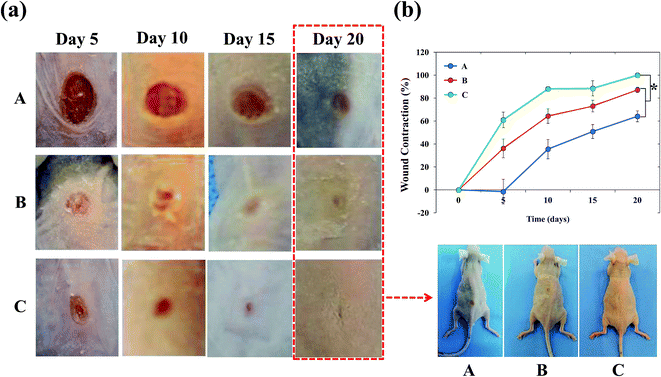
With the success of the in vitro tests, we next evaluated the efficacy of the dressing materials in diabetic balb/c mice. Bacterial infection is the major cause for slow and impaired wound healing in vivo. S. aureus and P. aeruginosa are common bacteria's found in infected wounds and are responsible for bacterial infection. Bacterial infections provoke elevation of proinflammatory cytokines including IL-1 and TNF-α and prolong the inflammatory phase, which led to the increased level of matrix metalloproteases (MMPs).2 MMPs are proteolytic enzymes that can degrade the extracellular matrix. As a consequence, new growth factors that appear during healing process are rapidly degraded. Furthermore, the continuous growth of bacteria in the infected wound occurs in the form of biofilms. Such biofilms shielded microenvironment are resistant to treatment and led to the slow healing of wound. Therefore, we aimed to maximize diabetic wound healing by using synergistic PUFs.Fig. 9a shows the macroscopic observations of three treatment groups: (A) gauze, (B) AgNP-PUFs, and (C) AgNP/rhEGF-PUFs. Gauze is an open-woven cotton fabric that is widely used in wound dressing as an absorbent and breathable pad. Gauze-dressed wound sites exhibited severe ulceration and edema even after 5 days, which indicated poor antibacterial activity of the dressing. However, groups treated with silver-containing dressings achieved good wound healing, even after 5 days. Importantly, the AgNP/rhEGF-PUF-treated group showed excellent healing after 5 days. We also noted that the regenerated skin after AgNP/rhEGF-PUF-treatment was smooth, with thick granulation tissue and extensive development of hair follicles, identical to that of normal skin. We propose that the excellent healing properties of the AgNP/rhEGF-PUFs dressings are due to its synergistic properties. Specifically, the Ag present in the dressing inhibits the bacterial infection in wound sites, whereas rhEGF accelerates the re-epithelization process.
The extent of wound contraction at different time points is shown in Fig. 9b. After 5 days, the groups treated with AgNP-PUFs and AgNP/rhEGF-PUFs achieved 31% and 60% wound closure, respectively. In contrast, the wounds of the gauze-treated group actually enlarged over time, reflecting the poor antibacterial properties of the dressing. The size of the wounds in the AgNP-PUF and AgNP/rhEGF-PUF-treated groups tends to decline over time. Strikingly, the wound healing rate of the AgNP/rhEGF-PUF-treated group was 100%, significantly higher than that of the AgNP-PUF-treated group (87 ± 2.30%) and the control group (64 ± 4.76%). This excellent wound healing may be attributable to the synergistic effect of the incorporated AgNPs and rhEGF. During the experimental period, the AgNP-PUF and AgNP/rhEGF-PUF dressings did not dissolve or adhere to the wound sites. Moreover, these dressings did not damage the newly regenerated epithelial tissues when removed.
3.5. Histological evaluation
Wound healing is a complex biological process in which tissue growth and regeneration occur in a four step process consisting of inflammation, hemostasis, migration, proliferation, and maturation.52 The histological analyses of wound tissue on day 20 are shown in Fig. 10. H & E staining of the gauze-treated group show obvious fibroblasts and endothelial cells. As a result, gauze-treated group did not develop fibrocytes or blood vessels, indicating poor wound healing. Interestingly, the groups treated with AgNP-PUFs and AgNP/rhEGF-PUFs clearly showed clear reconstructive venules and arterioles. This finding reflects the migration phase of healing, thus indicating non-complete wound healing. In addition, regeneration of skin appendages such as hair follicles and sebaceous glands, both of which can be observed in normal dermal tissue, was prominent in the AgNP-PUF and AgNP/rhEGF-PUF groups. It is particularly noteworthy that wounds treated with the AgNP/rhEGF-PUF dressings were completely cured, as demonstrated by the thickened epidermis on the wounds. These results indicate that the AgNP/rhEGF-PUFs dressings can effectively enhance skin regeneration on diabetic wounds by stimulating re-epithelialization and regeneration of skin appendages.4. Conclusion
In summary, we demonstrated that AgNP and rhEGF-incorporating synergistic PUFs can be used to heal diabetic wounds. The hydrophilic PUFs showed high porosity, excellent absorbency, and high fluid retention. The hydrophilic surface effectively absorbed wound exudates. Consequently, in vitro antibacterial tests demonstrated excellent antibacterial activities against pathogenic bacteria. Moreover, L-929 cells exposed to the AgNP/rhEGF-PUF dressing exhibited enhanced growth in vitro. In vivo wound healing experiments in mice with full-thickness wounds demonstrated that AgNP/rhEGF-PUF-treated wounds exhibited improved healing compared to gauze-treated wounds. This result was further supported by histological examination, which showed excellent re-epithelization and dense collagen formation. Overall, our AgNP/rhEGF-PUF dressings lay the groundwork for the treatment of diabetic wounds with AgNP and rhEGF combinations. The synergistic dressing materials used here are easily prepared, biocompatible, and can integrate well with tissue. Thus, these materials have potential applications beyond the treatment of diabetic wounds. For example, further possible applications of our technology include the treatment of burns, pressure ulcers, and venous ulcers.Acknowledgements
This work was supported by the Industrial Strategic Technology Development Program (10060069) funded by the Ministry of Trade, Industry & Energy (MI, Korea) and Basic Science Research Program through a National Research Foundation of Korea grant funded by the Korean Government (MEST) (20100027955 and NRF-2016R1A6A3A11933000).References
- G. C. Gurtner, S. Werner, Y. Barrandon and M. T. Longaker, Nature, 2008, 453, 314–321 CrossRef CAS PubMed.
- S. Guo and L. A. DiPietro, J. Dent. Res., 2010, 89, 219–229 CrossRef CAS PubMed.
- L. Yazdanpanah, M. Nasiri and S. Adarvishi, World J. Diabetes, 2015, 6, 37–53 CrossRef PubMed.
- C. K. Sen, G. M. Gordillo, S. Roy, R. Kirsner, L. Lambert, T. K. Hunt, F. Gottrup, G. C. Gurtner and M. T. Longaker, Wound Repair Regen., 2009, 17, 763–771 CrossRef PubMed.
- S. A. Castleberry, B. D. Almquist, W. Li, T. Reis, J. Chow, S. Mayner and P. T. Hammond, Adv. Mater., 2016, 28, 1809–1817 CrossRef CAS PubMed.
- P. Bao, A. Kodra, M. Tomic-Canic, M. S. Golinko, H. P. Ehrlich and H. Brem, J. Surg. Res., 2009, 153, 347–358 CrossRef CAS PubMed.
- P. T. Sudheesh Kumar, V.-K. Lakshmanan, T. V. Anilkumar, C. Ramya, P. Reshmi, A. G. Unnikrishnan, S. V. Nair and R. Jayakumar, ACS Appl. Mater. Interfaces, 2012, 4, 2618–2629 CAS.
- P. G. Bowler, B. I. Duerden and D. G. Armstrong, Clin. Microbiol. Rev., 2001, 14, 244–269 CrossRef CAS PubMed.
- J. P. E. Junker, R. A. Kamel, E. J. Caterson and E. Eriksson, Adv. Wound Care, 2013, 2, 348–356 CrossRef PubMed.
- R. Thavarajah, E. Joshua, U. K. Rao and K. Ranganathan, Journal of Oral and Maxillofacial Surgery, 2014, 13, 238–243 CrossRef PubMed.
- D. Liang, Z. Lu, H. Yang, J. Gao and R. Chen, ACS Appl. Mater. Interfaces, 2016, 8, 3958–3968 Search PubMed.
- E. R. Lorden, K. J. Miller, L. Bashirov, M. M. Ibrahim, E. Hammett, Y. Jung, M. A. Medina, A. Rastegarpour, M. A. Selim, K. W. Leong and H. Levinson, Biomaterials, 2015, 43, 61–70 CrossRef CAS PubMed.
- Y.-I. Shen, H. Cho, A. E. Papa, J. A. Burke, X. Y. Chan, E. J. Duh and S. Gerecht, Biomaterials, 2016, 102, 107–119 CrossRef CAS PubMed.
- H.-J. Park, J. Lee, M.-J. Kim, T. J. Kang, Y. Jeong, S. H. Um and S.-W. Cho, Biomaterials, 2012, 33, 9148–9156 CrossRef CAS PubMed.
- J.-A. Yang, J. Yeom, B. W. Hwang, A. S. Hoffman and S. K. Hahn, Prog. Polym. Sci., 2014, 39, 1973–1986 CrossRef CAS.
- R. Jayakumar, M. Prabaharan, P. T. Sudheesh Kumar, S. V. Nair and H. Tamura, Biotechnol. Adv., 2011, 29, 322–337 CrossRef CAS PubMed.
- M. C. Serrano, E. J. Chung and G. A. Ameer, Adv. Funct. Mater., 2010, 20, 192–208 CrossRef CAS.
- Y. Zhang, H. F. Chan and K. W. Leong, Adv. Drug Delivery Rev., 2013, 65, 104–120 CrossRef CAS PubMed.
- T. Thambi, J. H. Park and D. S. Lee, Biomater. Sci., 2016, 4, 55–69 RSC.
- N. Kamaly, B. Yameen, J. Wu and O. C. Farokhzad, Chem. Rev., 2016, 116, 2602–2663 CrossRef CAS PubMed.
- S. I. Jeong, B.-S. Kim, S. W. Kang, J. H. Kwon, Y. M. Lee, S. H. Kim and Y. H. Kim, Biomaterials, 2004, 25, 5939–5946 CrossRef CAS PubMed.
- S. A. Guelcher, Tissue Eng., Part B, 2008, 14, 3–17 CrossRef CAS PubMed.
- S. M. Lee, I. K. Park, Y. S. Kim, H. J. Kim, H. Moon, S. Mueller and Y.-I. Jeong, Biomater. Res., 2016, 20, 1–11 CrossRef CAS PubMed.
- D. G. Pyun, H. S. Yoon, H. Y. Chung, H. J. Choi, T. Thambi, B. S. Kim and D. S. Lee, J. Mater. Chem. B, 2015, 3, 7752–7763 RSC.
- D. G. Pyun, H. J. Choi, H. S. Yoon, T. Thambi and D. S. Lee, Colloids Surf., B, 2015, 135, 699–706 CrossRef CAS PubMed.
- G. Borkow, J. Gabbay, R. Dardik, A. I. Eidelman, Y. Lavie, Y. Grunfeld, S. Ikher, M. Huszar, R. C. Zatcoff and M. Marikovsky, Wound Repair Regen., 2010, 18, 266–275 CrossRef PubMed.
- W.-Y. Chen, H.-Y. Chang, J.-K. Lu, Y.-C. Huang, S. G. Harroun, Y.-T. Tseng, Y.-J. Li, C.-C. Huang and H.-T. Chang, Adv. Funct. Mater., 2015, 25, 7189–7199 CrossRef CAS.
- J. Markus, D. Wang, Y.-J. Kim, S. Ahn, R. Mathiyalagan, C. Wang and D. C. Yang, Nanoscale Res. Lett., 2017, 12, 46 CrossRef PubMed.
- R. Abbai, R. Mathiyalagan, J. Markus, Y.-J. Kim, C. Wang, P. Singh, S. Ahn, M. E.-A. Farh and D. C. Yang, Int. J. Nanomed., 2016, 11, 3131–3143 CrossRef CAS PubMed.
- P. Ganesan, H.-M. Ko, I.-S. Kim and D.-K. Choi, RSC Adv., 2015, 5, 98634–98642 RSC.
- M. Ishihara, V. Nguyen, Y. Mori, S. Nakamura and H. Hattori, Int. J. Mol. Sci., 2015, 16, 13973 CrossRef CAS PubMed.
- P. ten Dijke and K. K. Iwata, Nat. Biotechnol., 1989, 7, 793–798 CrossRef CAS.
- J. S. Choi, K. W. Leong and H. S. Yoo, Biomaterials, 2008, 29, 587–596 CrossRef CAS PubMed.
- P. Wu, A. C. Fisher, P. P. Foo, D. Queen and J. D. S. Gaylor, Biomaterials, 1995, 16, 171–175 CrossRef CAS PubMed.
- L. Ruiz-Cardona, Y. D. Sanzgiri, L. M. Benedetti, V. J. Stella and E. M. Topp, Biomaterials, 1996, 17, 1639–1643 CrossRef CAS PubMed.
- T. Thambi, S. Son, D. S. Lee and J. H. Park, Acta Biomater., 2016, 29, 261–270 CrossRef CAS PubMed.
- D. H. Kim, Y. K. Seo, T. Thambi, G. J. Moon, J. P. Son, G. Li, J. H. Park, J. H. Lee, H. H. Kim, D. S. Lee and O. Y. Bang, Biomaterials, 2015, 61, 115–125 CrossRef CAS PubMed.
- T.-J. Wu, H.-H. Huang, C.-W. Lan, C.-H. Lin, F.-Y. Hsu and Y.-J. Wang, Biomaterials, 2004, 25, 651–658 CrossRef CAS PubMed.
- A. GhavamiNejad, C. H. Park and C. S. Kim, Biomacromolecules, 2016, 17, 1213–1223 CrossRef CAS PubMed.
- H. J. Sim, T. Thambi and D. S. Lee, J. Mater. Chem. B, 2015, 3, 8892–8901 RSC.
- V. H. G. Phan, T. Thambi, H. T. T. Duong and D. S. Lee, Sci. Rep., 2016, 6, 29978 CrossRef PubMed.
- V. H. G. Phan, E. Lee, J. H. Maeng, T. Thambi, B. S. Kim, D. Lee and D. S. Lee, RSC Adv., 2016, 6, 41644–41655 RSC.
- J. L. Ryszkowska, M. Auguścik, A. Sheikh and A. R. Boccaccini, Compos. Sci. Technol., 2010, 70, 1894–1908 CrossRef CAS.
- Z. Fan, B. Liu, J. Wang, S. Zhang, Q. Lin, P. Gong, L. Ma and S. Yang, Adv. Funct. Mater., 2014, 24, 3933–3943 CrossRef CAS.
- M.-R. Hwang, J. O. Kim, J. H. Lee, Y. I. Kim, J. H. Kim, S. W. Chang, S. G. Jin, J. A. Kim, W. S. Lyoo, S. S. Han, S. K. Ku, C. S. Yong and H.-G. Choi, AAPS PharmSciTech, 2010, 11, 1092–1103 CrossRef CAS PubMed.
- D. Queen, J. D. S. Gaylor, J. H. Evans, J. M. Courtney and W. H. Reid, Biomaterials, 1987, 8, 367–371 CrossRef CAS PubMed.
- S. M. Lee, I. K. Park, Y. S. Kim, H. J. Kim, H. Moon, S. Mueller and Y.-I. L. Jeong, Biomater. Res., 2016, 20, 15 CrossRef PubMed.
- E. N. Arwert, E. Hoste and F. M. Watt, Nat. Rev. Cancer, 2012, 12, 170–180 CrossRef CAS PubMed.
- J. L. Payne and A. M. Ambrosio, J. Biomed. Mater. Res., Part B, 2009, 89, 217–222 CrossRef PubMed.
- V. H. G. Phan, T. Thambi, M. S. Gil and D. S. Lee, Polymer, 2017, 109, 38–48 CrossRef CAS.
- X. Deng, A. Yu Nikiforov, T. Coenye, P. Cools, G. Aziz, R. Morent, N. De Geyter and C. Leys, Sci. Rep., 2015, 5, 10138 CrossRef PubMed.
- C. C. Yates, D. Whaley, R. Babu, J. Zhang, P. Krishna, E. Beckman, A. W. Pasculle and A. Wells, Biomaterials, 2007, 28, 3977–3986 CrossRef CAS PubMed.
Footnote |
| † These authors contributed equally to this work. |
| This journal is © The Royal Society of Chemistry 2017 |

