 Open Access Article
Creative Commons Attribution 3.0 Unported Licence
Development of a harvesting technique for large-scale microalgal harvesting for biodiesel production
Shankha Koley,
Satyapal Prasad,
Sourav Kumar Bagchi and
Nirupama Mallick *
*
Agricultural and Food Engineering Department, Indian Institute of Technology Kharagpur, Kharagpur-721302, India. E-mail: nm@agfe.iitkgp.ernet.in; Fax: +91 3222 282244; Tel: +91 3222 283166
First published on 23rd January 2017
Abstract
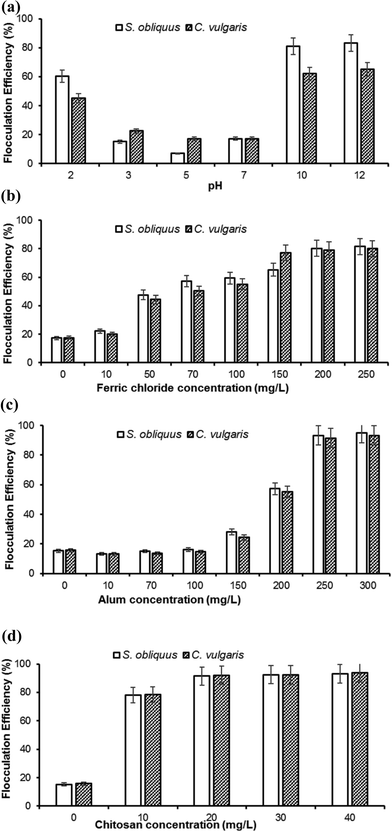
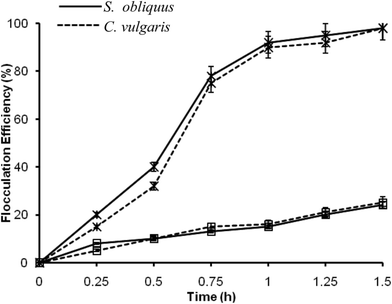
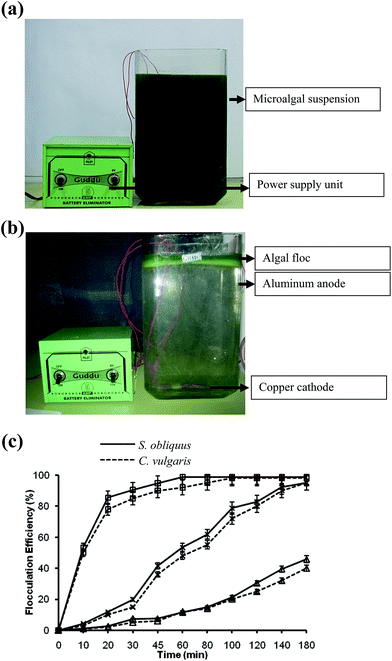
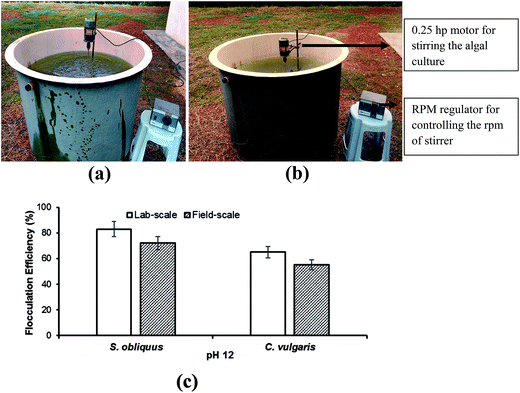
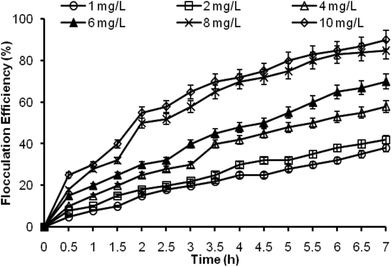
Harvesting imposes a major constraint in microalgal downstream processes and cost-effective production of various high value products. In this study, different harvesting techniques were assessed under a single domain to identify the most suitable one for large-scale harvesting of green microalgae for biodiesel purpose. In the laboratory, Scenedesmus obliquus showed a flocculation efficiency of 83.2% at pH 12 after 1 h. Maximum flocculation efficiencies of 80.2, 95 and 91%, respectively were observed for FeCl3 at 200 mg L−1, alum at 250 mg L−1 and chitosan at 20 mg L−1 after 1 h. Electro-flotation at 24 V and dissolved air flotation with 1 mg L−1 of alum also revealed flocculation efficiencies of 99 and 91% respectively, after 1 h. For Chlorella vulgaris, similar trends were also observed. Under field trials with 1000 L algal suspension, electro-flotation required a voltage of 60 V to achieve a flocculation efficiency of ∼90% after 24 h. Dissolved air flotation also showed a flocculation efficiency of same magnitude after 7 h, but with 10 mg L−1 of alum. Thus electro-flotation required a profoundly higher voltage with increasing culture volume, whereas for dissolved air flotation a much higher concentration of alum was entailed. Both the processes also depicted a significantly longer time period to achieve the required flocculation efficiency. On the other hand, pH-induced flocculation was found to be the most pertinent one for large-scale set-ups, and emerged to be efficient, cost-effective and eco-friendly as the supernatant can be reused as growth medium by re-supplementing the nutrients and adjusting the pH.
1 Introduction
In the current scenario, microalgal lipids have received much attention as a green and renewable resource with the potential to be transesterified to biodiesel, an alternative to the conventional diesel fuel. However, microalgal suspension being very dilute in nature makes the biomass harvesting highly expensive.1 The energy requirement for separation of microalgae by centrifugation process can go up to 1 MJ kg−1 of dry biomass.2 Report also shows that the harvesting cost of microalgae may go up to 30% of the total cost of biomass production,3 thus playing a major role in the price hike of microalgal products. Therefore, development of a suitable harvesting technique for microalgae carries immense importance, which must be energy efficient, cost-effective and non-polluting in nature.Microalgal biomass recovery faces many challenges. Due to the low biomass concentration relative to the volume of liquid of algal suspension, which typically varies between 0.3 to 5.0 g L−1 dry biomass,4,5 separation of biomass becomes a highly tedious task. For industrial applications, a high concentration, 300–400 g L−1 dry biomass is required, thus requiring a concentration up to 1000 fold. Moreover, the zeta potential of microalgal cells creates a stable suspension.6 There are other criteria which are to be considered in harvesting technologies along with the flocculation efficiency and the cost effectiveness. The most important one was the reusability of the culture medium, as it can reduce the water use along with diminishing the cultivation cost.
Various harvesting techniques are practiced these days, viz. centrifugation, filtration, gravity settling, flocculation, etc. Since centrifugation carries a high cost, it is not preferred for large scale installations.7 Flocculation has an added advantage over centrifugation as a large volume of cultures can be handled, and is both cost and energy efficient. Flocculation of microalgae can be achieved by the use of various inorganic salts, viz. Al2(SO4)3, AlCl3, Fe2(SO4)3, FeCl3, ZnSO4, ZnCl2, CaSO4, CaCl2, MgSO4, MgCl2, (NH4)2SO4, and NH4Cl,8 chitosan,9,10 cationic starch,11 etc. Flocculating microalgal species can also be used effectively to concentrate microalgae which are of non-flocculating in nature.12 Moreover, an electrolytic process of microalgal separation has also been found to be highly efficient.13 In this process, microalgal surface charges are neutralized as they move towards the anode, thereby allowing the microalgal cells to form aggregates followed by settling to the bottom. In recent years, it has been reported that dissolved air flotation (DAF) can be applied to harvest microalgae more efficiently than other settling methods.14 In this process, microalgal flocs are formed and are carried upwards with the air bubbles to form a layer at the surface, which can then be sieved out from the top.
A critical perusal of the available literature revealed that in spite of various harvesting techniques studied and are found efficient for laboratory scale cultures, none of those is defined yet for large-scale harvesting of microalgal biomass. Hence, in this investigation, a comparison of various existing harvesting techniques has been carried out with two microalgal species, viz. Scenedesmus obliquus and Chlorella vulgaris to find out an efficient method for microalgal harvesting feasible for large-scale exploitation, keeping in mind of non-polluting in nature and cost-effectiveness. This study also considers another most important aspect of the large-scale algal production system, i.e. the reuse of the supernatant after harvesting the microalgal biomass.
2 Materials and methods
2.1. Organisms and culture conditions
Axenic cultures of two chlorophycean microalgae, Scenedesmus obliquus (Trup.) Kutz. (SAG 276-3a, Gottingen, Germany) and Chlorella vulgaris (A 96, University of Madras, India) were used in the present investigation. The microalgal cultures were grown at 25 ± 2 °C; the photoperiod was maintained for 14 h at a light intensity of 75 μmol photon m−2 s−1 photosynthetically active radiation (PAR). Both the microalgae were cultured in the N 11 medium15 at pH 6.8. The N 11 medium constituents were 1.0 g L−1 KNO3, 0.083 g L−1 Na2HPO4·H2O, 0.052 g L−1 KH2PO4, 0.05 g L−1 MgSO4·7H2O, 0.01 g L−1 CaCl2·H2O, 1 mL Fe-EDTA stock (10 g chelate per liter) and 1 mL trace metal mix. The batch cultures were maintained in 250 mL Erlenmeyer flasks with 100 mL of N 11 medium. No air or CO2 was sparged to the cultures, and the cultures were hand shook 2–3 times daily to avoid settling. These batch cultures were referred to be control cultures.For laboratory scale studies, the test microalgae were grown in 4 L capacity haffkine flasks (maximum working volume: 2 L) under the above culture conditions. The experiments were conducted in triplicate. As the age of the cultures plays a major role in flocculation, 20–21 days old cultures were always used for the experiments. Experiments were conducted by transferring the cultures into 1 L glass cylinders (height 45 cm, Borosil made) maintaining the same optical density (O.D. at 540 nm: 1.20 ± 0.02) at the initiation of the experiment. The initial biomass concentration was maintained at 1 g L−1. Outdoor large-scale cultivation was carried out in raceway ponds (14 × 4 × 0.75 m). 16![[thin space (1/6-em)]](https://www.rsc.org/images/entities/char_2009.gif) 000 L culture volume was maintained in each raceway pond at 30 cm height, and the culture was aerated by the use of mechanical paddle wheels. This was used for large-scale studies. The age of the cultures (20–21 days) was also maintained for large-scale experiments.
000 L culture volume was maintained in each raceway pond at 30 cm height, and the culture was aerated by the use of mechanical paddle wheels. This was used for large-scale studies. The age of the cultures (20–21 days) was also maintained for large-scale experiments.
2.2. Flocculation studies at laboratory
The power consumption was calculated by the formula as given below18
2.3. Field-scale study
From the laboratory-scale experiments, three techniques, i.e. pH-induced flocculation by NaOH, DAF and electro-flotation were selected for field trials.For field-scale flocculation experiments, 1000 L tanks were used. The tanks were filled with 20–21 days old S. obliquus and C. vulgaris cultures by directly pumping from the raceway ponds. NaOH solution was added sufficiently to increase the solution pH. The cultures were stirred by the help of a stainless steel stirrer driven by a 0.25 hp motor, Fig. 3a and b. The tank was fitted with the stirrer in the middle with 3 stainless steel stirrer blades of 30 cm length. The assembly was attached to the motor with the help of a shaft and were used for stirring. The length of the stirrer blades was so chosen to provide uniform stirring to the whole suspension. The rpm of the motor was controlled by a rpm regulator at 80 rpm for 2 min and 20 rpm for 30 min. The culture was left to settle for 30 min and the optical density was recorded. At the beginning of each experiment, the optical density was recorded at 540 nm, and was referred as the initial optical density. To observe the effects of pH on flocculation, pH was set to the best value recorded for the laboratory-scale studies.
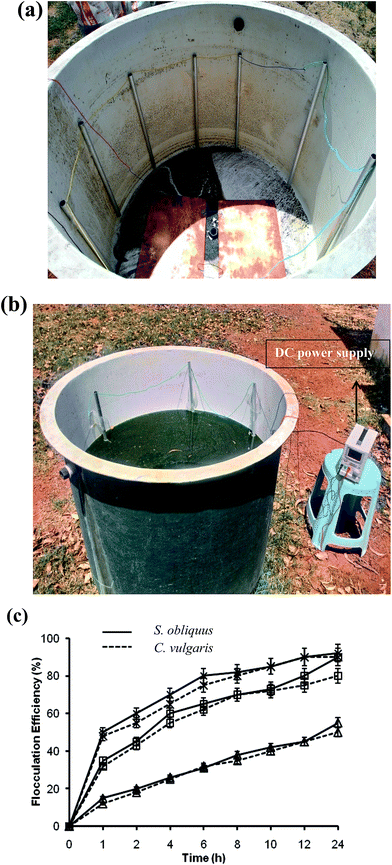
For electro-flotation experiments, aluminum pipes were placed along the inner surface of the tanks as anodes. The dimension of the aluminum pipes was 90 cm in length and 4 cm in diameter. The length of the anode was so chosen that it is immersed completely in the algal solution to provide better electrical conductivity in the solution. The anode to anode distance was 10 cm, and seven aluminum pipes were used as anodes for each tank. Two copper plates of 1000 cm2 were placed at the bottom of each tank to act as cathodes. The large surface area of the copper plates provide better flow of microbubbles. The voltage was varied by a DC power supply (Metravi, India), and the current was maintained at 2 A (Fig. 4a and b).
Dissolved air flotation was carried out with the help of two compressor pumps of 80 psi pressure (Rockyvac 320, Tarsons, India) for each tank. One pump was connected to the finely perforated air sparger with micro openings for sparging micro bubbles into the experimental tank. The saturation pressure was maintained at 75 psi. The other pump was connected to a vessel containing the flocculant. The flocculant was sparged into the tanks slowly. The flocculated microalgae formed a layer at the top of the tank which were sieved out.
2.4. Determination of flocculation efficiency
Flocculation efficiency varies with the variation in the sampling height. Therefore, the sampling height was maintained at 10 cm from the bottom for all sets of experiments. For laboratory-scale studies, the cylinders were graduated with the help of a stainless steel ruler, and 10 cm height was marked along the side of the cylinders. At different time intervals, an adequate amount of supernatant was pipetted out from the top of the cylinder from the above-mentioned height. For large-scale experiments the sampling height was also maintained at 10 cm. The optical density was recorded in a Lambda 25S UV-VIS spectrophotometer (Perkin Elmer, USA) at a wavelength of 540 nm. The initial as well as all the observations down the time-course of study were recorded. The flocculation efficiency was determined as follows:| Flocculation efficiency (%) = (1 − A/B) × 100 |
2.5. Lipid extraction from algal samples
Bligh and Dyer19 protocol using chloroform and methanol as solvents was followed for total lipid extraction from the algal samples (Pl. refer to Mandal and Mallick20 for details). Lipid content was expressed as % dry cell weight (dcw). The weight of the biomass obtained from the control set-up was taken into account for calculating the lipid yield, as the biomass concentration of all setups was approximately same for the experiments. This was to avoid the presence of the flocculants which might interfere in the biomass yield.To get a clear-cut evidence of various harvesting techniques on lipid recovery, experiments were also conducted in nitrogen- and phosphorus-starved cultures, as both the conditions were reported to stimulate lipid accumulation in microalgae profoundly. For nitrogen starvation, the test microalgae were grown in the N 11 medium by substituting KNO3 by equimolar concentration of KCl. Similarly, KH2PO4 and Na2HPO4·H2O of the medium were substituted by equimolar concentrations of KCl and Na2SO4, respectively to achieve P starvation.
2.6. Nutrients analyses of the supernatant of pH-induced flocculation experiments
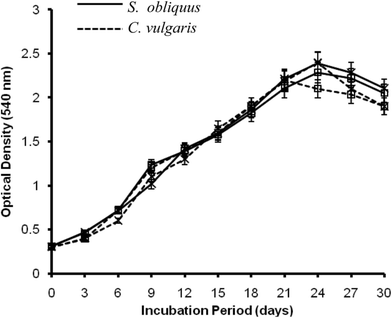
The supernatant obtained after the pH-induced flocculation by NaOH, was siphoned out and the pH was normalized with the addition of 1 N HCl. The nutrient concentrations were analyzed using the following protocols. The nitrate concentration was estimated following Nicholas and Nason.21 The orthophosphate concentration was measured using the stannous chloride method of APHA.22 All other nutrients, viz. potassium, magnesium, sodium, calcium, zinc and copper concentrations were analyzed by Atomic Absorption Spectroscopy (Perkin Elmer A Analyst 800 Atomic Absorption Spectrophotometer, USA). The concentration of sodium was estimated by the use of Ion Chromatography (Metrohm Compact IC Flex Ion Chromatograph, Switzerland). Fresh nutrients were supplemented accordingly to reach the original medium composition. Micronutrients were also re-supplemented, and the growth pattern of both the test microalgae was studied and compared with the growth curves obtained under the original N 11 medium.2.7. Statistical analysis
The reproducibility of the results was checked by repeating the experiments up to three times. Duncan's new multiple range test (DMRT) was used for statistical analysis with MSTAT-C software (Plant and Soil Sciences Division, Michigan State University, USA).3 Results and discussion
3.1. Harvesting experiments at laboratory scale
According to Molina et al.,24 cations played a vital role in flocculation, and the Mg2+ ions present in the medium was converted into magnesium hydroxide precipitates at higher pH. Magnesium hydroxide with its positive superficial charges could attract the negative surface charges of microalgae and formed a milky layer coating around the microalgal cells. The loss of negative surface charges did not allow the microalgal cells to repel from each other and flocs were formed. This lead to flocculation and due to the action of gravity settled down to the bottom of the surface.25 The difference in flocculation efficiencies in both the microalgal species can be explained by their structural differences, as C. vulgaris cells are unicellular, whereas the S. obliquus cells are joined together in a number of 2–4. Thus, it can be inferred that the unicellular nature of C. vulgaris cells helps them to stay suspended in the medium in a better way than S. obliquus.
Alum concentration was varied from 0 to 300 mg L−1. The flocculation efficiency reached above 90% at 250 mg L−1 of alum after 1 h for both the test microalgae (Fig. 1c). Chen et al.26 recorded a flocculation efficiency 93% with 300 mg L−1 alum for the microalga Scenedesmus sp. Earlier report also depicted that at a lower biomass concentration of 0.25 g L−1 with a flocculant dose of 115 mg L−1 alum, 85% flocculation efficiency was achieved for the same microalga.29 The mechanism of flocculation by the alum is that aluminum hydroxide is formed while adding alum to the medium. The positively charged aluminum ions cause neutralization of surface (negative) charges of algae, which brings the individual cells to come together to form flocs, and thus settle down to the bottom.30
| Name of the microalga | Method | Condition | Lipid contentb (% dcw) | ||
|---|---|---|---|---|---|
| Control | N-starved | P-starved | |||
| a Note: values are means ± standard deviations of three independent observations. Values superscripted by ‘a’ symbolize they are not significantly different from each other (P > 0.05, DMRT). For all the processes the maxima values were considered. Separate analysis was done for each column and each microalga.b Total lipids were extracted after completion of 1 h of different flocculation experiments. | |||||
| S. obliquus | Control | N 11 medium | 11.51 ± 1.21a | 41.52 ± 3.17a | 29.53 ± 2.15a |
| pH-Induced flocculation by NaOH | pH 12 | 11.62 ± 0.89a | 40.81 ± 3.02a | 28.35 ± 28.21a | |
| FeCl3-induced flocculation | 200 mg L−1 | 11.52 ± 1.15a | 41.23 ± 4.14a | 29.15 ± 2.25a | |
| Alum-induced flocculation | 250 mg L−1 | 10.93 ± 0.91a | 40.51 ± 3.08a | 28.92 ± 2.31a | |
| Chitosan-induced flocculation | 20 mg L−1 | 11.24 ± 1.24a | 39.56 ± 3.19a | 29.31 ± 2.10a | |
| Dissolved air flotation | With alum (1 mg L−1) | 10.91 ± 1.05a | 40.22 ± 4.01a | 29.41 ± 2.05a | |
| Without alum | 10.82 ± 1.32a | 41.63 ± 3.20a | 30.13 ± 2.14a | ||
| Electro-flotation | 24 V | 10.52 ± 1.41a | 41.53 ± 3.41a | 28.41 ± 2.24a | |
| C. vulgaris | Control | N 11 medium | 12.13 ± 1.32a | 42.14 ± 3.25a | 31.72 ± 2.26a |
| pH-Induced flocculation by NaOH | pH 12 | 12.44 ± 1.32a | 42.13 ± 3.12a | 32.13 ± 2.27a | |
| FeCl3-induced flocculation | 150 mg L−1 | 12.14 ± 1.21a | 42.91 ± 3.45a | 32.40 ± 2.35a | |
| Alum-induced flocculation | 250 mg L−1 | 12.21 ± 1.14a | 41.50 ± 3.31a | 31.91 ± 2.42a | |
| Chitosan-induced flocculation | 20 mg L−1 | 13.13 ± 1.21a | 41.52 ± 3.28a | 32.71 ± 2.35a | |
| Dissolved air flotation | With alum (1 mg L−1) | 12.23 ± 1.12a | 42.81 ± 4.18a | 32.15 ± 2.17a | |
| Without alum | 12.21 ± 1.04a | 41.73 ± 3.24a | 31.51 ± 2.24a | ||
| Electro-flotation | 24 V | 11.82 ± 1.12a | 42.21 ± 3.19a | 31.11 ± 2.31a | |
Table 2 compares the flocculation efficiency, flocculant dose/kg harvested biomass, and the costs incurred with different techniques. In case of ferric chloride and alum, although the flocculation efficiency was found to be high enough and the flocculants bulk prices were notably low, the required doses were profoundly high. Thus, with the high concentrations of ferric chloride and alum, the nutritive value of the supernatant (medium) was essentially lost. Moreover, the use of such high concentrations of inorganic chemicals was not environment friendly, thus made them incongruous for large-scale operation. With chitosan, high flocculation efficiency was also recorded. However, the price of this cationic polymer was found to be considerably high (1 g of chitosan costs 2 US $, HiMedia Bioscience & Laboratory Chemicals, India; bulk price of chitosan was 300 US $ for 1 kg, http://www.alibaba.com), and therefore, it would increase the cost of harvesting significantly, thus seems to be not a feasible approach for large-scale operation.
| Harvesting method | Flocculation efficiency (%) after 1 h | Flocculant dose/kg harvested biomass | Cost/kg biomass (in US $) |
|---|---|---|---|
| a Costs of laboratory grade chemicals (HiMedia Biosciences and Laboratory Chemicals Catalogue, India, 2015–16).b Costs of bulk purchase (http://www.alibaba.com). | |||
| pH-Induced flocculation by NaOH | 65–83 | 74–84 g | 0.63–0.72a |
| 0.02–0.03b | |||
| FeCl3-induced flocculation | 79–80 | 100–135 g | 1.6–2.2a |
| 0.48–0.64b | |||
| Alum-induced flocculation | 93–95 | 225–252 g | 3.0–3.3a |
| 0.07–0.08b | |||
| Chitosan-induced flocculation | 91–92 | 17–19 g | 16.2–18.0a |
| 5.4–6.0b | |||
| Dissolved air flotation | 90 | 0.892 g alum + electricity consumed by two pumps | 0.75a |
| Electro-flotation | 99 | 0.5 kW h power consumption + cost of electrodes (aluminum and copper) | 1.5a |
In case of DAF, the flocculation efficiency was also recorded to be high. Furthermore, the amount of alum used was relatively less in quantity. Therefore, the discarded medium (supernatant) with low alum concentration can be reused, which needs further examination. Electro-flotation also showed profoundly high flocculation efficiency, and had no negative impact on lipid recovery. In the case of pH-induced flocculation by NaOH, the flocculation efficiency was found to be comparatively low. However, the supernatant can be reused for microalgal cultivation after pH neutralization and nutrient re-supplementation, which would ultimately lead to a decrease in the production cost. It is also apparent from Table 2 that the cost of harvesting was the lowest for the pH-induced flocculation by NaOH. Hence, the above three techniques (pH-induced flocculation by NaOH, DAF and electro-flotation) were checked further at field level.
3.2. Harvesting experiments at field-scale
Although many researchers, nowadays, are focusing their attention to combat the problem of microalgal harvesting for low-cost biofuel production,16,36–38 a technique feasible for large-scale application is yet be comprehended. Therefore, there is a need to see the performance of the above selected flocculation techniques at field level.| Essential nutrients in the medium | Concentration before cultivation (mg L−1) | Concentration in the supernatant (mg L−1) |
|---|---|---|
| a Number of replicates: 3. | ||
| Potassium | 412.21 ± 10.10 | 102.14 ± 8.10 |
| Sodium | 27.14 ± 1.10 | 32.24 ± 1.30 |
| Nitrate | 595.12 ± 13.10 | 89.08 ± 4.41 |
| Phosphate | 102.04 ± 6.20 | 53.15 ± 5.20 |
| Magnesium | 4.91 ± 0.79 | 2.96 ± 0.84 |
| Iron | 0.21 ± 0.01 | 0.10 ± 0.02 |
| Copper | 0.021 ± 0.001 | 0.011 ± 0.001 |
| Zinc | 0.49 ± 0.05 | 0.060 ± 0.003 |
| Harvesting methods | Flocculation efficiency (%) after 1 h | Flocculant dose/kg harvested biomass | Cost/kg biomass (in US $) |
|---|---|---|---|
| a Costs of laboratory grade chemicals (HiMedia Biosciences and Laboratory Chemicals Catalogue, India, 2015–16).b Costs of bulk purchase (http://www.alibaba.com). | |||
| pH-Induced flocculation by NaOH | 60–75 | 50–62 g NaOH + 0.2 kW h power consumption | 0.50–0.53a |
| 0.04–0.05b | |||
| Dissolved air flotation | 24–30 | 30–35 g alum + electricity consumed by two pumps | 1.05–1.28a |
| 0.886–0.888b | |||
| Electro-flotation | 48–50 | 60–65 kW h power consumption + cost of electrodes (aluminum and copper) | 6.31–6.84a |
4 Conclusion
Various harvesting techniques were assessed under a single domain for efficient recovery of microalgal biomass for further processing. Using inorganic chemicals, high flocculation efficiency could be obtained within less time but the flocculants could not be separated from the medium, which would lead to water pollution. Chitosan could be used at low doses, but the price of this polymer was found to be prohibitive for large-scale operations. Among the three techniques studied at field level, pH-induced flocculation by NaOH emerged to be efficient, cost-effective and eco-friendly as the supernatant could be reused as growth medium by re-supplementing with essential nutrients and adjusting the pH.Acknowledgements
Financial support from Indian Council of Agricultural Research, New Delhi, India, and the research facilities provided by Indian Institute of Technology Kharagpur, India, are thankfully acknowledged. The first author wishes to acknowledge Miss Reeza Patnaik and Mr Sashi Sonkar, Ph.D. Scholars, Indian Institute of Technology Kharagpur, for helping in preparation of the manuscript.References
- J. R. Benemann, J. C. Weissman, B. L. Koopman and W. J. Oswald, Nature, 1977, 268, 19–23 CrossRef CAS.
- S. Sawayama, T. Minowa and S. Y. Yokoyama, Biomass Bioenergy, 1999, 17, 33–39 CrossRef CAS.
- E. M. Grima, E. H. Belarbi, F. G. A. Fernandez, A. R. Medina and Y. Chisti, Biotechnol. Adv., 2003, 20, 491–515 CrossRef.
- Y. H. M. Li, N. Wu and C. D. C. N. Lan, Biotechnol. Prog., 2008, 24, 815–820 CAS.
- B. Wang, Y. Li, N. Wu and C. Lan, Appl. Microbiol. Biotechnol., 2008, 79, 707–718 CrossRef CAS PubMed.
- E. W. Becker, Microalgae Biotechnology & Microbiology, Cambridge University Press, 1994, pp. 56–62 Search PubMed.
- L. Christenson and R. Sims, Biotechnol. Adv., 2011, 29, 686–702 CrossRef CAS PubMed.
- A. Papazi, P. Makridis and P. Divanach, J. Appl. Phycol., 2010, 22, 349–355 CrossRef CAS.
- J. Morales, J. De la Noue and G. Picard, Aquacultural Engineering, 1985, 4, 57–70 CrossRef.
- A. Lavoie and J. Noüe de la, J. World Maric. Soc., 2009, 14, 685–694 CrossRef.
- D. Vandamme, I. Foubert, B. Meesschaert and K. Muylaert, J. Appl. Phycol., 2010, 22, 525–530 CrossRef.
- S. Salim, R. Bosma, M. H. Vermuë and R. H. Wijffels, J. Appl. Phycol., 2011, 23, 849–855 CrossRef PubMed.
- R. Misra, A. Guldhe, P. Singh, I. Rawat, T. A. Stenstrom and B. Faizal, Bioresour. Technol., 2015, 176, 1–7 CrossRef CAS PubMed.
- C. Y. Chen, K. L. Yeh, R. Aisyah, D. J. Lee and J. S. Chang, Bioresour. Technol., 2011, 102, 71–81 CrossRef CAS PubMed.
- J. C. Soeder and A. Bolze, Physiol. Plant., 1981, 52, 233–238 CrossRef.
- T. Chatsungnoen and Y. Chisti, Algal Res., 2016, 13, 271–283 CrossRef.
- J. M. S Rocha, J. E. C. Garcia and M. H. F. Henriques, Biomol. Eng., 2003, 20, 237–242 CrossRef.
- S. Gao, M. Du, J. Tian, J. Yang, F. Ma and J. Nan, J. Hazard. Mater., 2010, 182, 827–834 CrossRef CAS PubMed.
- E. G. Bligh and W. J. Dyer, Can. J. Biochem. Physiol., 1959, 37, 911–917 CrossRef CAS PubMed.
- S. Mandal and N. Mallick, Appl. Microbiol. Biotechnol., 2009, 84, 281–291 CrossRef CAS PubMed.
- D. J. Nicholas and A. Nason, Methods in Enzymology III, Academic Press, New York, 1957, pp. 961–984 Search PubMed.
- American Public Health Association (APHA), Standard methods for the examination of water and waste water, Washington DC, USA, 20th edn, 1998, p. 1220 Search PubMed.
- Z. Wu, Y. Zhu, W. Huang, C. Zhang, T. Li, Y. Zhang and A. Li, Bioresour. Technol., 2012, 110, 496–502 CrossRef CAS PubMed.
- G. E. M. Molina, E. H. Belarbi and A. F. G. Fernandez, Biotechnol. Adv., 2003, 20, 491–515 CrossRef.
- G. A. Parks, Equilibrium concepts in natural water systems, Advances in Chemistry Series, American Chemistry Society, Washington, DC, 1967, p. 67 Search PubMed.
- L. Chen, C. Wang, W. Wang and J. Wei, Bioresour. Technol., 2013, 133, 9–15 CrossRef CAS PubMed.
- N. B. Wyatt, L. M. Gloe, P. V. Brady, J. C. Hewson, A. M. Grillet, M. G. Hankins and P. I. Pohl, Biotechnol. Bioeng., 2012, 109, 493–501 CrossRef CAS PubMed.
- B. Pawlak and J. Kopeć, Oceanologia, 1998, 40, 345–353 Search PubMed.
- D. Vandamme, I. Foubert, I. Fraeye and K. Muylaert, Bioresour. Technol., 2012, 124, 508–511 CrossRef CAS PubMed.
- V. M. Rwehumbiza, R. Harrison and L. Thomsen, Chem. Eng. J., 2012, 200/202, 168–175 CrossRef.
- N. Uduman, Y. Qi, M. K. Danquah, G. M. Forde and A. Hoadley, J. Renewable Sustainable Energy, 2010, 2, 012701 CrossRef.
- Y. Xu, S. Purton and F. Baganz, Bioresour. Technol., 2013, 129, 296–301 CrossRef CAS PubMed.
- B. Koopman and E. P. Lincoln, Agric. Wastes, 1983, 5, 231–246 CrossRef.
- X. Zhang, P. Amendola, J. C. Hewson, M. Sommerfeld and Q. Hu, Bioresour. Technol., 2012, 116, 477–484 CrossRef CAS PubMed.
- W. Zhou, L. Gao, W. Cheng, L. Chen, J. Wang, H. Wang, W. Zhang and T. Liu, Algal Res., 2016, 18, 7–14 CrossRef.
- J. E. Coons, D. M. Kalb, T. Dale and B. L. Marrone, Algal Res., 2014, 6, 250–270 CrossRef.
- K. Pirwitz, L. R. Struckmann and K. Sundmacher, Bioresour. Technol., 2015, 196, 145–152 CrossRef CAS PubMed.
- J. Liu, Y. Tao, J. Wu, Yi. Zhu, B. Gao, Y. Tang and A. Li, Bioresour. Technol., 2014, 167, 367–375 CrossRef CAS PubMed.
- D. G. Kim, H. J. La, C. Y. Ahn, Y. H. Park and H. M. Oh, Bioresour. Technol., 2011, 102, 3163–3168 CrossRef CAS PubMed.
| This journal is © The Royal Society of Chemistry 2017 |


