 Open Access Article
Preparation and characterization of sodium thiosulfate pentahydrate/silica microencapsulated phase change material for thermal energy storage
Chenzhen Liu,
Cui Wang,
Yimin Li and
Zhonghao Rao *
*
School of Electrical and Power Engineering, China University of Mining and Technology, Xuzhou 221116, China. E-mail: raozhonghao@cumt.edu.cn; Tel: +86 516 83592000
First published on 23rd January 2017
Abstract
Microencapsulated phase change materials (MicroPCM) were successfully fabricated by encapsulation of sodium thiosulfate pentahydrate (SoTP) as core with silica shell using sol–gel method. The chemical structure, phase analysis, surface morphology, thermal properties and thermal stability of the MicroPCM were tested using X-ray diffraction instrument (XRD), X-ray photoelectron spectroscopy (XPS), energy dispersive X-ray spectroscopy (EDX), Fourier-transform infrared spectroscopy (FTIR), scanning electron microscopy (SEM), transmission electron microscopy (TEM), differential scanning calorimetry (DSC) and thermogravimetric analyzer (TG), respectively. The effects of core/shell mass ratio, concentration of emulsifier and stirring rate on the morphology of MicroPCM were studied. In addition, the core/shell mass ratio impact on the latent heat, thermal stability and supercooling of MicroPCM were also tested. The results indicates that the MicroPCM have relatively spherical shape. The encapsulation ratio of MicroPCM decrease with the decrease of SoTP mass percentage. The thermal properties and supercooling degree have been greatly improved. The highest encapsulation ratio of the MicroPCM is 94.65%. The thermal conductivity of SoTP is improved from 0.6035 to 0.7718 W (m k)−1 after the encapsulation of SoTP with silica. Depending on all results, it can be concludes that the prepared SoTP/silica MicroPCM have great potential for being used in thermal energy storage applications.
1 Introduction
In recent years, phase change materials (PCM) have attracted more and more attention in thermal energy storage because they have high heat storage density and a nearly isothermal heat storage process.1,2 Up to now, plenty of researchers have reported various types of PCM, such as stearic acid, paraffin salt, hydrated and molten salts, which are available for various thermal applications.3,4 Along with the rapid development of thermal energy storage technology, PCM have been widely applied in the fields of energy-efficient building,5–7 solar energy utilization,8,9 thermal regulating fabric,10,11 battery thermal management system,12–15 waste heat recovery,16,17 and so on.Inorganic hydrated salt have large latent heat and high thermal conductivity compared with organic PCM.18 However, the application of inorganic hydrated salt is limited due to its decomposition, phase segregation and supercooling.19 In order to overcome the problems of inorganic hydrated salt, MicroPCM have received great attention for thermal energy storage in recent years.20,21 MicroPCM are tiny core–shell structure capsules, which have PCM core surrounded by a shell that prevents the PCM from leaking during the solid–liquid phase change process.22,23 The advantages of MicroPCM are as follows: preventing leakage of the melted PCM during the phase change process, increasing heat transfer area and controlling the volume change of PCM as phase change occurs.24,25
Although MicroPCM have been studied for years, many researchers focused on synthesizing MicroPCM with organic PCM as core materials.26 However, researches on MicroPCM with inorganic hydrated salt as core materials have been reported only in recent years. The inorganic MicroPCM with sodium phosphate dodecahydrate (DSP) as core and methyl methacrylate–ethyl acetate (PMMA) as shell were successfully fabricated by Huang et al.27 The melting temperature and enthalpy of the obtained MicroPCM were 51.51 °C and 142.9 J g−1, respectively. After that, Huang et al.28 also successfully synthesized MicroPCM of disodium hydrogen phosphate heptahydrate (HDHP)/PMMA. The obtained MicroPCM had a spherical shape with average of 6.8 μm in diameter. The melting temperature and enthalpy of the MicroPCM were about 51 °C and 150 J g−1, respectively. Moreover, the supercooling and thermal properties of HDHP were greatly improved after being encapsulated by PMMA.
Among the potential candidates of inorganic PCM for medium temperature thermal energy storage, SoTP is suited well because of its high heat storage capacity and low cost.29 However, the decomposition, phase segregation and supercooling of SoTP limit its practical application. Therefore, the MicroPCM technology is used to overcome the problems of SoTP in this paper.
In this paper, the MicroPCM with SoTP as core and silica as shell were synthesized by sol–gel method. The chemical structure, phase analysis, surface morphology, thermal properties and thermal stability of the MicroPCM were tested by using X-ray diffraction instrument (XRD), X-ray photoelectron spectroscopy (XPS), energy dispersive X-ray spectroscopy (EDX), Fourier-transform infrared spectroscopy (FTIR), scanning electron microscopy (SEM), transmission electron microscopy (TEM), differential scanning calorimetry (DSC) and thermogravimetric analyzer (TG), respectively. The effects of core/shell mass ratio, concentration of emulsifier and stirring rate on the morphology of MicroPCM were studied. In addition, the influence of core/shell mass ratio on the latent heat, thermal stability and supercooling of MicroPCM was also studied.
2 Experimental
2.1 Materials
SoTP (AR) was used as core and was purchased from Xilong chemical company. Tetraethyl silicate (TEOS) was used as shell-forming monomer. Cyclohexane and n-pentanol were used as suspending media. Sodium dodecyl sulfate (SDS) was used as emulsifier. 3-Aminopropyltriethoxysilane (APTS) was used as pH regulator. TEOS, cyclohexane, n-pentanol, SDS and APTS were of reagent grade and obtained from Sinopharm chemical reagent company. Deionized water was made by laboratory ultrapure water filter (China, Nanjing Qianyan instrument equipment co., LTD, RO).2.2 Preparation of the MicroPCM
The MicroPCM containing SoTP were prepared via sol–gel method. The basic recipes for all experiments are shown in Table 1. The preparation of the microcapsules was carried out according to the following procedure. Firstly, the mixture of sodium thiosulfate pentahydrate (SoTP) and 25 ml of deionized water were heated by using an electric-heated thermostatic water bath at a temperature of 60 °C until the SoTP totally dissolved. Secondly, the SoTP solution was added into 25 ml of cyclohexane at 60 °C under stirring drop by drop, followed by the addition of sodium dodecyl sulfate (SDS) and 5 ml of n-pentanol into the mixture and stirring for 20 min. As a result, a water/oil microemulsion was formed. Then, TEOS was added into the water/oil emulsion dropwise. Thirdly, the pH value of the emulsion was adjusted to 10 by adding 3-aminopropyltriethoxysilane (APTS), followed by stirring for 12 h. Finally, the obtained MicroPCM were centrifuged and washed with ethyl alcohol repeatedly and dried at 40 °C for 18 h.| Samples | SoTP | TEOS | SDS | Stirring rate | The mass ratio SoTP![[thin space (1/6-em)]](https://www.rsc.org/images/entities/char_2009.gif) : :![[thin space (1/6-em)]](https://www.rsc.org/images/entities/char_2009.gif) TEOS TEOS![[thin space (1/6-em)]](https://www.rsc.org/images/entities/char_2009.gif) : :![[thin space (1/6-em)]](https://www.rsc.org/images/entities/char_2009.gif) SDS SDS |
|---|---|---|---|---|---|
| S1 | 20 g | 8 g | 0.2 g | 600 rpm | 1![[thin space (1/6-em)]](https://www.rsc.org/images/entities/char_2009.gif) : :![[thin space (1/6-em)]](https://www.rsc.org/images/entities/char_2009.gif) 0.4 0.4![[thin space (1/6-em)]](https://www.rsc.org/images/entities/char_2009.gif) : :![[thin space (1/6-em)]](https://www.rsc.org/images/entities/char_2009.gif) 0.01 0.01 |
| S2 | 20 g | 8 g | 0.4 g | 600 rpm | 1![[thin space (1/6-em)]](https://www.rsc.org/images/entities/char_2009.gif) : :![[thin space (1/6-em)]](https://www.rsc.org/images/entities/char_2009.gif) 0.4 0.4![[thin space (1/6-em)]](https://www.rsc.org/images/entities/char_2009.gif) : :![[thin space (1/6-em)]](https://www.rsc.org/images/entities/char_2009.gif) 0.02 0.02 |
| S3 | 20 g | 8 g | 0.8 g | 600 rpm | 1![[thin space (1/6-em)]](https://www.rsc.org/images/entities/char_2009.gif) : :![[thin space (1/6-em)]](https://www.rsc.org/images/entities/char_2009.gif) 0.4 0.4![[thin space (1/6-em)]](https://www.rsc.org/images/entities/char_2009.gif) : :![[thin space (1/6-em)]](https://www.rsc.org/images/entities/char_2009.gif) 0.04 0.04 |
| S4 | 20 g | 8 g | 1.2 g | 600 rpm | 1![[thin space (1/6-em)]](https://www.rsc.org/images/entities/char_2009.gif) : :![[thin space (1/6-em)]](https://www.rsc.org/images/entities/char_2009.gif) 0.4 0.4![[thin space (1/6-em)]](https://www.rsc.org/images/entities/char_2009.gif) : :![[thin space (1/6-em)]](https://www.rsc.org/images/entities/char_2009.gif) 0.06 0.06 |
| S5 | 20 g | 8 g | 1.6 g | 600 rpm | 1![[thin space (1/6-em)]](https://www.rsc.org/images/entities/char_2009.gif) : :![[thin space (1/6-em)]](https://www.rsc.org/images/entities/char_2009.gif) 0.4 0.4![[thin space (1/6-em)]](https://www.rsc.org/images/entities/char_2009.gif) : :![[thin space (1/6-em)]](https://www.rsc.org/images/entities/char_2009.gif) 0.08 0.08 |
| S6 | 20 g | 4 g | 0.8 g | 600 rpm | 1![[thin space (1/6-em)]](https://www.rsc.org/images/entities/char_2009.gif) : :![[thin space (1/6-em)]](https://www.rsc.org/images/entities/char_2009.gif) 0.2 0.2![[thin space (1/6-em)]](https://www.rsc.org/images/entities/char_2009.gif) : :![[thin space (1/6-em)]](https://www.rsc.org/images/entities/char_2009.gif) 0.04 0.04 |
| S7 | 20 g | 6 g | 0.8 g | 600 rpm | 1![[thin space (1/6-em)]](https://www.rsc.org/images/entities/char_2009.gif) : :![[thin space (1/6-em)]](https://www.rsc.org/images/entities/char_2009.gif) 0.3 0.3![[thin space (1/6-em)]](https://www.rsc.org/images/entities/char_2009.gif) : :![[thin space (1/6-em)]](https://www.rsc.org/images/entities/char_2009.gif) 0.04 0.04 |
| S8 | 20 g | 10 g | 0.8 g | 600 rpm | 1![[thin space (1/6-em)]](https://www.rsc.org/images/entities/char_2009.gif) : :![[thin space (1/6-em)]](https://www.rsc.org/images/entities/char_2009.gif) 0.5 0.5![[thin space (1/6-em)]](https://www.rsc.org/images/entities/char_2009.gif) : :![[thin space (1/6-em)]](https://www.rsc.org/images/entities/char_2009.gif) 0.04 0.04 |
| S9 | 20 g | 12 g | 0.8 g | 600 rpm | 1![[thin space (1/6-em)]](https://www.rsc.org/images/entities/char_2009.gif) : :![[thin space (1/6-em)]](https://www.rsc.org/images/entities/char_2009.gif) 0.6 0.6![[thin space (1/6-em)]](https://www.rsc.org/images/entities/char_2009.gif) : :![[thin space (1/6-em)]](https://www.rsc.org/images/entities/char_2009.gif) 0.04 0.04 |
| S10 | 20 g | 8 g | 0.8 g | 200 rpm | 1![[thin space (1/6-em)]](https://www.rsc.org/images/entities/char_2009.gif) : :![[thin space (1/6-em)]](https://www.rsc.org/images/entities/char_2009.gif) 0.4 0.4![[thin space (1/6-em)]](https://www.rsc.org/images/entities/char_2009.gif) : :![[thin space (1/6-em)]](https://www.rsc.org/images/entities/char_2009.gif) 0.04 0.04 |
| S11 | 20 g | 8 g | 0.8 g | 400 rpm | 1![[thin space (1/6-em)]](https://www.rsc.org/images/entities/char_2009.gif) : :![[thin space (1/6-em)]](https://www.rsc.org/images/entities/char_2009.gif) 0.4 0.4![[thin space (1/6-em)]](https://www.rsc.org/images/entities/char_2009.gif) : :![[thin space (1/6-em)]](https://www.rsc.org/images/entities/char_2009.gif) 0.04 0.04 |
| S12 | 20 g | 8 g | 0.8 g | 800 rpm | 1![[thin space (1/6-em)]](https://www.rsc.org/images/entities/char_2009.gif) : :![[thin space (1/6-em)]](https://www.rsc.org/images/entities/char_2009.gif) 0.4 0.4![[thin space (1/6-em)]](https://www.rsc.org/images/entities/char_2009.gif) : :![[thin space (1/6-em)]](https://www.rsc.org/images/entities/char_2009.gif) 0.04 0.04 |
| S13 | 20 g | 8 g | 0.8 g | 1000 rpm | 1![[thin space (1/6-em)]](https://www.rsc.org/images/entities/char_2009.gif) : :![[thin space (1/6-em)]](https://www.rsc.org/images/entities/char_2009.gif) 0.4 0.4![[thin space (1/6-em)]](https://www.rsc.org/images/entities/char_2009.gif) : :![[thin space (1/6-em)]](https://www.rsc.org/images/entities/char_2009.gif) 0.04 0.04 |
2.3 Characterization of the MicroPCM
The FTIR spectra of SoTP, silica and MicroPCM were recorded by Fourier Transform Infrared Spectrometer (Bruker Dalton, Tensor II). The wavenumber region was between 500–4000 cm−1.The XRD patterns of SoTP, silica and MicroPCM were carried out by X-ray diffraction instrument (Dandong Haoyuan Instrument Co., Ltd, DX-2700). The testing voltage was 40 kV and test current was 30 mA. The scanning mode was step-scan, and its step size was 0.03 and the integral time was 0.2 s.
The EDX and XPS of MicroPCM were tested by scanning electron microscope (SEM, ZEISS evo18) and X-ray photoelectron spectroscopy (XPS, ESCALAB 250Xi), respectively.
The morphology of MicroPCM was observed by scanning electron microscope (SEM, ZEISS evo18) and transmission electron microscopy (TEM, FEI Tecnai G2 F20 S-TWIN).
The phase change properties of SoTP and MicroPCM were determined by differential scanning calorimeter (DSC, METTLER TOLEDO, 1/400). The accuracy of the calorimeter and temperature measurement was within ±0.04 μW and ±0.1 °C, respectively. DSC measurements were performed in the temperature range of −40 °C to 60 °C at a heating rate of 2 °C min−1.
The thermal stability of SoTP and MicroPCM was investigated by thermogravimetric analyzer (TG, SETARAM Instrumentation, Labsys Evo) at a heating rate of 5 °C min−1 in the range of 25–200 °C in a nitrogen atmosphere with the flow rate of 20 ml min−1. Samples were heated from 30 to 200 °C at a rate of 5 °C min−1 under a constant stream of nitrogen at a flow rate of 30 ml min−1.
Thermal conductivity of the SoTP and MicroPCM were measured by a DRL-III heat conduction modulus testing instrument (Xiangtan City Instrument & Meter Co., Ltd.). The measure precision of DRL-III is better than 3%. The measurements were repeated for three times to ensure the accuracy and repeatability of the results, and then averaged the results.
3 Results and discussion
3.1 Chemical characterization of MicroPCM
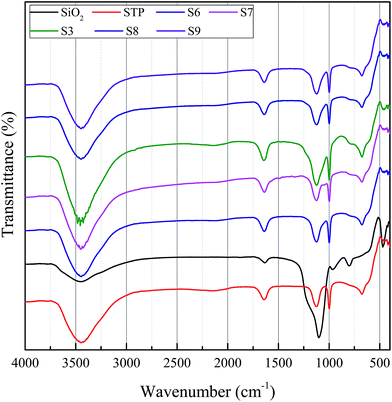
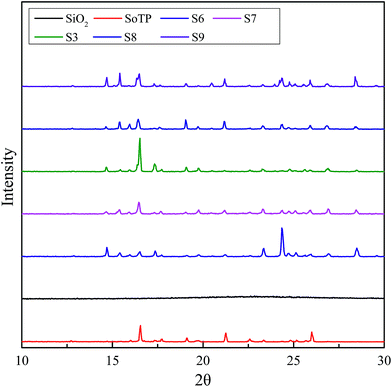
The FTIR spectra of silica, SoTP and MicroCM are shown in Fig. 1. In FTIR spectral data of the silica, the peak at 3447 cm−1 indicates that there is stretching vibration band of silanol group. The peak at 1102 cm−1 represents the asymmetric stretching vibration of Si–O–Si. The peak at 470 cm−1 represents the bending vibration of Si–O–Si. In the spectrum of the SoTP, there is a broad peak at approximately 3448 cm−1 caused by O–H stretching vibration. The peaks at 1657 cm−1, 1120 cm−1, 1003 cm−1 and 671 cm−1 are characteristic peaks of SoTP. The characteristic peaks of MicroPCM are tested at 3395 cm−1, 1646 cm−1, 1134 cm−1, 1001 cm−1, 670 cm−1 and 472 cm−1. This indicates that the spectra of MicroPCM have the characteristic peaks of both silica and SoTP, which indicates the success of the microencapsulated SoTP as core material.The phase analysis of silica, SoTP and MicroCM was observed by XRD and the results are shown in Fig. 2. No diffraction peak is observed for silica, which indicated that silica is amorphous. The XRD pattern of SoTP displays diffraction peaks at 16.6°, 21.3° and 26°, indicating that its high-crystalline structure. The XRD pattern of MicroPCM exhibits some diffraction peaks, which is assigned to crystalline SoTP. However, some new diffraction peaks appeared in the XRD patterns of MicroPCM. This may be due to the residue of other materials during the preparation process.
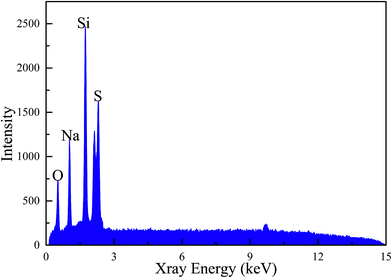
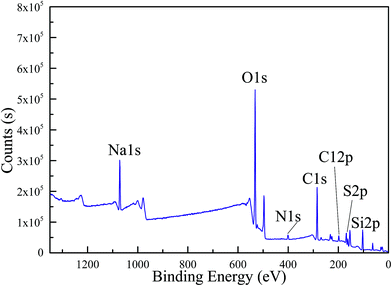
The EDX test result shown in Fig. 3 confirms elements in MicroPCM. The sulfur, sodium, oxygen and silicon element peaks appear in the graph. Sulfur, sodium and oxygen are the elements of SoTP, and oxygen and silicon are the elements of the silica. The sulfur, sodium, oxygen and silicon elements are also detected in the XPS test (Fig. 4). However, carbon and nitrogen elements are detected in the XPS test. The carbon and nitrogen are the components of residue (i.e., APTS, SDS, cyclohexane, n-pentanol) of other materials during the preparation process. This is consistent with XRD detection results. The EDX test does not detect nitrogen and carbon element, the reasons may be that the amount of residue is low and the detection accuracy of EDX is lower than that of XPS. In conclusion, these results indicate that the MicroPCM were successfully synthesized.
3.2 Morphology of the MicroPCM
The effects of core/shell mass ratio, concentration of emulsifier and stirring rate on the morphology of MicroPCM were studied. The morphology of the MicroPCM was observed by SEM. Fig. 5 shows the SEM photographs of the obtained MicroPCM with different core/shell mass ratio. The obtained microcapsules present some irregular particles (see Fig. 5a and b), indicating that the well-defined microcapsules cannot be achieved under the core/shell mass ratio of 1![[thin space (1/6-em)]](https://www.rsc.org/images/entities/char_2009.gif) :
:![[thin space (1/6-em)]](https://www.rsc.org/images/entities/char_2009.gif) 0.2 (Sample S6) and 1
0.2 (Sample S6) and 1![[thin space (1/6-em)]](https://www.rsc.org/images/entities/char_2009.gif) :
:![[thin space (1/6-em)]](https://www.rsc.org/images/entities/char_2009.gif) 0.3 (Sample S7). As shown in Fig. 5c, the MicroPCM for core/shell mass ratio of 1
0.3 (Sample S7). As shown in Fig. 5c, the MicroPCM for core/shell mass ratio of 1![[thin space (1/6-em)]](https://www.rsc.org/images/entities/char_2009.gif) :
:![[thin space (1/6-em)]](https://www.rsc.org/images/entities/char_2009.gif) 0.4 (Sample S3) has relatively smooth, compact surface and uniform size with spherical shape. As shown in Fig. 5d and e, the MicroPCM for core/shell mass ratio of 1
0.4 (Sample S3) has relatively smooth, compact surface and uniform size with spherical shape. As shown in Fig. 5d and e, the MicroPCM for core/shell mass ratio of 1![[thin space (1/6-em)]](https://www.rsc.org/images/entities/char_2009.gif) :
:![[thin space (1/6-em)]](https://www.rsc.org/images/entities/char_2009.gif) 0.5 (Sample S8) and 1
0.5 (Sample S8) and 1![[thin space (1/6-em)]](https://www.rsc.org/images/entities/char_2009.gif) :
:![[thin space (1/6-em)]](https://www.rsc.org/images/entities/char_2009.gif) 0.6 (Sample S9) also have compact and smooth surface with spherical shape. However, the MicroPCM of S8 and S9 have non-uniform sizes.
0.6 (Sample S9) also have compact and smooth surface with spherical shape. However, the MicroPCM of S8 and S9 have non-uniform sizes.
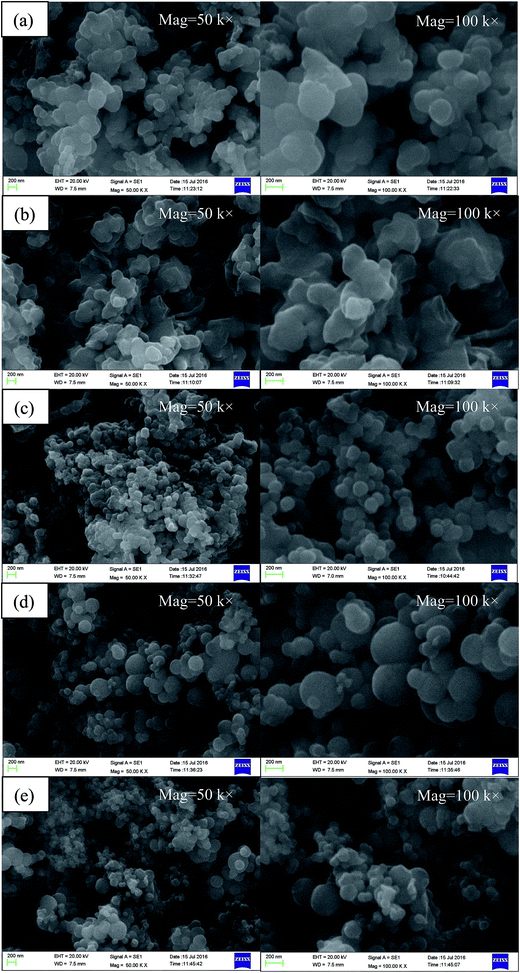 | ||
| Fig. 5 SEM of MicroPCM with different core/shell mass ratio: (a) S6, (b) S7, (c) S3, (d) S8, (e) S9. | ||
The morphology of MicroPCM with different concentration of emulsifier is shown in Fig. 6. It can be seen that the MicroPCM of S1, S2, S3 and S4 have relatively compact and smooth surface with spherical shape. The S5 MicroPCM presents some irregular particles. In addition, the particle size distribution of S3 is more uniform than that of S1, S2, S4 and S5. The particles of MicroPCM are agglomerate together easily with higher emulsifier content. This indicates that the content of emulsifier has a great influence on morphology of the MicroPCM.
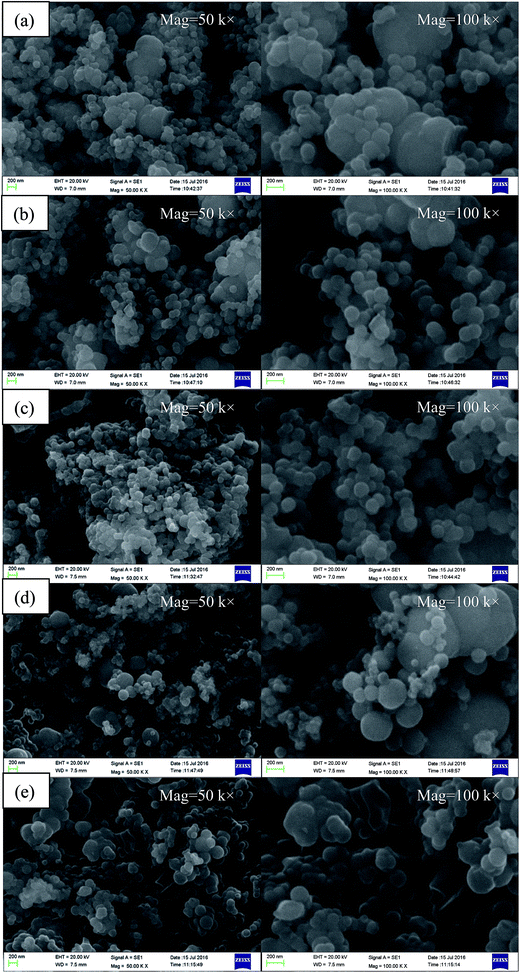 | ||
| Fig. 6 SEM of MicroPCM with different ratio of core to emulsifier: (a) S1, (b) S2, (c) S3, (d) S4, (e) S5. | ||
The morphology of MicroPCM synthesized at various stirring rates is presented in Fig. 7. It can be seen that with the increase of stirring rate, the MicroPCM gradually formed spherical shape and the globular surface became smoother. However, when the stirring rate is higher than 600 rpm, the particle size distribution of the MicroPCM was more and more nonuniform with the increase of the stirring rate. In the stirring rate range of 200–1000 rpm, the MicroPCM synthesized at 600 rpm have relatively uniform size, smooth and compact surface with spherical shape than that of others.
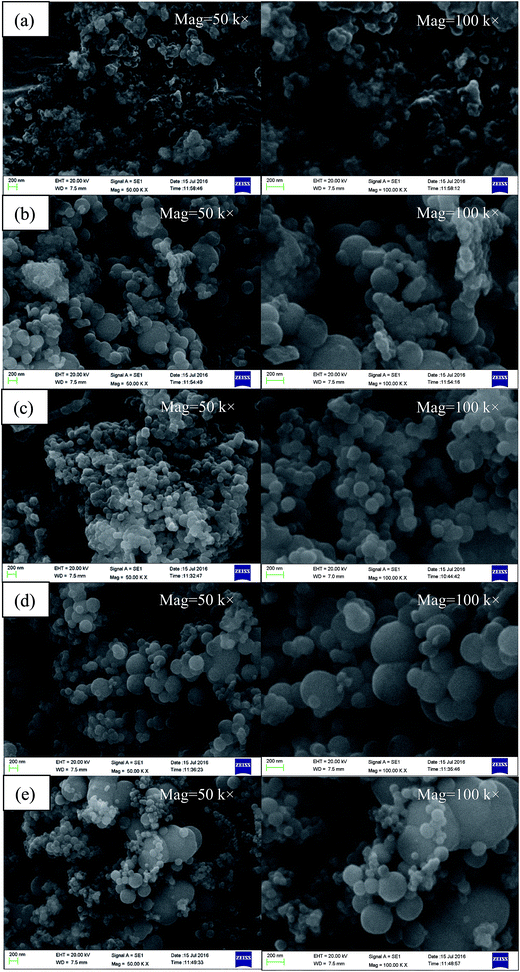 | ||
| Fig. 7 SEM of MicroPCM synthesized at various stirring rates: (a) S10, (b) S11, (c) S3, (d) S12, (e) S13. | ||
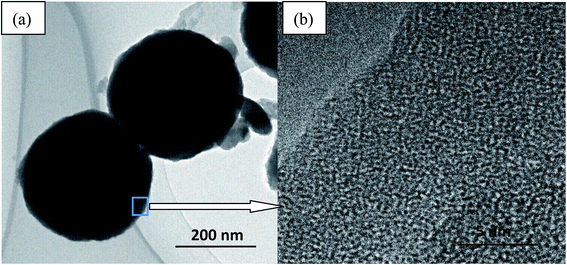
Fig. 8 displays the TEM image of S3 MicroPCM and the partial enlarge image. It can be seen from Fig. 8a, the MicroPCM are regular spherical. Moreover, two crystal structures are found in partial enlarge image of the MicroPCM edge (Fig. 8b). This indicated the core of SoTP was surrounded by the shell of silica.
3.3 Thermal properties of the MicroPCM
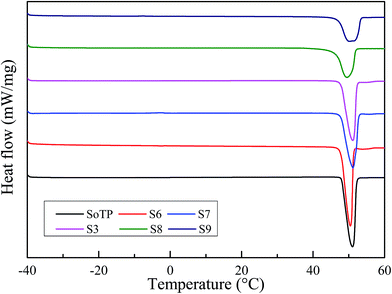
The latent heat, melting and solidified temperature of the SoTP and MicroPCM were investigated using DSC. The measurement data are presented in Table 2. The melting DSC curves of SoTP and MicroPCM with different core/shell mass ratio are shown in Fig. 9. The melting temperature and enthalpy of SoTP is 47.76 °C and 210.74 kJ kg−1, respectively. The melting temperature of MicroPCM are very close to each other as well as to that of bulk SoTP. This may suggest that the encapsulation of SoTP in silica has little influence on the melting process of core material. The melting enthalpy of S6, S7, S3, S8 and S9 is 199.47, 189.06, 149.46, 130.78 and 127.62 kJ kg−1, respectively. The melting enthalpy value of MicroPCM becomes lower than that of the bulk SoTP because only SoTP has enthalpy during the heating process. The encapsulation ratio of the SoTP is calculated by the following equation:30
 | (1) |
| Samples | Melting | Solidifying | Encapsulation ratio of the paraffin (%) | ||
|---|---|---|---|---|---|
| Temperature (°C) | Latent heat (kJ kg−1) | Temperature (°C) | Latent heat (kJ kg−1) | ||
| STP | 47.76 | 210.74 | — | — | |
| S3 | 47.26 | 149.82 | −25.08 | 79.97 | 71.09 |
| S6 | 47.66 | 199.47 | −18.68 | 105.03 | 94.65 |
| S7 | 47.69 | 189.46 | −15.56 | 75.2 | 89.9 |
| S8 | 46.41 | 130.78 | −20.67 | 69.1 | 62.06 |
| S9 | 47.25 | 127.62 | −25.24 | 32.18 | 60.56 |
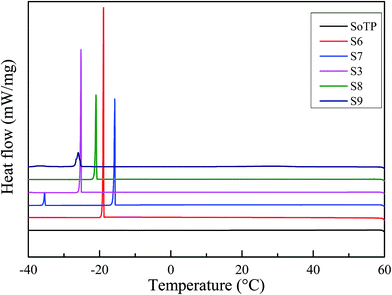
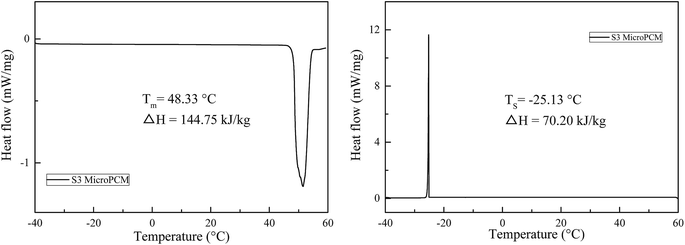
The solidified DSC curves of SoTP and MicroPCM with different core/shell mass ratio are shown in Fig. 10. As can be seen, the SoTP and MicroPCM have serious supercooling phenomenon observed. Especially, the SoTP has no exothermic peak in the cooling process. This indicates that the SoTP is no crystal in the cooling process because H2O evaporate from SoTP during the heating process. However, the MicroPCM have an exothermic peak in the cooling process. The solidified temperature of S6, S7, S3, S8 and S9 is 18.68, −15.56, −25.08, −20.67 and −25.24 °C, respectively. The solidified enthalpy of S6, S7, S3, S8 and S9 is 105.03, 75.02, 79.97, 69.1 and 32.18 kJ kg−1, respectively. Although the MicroPCM have serious supercooling phenomenon, they are improved compared with that of pure SoTP. This may suggest that the shell of MicroPCM promotes the crystallization of the SoTP. In addition, the DSC of S3 MicroPCM after 10 heating and cooling cycles were tested. The results are shown in Fig. 11. The melting and solidified enthalpy of S3 MicroPCM are 144.75 and 70.20 kJ kg−1, respectively. The melting enthalpy is still almost two times of the solidified. This indicates that the low solidified enthalpy of MicroPCM is not due to the loss of water during heating and cooling cycles, which may be due to the heterogeneous nucleation of SoTP.
3.4 Thermal stability of the MicroPCM
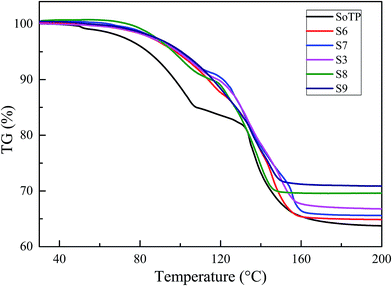
Thermal stability of PCM is crucial to thermal energy storage. The thermal stability of SoTP and MicroPCM was tested by TG and the results are shown in Fig. 12. It can be seen that the thermal degradation process of SoTP shows a weight loss with the rising of temperature. It can be considered that the weight loss is caused by the dehydration of hydrated salt. The weight loss of SoTP, S6, S7, S3, S8 and S9 is 11.4%, 5.59%, 5.03%, 5.31%, 6.19% and 4.85% before 100 °C, respectively. The results indicate that the thermal stability of the SoTP can be improved by microencapsulating SoTP with silica shell. This may attributed to the shell of MicroPCM preventing the evaporation of H2O in the heating process to some extent.Moreover, the phase change latent heat values of S3 MicroPCM after 10, 50, 100 and 200 heating and cooling cycles were tested. Fig. 13 shows the melting enthalpy values of the SoTP and MicroPCM before and after thermal cycles. The melting enthalpy of S3 MicroPCM is 144.56, 139.64, 132.52 and 123.99 kJ kg−1 after 10, 50, 100 and 200 thermal cycles, respectively. The melting enthalpy of the MicroPCM decreases by 3.51%, 6.79%, 11.55% and 17.24% after 10, 50, 100 and 200 thermal cycles, respectively, compared with that without thermal cycle. The decrease in enthalpy with increasing cycle numbers may be due to the decomposition of SoTP. However, it can be seen from the figure, the SoTP has no melting enthalpy after 10 thermal cycles. This is because SoTP does not crystallize during the first cooling process (the first solidified DSC curve of SoTP is shown in Fig. 10). This indicated that the thermal ability of SoTP has been greatly improved after encapsulated in silica.
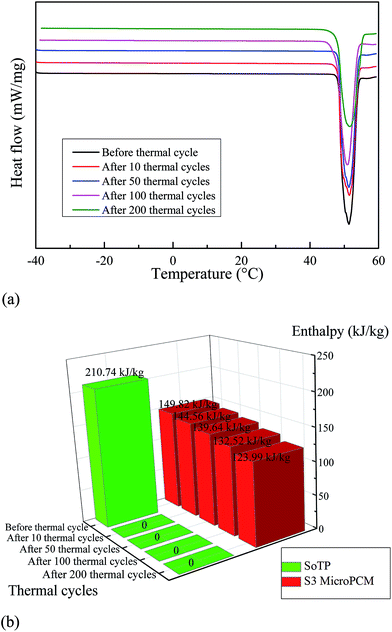 | ||
| Fig. 13 DSC of MicroPCM before and after thermal cycles. (a) DSC curves of S3 MicroPCM before and after thermal cycles. (b) Enthalpy values of SoTP and S3 MicroPCM before and after thermal cycles. | ||
3.5 Supercooling degree test of MicroPCM
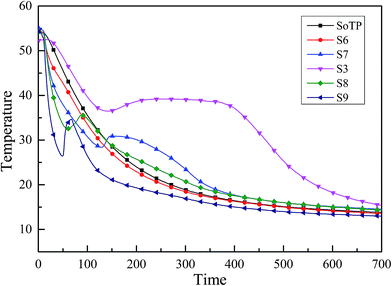
The supercooling degree of SoTP and MicroPCM was investigated. The temperature changes during the cooling process were recorded, and the results are shown in Fig. 14. It is observed that the SoTP and S6 do not melt. There is no latent heat released during the cooling process. This indicates that the supercooling of SoTP and S6 can be as high as several dozen degrees Celsius. The supercooling of S7, S3, S8 and S9 was 2.75, 2.56, 3.01 and 8.26 °C, respectively. The results indicate that the encapsulation of SoTP with silica has an important significance in reducing the supercooling degree of inorganic hydrated salt.3.6 Thermal conductivities of MicroPCM
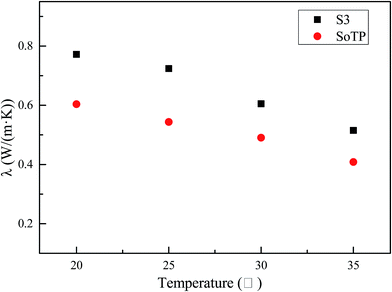
The thermal conductivities of SoTP and S3 with different temperature are shown in Fig. 15. At 20 °C, the thermal conductivities of SoTP and S3 were measured to be 0.6035 and 0.7718 W (m k)−1, respectively. In addition, the thermal conductivities of SoTP and S3 decrease with the increase of temperature. But the thermal conductivity of S3 is always higher than the bulk SoTP. This may suggest that the heat transfer area of SoTP increased after its microencapsulation and the thermal conductivity of silica is higher than SoTP. Therefore, the thermal conductivity of SoTP/silica MicroPCM is higher than that of SoTP.3.7 Temperature-regulated property
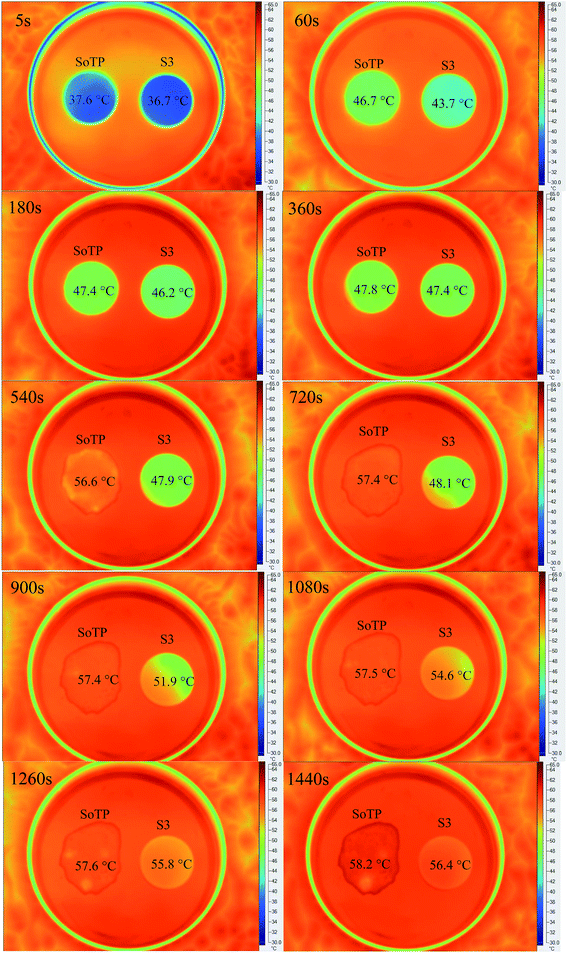
The temperature-regulated property of PCM is an important thermal performance for the energy storage. The SoTP and S3 were placed in a thermostatic bath with 60 °C. The thermal images of the surface temperature distribution of SoTP and S3 are shown in Fig. 16. It can be seen that the morphologies of SoTP and S3 are stable when the heating time is 5 s, 60 s, 180 s and 360 s. With the increase of the heating time, the SoTP and S3 absorb heat continuously until the solid to liquid phase change occurred. The melting behavior of SoTP can be obviously seen after the SoTP and S3 heated to 540 s. While the leakage or morphology change behavior of S3 can not be found until the SoTP and S3 heated to 1440 s. It can also be seen that the temperature of S3 is 51.9 °C, 54.6 °C, 55.8 °C and 56.4 °C at 900 s, 1080 s, 1260 s and 1440 s, respectively. As the above mentioned, the melting temperature of SoTP is 47.76 °C, it can be concluded that the microencapsulation of PCM with silica provide compact and airtight shell for preventing the leakage of the melted SoTP.4 Conclusion
The inorganic MicroPCM were successfully synthesized by using SoTP as core and silica as shell via sol–gel method. On the basic of the analysis of influence factors, the additive amount of emulsifier, stirring speed and core/shell mass ratio greatly affected the surface morphology and thermal property of MicroPCM. When the stirring speed is 600 rpm and the core/shell/emulsifier mass ratio is 1![[thin space (1/6-em)]](https://www.rsc.org/images/entities/char_2009.gif) :
:![[thin space (1/6-em)]](https://www.rsc.org/images/entities/char_2009.gif) 0.4
0.4![[thin space (1/6-em)]](https://www.rsc.org/images/entities/char_2009.gif) :
:![[thin space (1/6-em)]](https://www.rsc.org/images/entities/char_2009.gif) 0.04, the obtained MicroPCM have a compact and smooth surface with a spherical shape. In addition, the influences core/shell mass ratio on the latent heat, thermal stability and supercooling of MicroPCM were investigated. The results indicate that the latent heat values of MicroPCM decrease with the decrease of core/shell mass ratio. The supercooling, thermal stability and thermal conductivity of SoTP have been greatly improved after the encapsulation of SoTP in silica. In addition, the leakage of SoTP has been solved through MicroPCM technology. The highest encapsulation ratio of the MicroPCM is 94.65%. The thermal conductivity of SoTP can be improved from 0.6035 to 0.7718 W (m k)−1 after the encapsulation of SoTP with silica. Based on all results, it can be concluded that the prepared SoTP/silica MicroPCM have potential for thermal energy storage.
0.04, the obtained MicroPCM have a compact and smooth surface with a spherical shape. In addition, the influences core/shell mass ratio on the latent heat, thermal stability and supercooling of MicroPCM were investigated. The results indicate that the latent heat values of MicroPCM decrease with the decrease of core/shell mass ratio. The supercooling, thermal stability and thermal conductivity of SoTP have been greatly improved after the encapsulation of SoTP in silica. In addition, the leakage of SoTP has been solved through MicroPCM technology. The highest encapsulation ratio of the MicroPCM is 94.65%. The thermal conductivity of SoTP can be improved from 0.6035 to 0.7718 W (m k)−1 after the encapsulation of SoTP with silica. Based on all results, it can be concluded that the prepared SoTP/silica MicroPCM have potential for thermal energy storage.
Acknowledgements
This work was supported by the National Natural Science Foundation of China (No. U1407125) and the key Disciplines Fund of China University of Mining and Technology (No. XZD201601).References
- E. Oro, A. de Gracia, A. Castell, M. M. Farid and L. F. Cabeza, Appl. Energy, 2012, 99, 513–533 CrossRef CAS.
- C. Z. Liu, Z. H. Rao, J. T. Zhao, Y. T. Huo and Y. M. Li, Nano Energy, 2015, 13, 814–826 CrossRef CAS.
- M. M. Farid, A. M. Khudhair, S. A. K. Razack and S. Al-Hallaj, Energy Convers. Manage., 2004, 45, 1597–1615 CrossRef CAS.
- P. Z. Lv, C. Z. Liu and Z. H. Rao, Appl. Energy, 2016, 182, 475–487 CrossRef CAS.
- T. Shi, W. Sun and Y. Yang, Mater. Struct., 2014, 47, 533–539 CrossRef CAS.
- A. S. Bejan and T. Catalina, Energy Procedia, 2016, 85, 52–59 CrossRef.
- H. Akeiber, P. Nejat, M. Z. A. Majid, M. A. Wahid, F. Jomehzadeh, I. Zeynali Famileh, J. K. Calautit, B. R. Hughes and S. A. Zaki, Renewable Sustainable Energy Rev., 2016, 60, 1470–1497 CrossRef.
- D. Sun and L. J. Wang, Energ. Build., 2016, 119, 183–188 CrossRef.
- F. Agyenim, Renewable Energy, 2016, 87(1), 229–239 CrossRef CAS.
- S. Demirbağ and S. A. Aksoy, Fibers Polym., 2016, 17, 408–417 CrossRef.
- L. Zhao, J. Luo, H. Wang, G. L. Song and G. Y. Tang, Appl. Therm. Eng., 2016, 99, 495–501 CrossRef CAS.
- J. T. Zhao, Z. H. Rao and Y. M. Li, Energy Convers. Manage., 2015, 103, 157–165 CrossRef CAS.
- Y. T. Huo, Z. H. Rao, X. J. Liu and J. T. Zhao, Energy Convers. Manage., 2015, 89, 387–395 CrossRef.
- Q. C. Wang, Z. H. Rao, Y. T. Huo and S. F. Wang, Int. J. Therm. Sci., 2016, 102, 9–16 CrossRef.
- W. X. Wu, G. Q. Zhang, X. F. Ke, X. Q. Yang, Z. Y. Wang and C. Z. Liu, Energy Convers. Manage., 2015, 101, 278–284 CrossRef CAS.
- R. J. Warzoha and A. S. Fleischer, Int. J. Heat Mass Transfer, 2014, 79, 314–323 CrossRef CAS.
- J. Shon, H. Kim and K. Lee, Appl. Energy, 2014, 113, 680–689 CrossRef.
- M. Dannemand, J. Dragsted, J. Fan, J. B. Johansen, W. Kong and S. Furbo, Appl. Energy, 2016, 169, 72–80 CrossRef CAS.
- M. K. Rathod and J. Banerjee, Renewable Sustainable Energy Rev., 2013, 18, 246–258 CrossRef CAS.
- C. Z. Liu, Z. H. Rao and Y. M. Li, Energy Technol., 2016, 4, 496–501 CrossRef CAS.
- A. Jamekhorshid, S. M. Sadrameli and M. Farid, Renewable Sustainable Energy Rev., 2014, 31, 531–542 CrossRef CAS.
- F. He, X. D. Wang and D. Z. Wu, Energy, 2014, 67, 223–233 CrossRef CAS.
- Y. Konuklu, M. Unal and H. O. Paksoy, Sol. Energy Mater. Sol. Cells, 2014, 120, 536–542 CrossRef CAS.
- S. K. Song, L. J. Dong, Z. Y. Qu, J. Ren and C. X. Xiong, Appl. Therm. Eng., 2014, 70, 546–551 CrossRef CAS.
- C. Y. Zhao and G. H. Zhang, Renewable Sustainable Energy Rev., 2011, 15, 3813–3832 CrossRef CAS.
- S. Marchi, S. Pagliolico and G. Sassi, Energy Convers. Manage., 2013, 74, 261–268 CrossRef CAS.
- T. Y. Wang and J. Huang, J. Appl. Polym. Sci., 2013, 130, 1516–1523 CrossRef CAS.
- J. Huang, T. Y. Wang, P. P. Zhu and J. B. Xiao, Thermochim. Acta, 2013, 557, 1–6 CrossRef CAS.
- S. Canbazoğlu, A. Şahinaslan, A. Ekmekyapar, Ý. G. Aksoy and F. Akarsu, Energ. Build., 2005, 37, 235–242 CrossRef.
- L. Cao, F. Tang and G. Y. Fang, Energ. Build., 2014, 72, 31–37 CrossRef.
| This journal is © The Royal Society of Chemistry 2017 |

