 Open Access Article
Creative Commons Attribution 3.0 Unported Licence
Hyperbranched polyglycerol conjugated fluorescent carbon dots with improved in vitro toxicity and red blood cell compatibility for bioimaging
Sha Li†
 ,
Zhong Guo†,
Ru Feng,
Yi Zhang,
Wei Xue* and
Zonghua Liu*
Key Laboratory of Biomaterials of Guangdong Higher Education Institutes, Department of Biomedical Engineering, Jinan University, Guangzhou, 510632, China. E-mail: tliuzonghua@jnu.edu.cn; weixue_jnu@aliyun.com; Fax: +86-20-85226397; Tel: +86-20-85226397
First published on 17th January 2017
Abstract
Fluorescent carbon dots (CDs) have a variety of biomedical applications such as bio-imaging. Successful application of CDs in clinic greatly depends on their biocompatibility and favorable bio-functions. In the present study, we report a facile and efficient method to synthesize a CDs-based nanohybrid bearing a multi-hydroxy hyperbranched polyglycerol (HPG) shell by combing a “grafting from” method with an anionic ring-opening polymerization technique. The resultant CDs-g-HPG had high water-dispersibility, low cytotoxicity, improved hemocompatibility and strong green fluorescence. The results demonstrate that the CDs-g-HPG possesses promising potential for bio-imaging.
1 Introduction
Fluorescent carbon dots (CDs) as a new type of fluorescence nanomaterial, have shown promising potential in biomedical applications such as bio-imaging, disease diagnosis, and nanoprobes.1,2 However, bio-safety concerns of CDs for biomedical applications were pointed out in previous literature. It is necessary to modify CDs to improve the biocompatibility and preferably increase more surface functional groups on CDs surface for further functionalization. Recently, a number of materials have been used to functionalize CDs by chemical covalent bonds or physical interactions, such as Fe3O4@SiO2,3 ethylenediamine,4 L-tyrosine methyl ester,5 hyaluronic acid,6 PEG200N,7 polyethylenimine,8,9 cellulose nanofibrils,10 and glucose.11 The fluorescence strength, quantum yield, biocompatibility and/or application range of the functionalized CDs were improved to different extents. However, most of these modification materials have no abundant functional groups or only possess charged functional groups that may cause complicated interactions with biomacromolecules and cells in biomedical applications in vivo. Therefore, it is necessary to functionalize the CDs with neutral functional groups like hydroxyl groups.In this work, we modified CDs with hyperbranched polyglycerol (HPG). HPG is a highly branched hydrophilic polymer with excellent biocompatibility, multifunctionality, good solubility, controllable synthesis and long circulation half-time in vivo.12–14 Hence, HPG has attracted increasing attention as an ideal material for functionalization or modification of nanomaterials. A large number of studies reported HPG-grafted nanomaterials such as Fe3O4,15 multiwalled carbon nanotubes,16 gold,17 Fe3O4@SiO2 (ref. 18) and gadolinium.19 Nevertheless, there is no reports on surface modification and functionalization of CDs with HPG. Here, we presented a simple and effective method to prepare HPG-conjugated CDs (CDs-g-HPG) with CDs as an inner core and HPG as an outer shell. The advantages of the CDs-g-HPG include: (1) HPG with numerous functional groups and three-dimensional structure could further increase functionalization potential of the CDs; (2) the thickness of the HPG shell is controllable; (3) HPG with low toxicity could improve the biocompatibility of CDs. These expected properties of the CDs-g-HPG were further examined in this work.
2 Materials and methods
2.1 Materials
α-Cyclodextrin (≥98%) was purchased from Sigma-Aldrich (USA). KH2PO4, methanol and alcohol was purchased from Guangzhou Chemical Reagent Factory (Guangzhou, China). Quinine sulfate dehydrate, Amberlite 732 cation exchange resin, potassium methoxide and glycidol were purchased from Aladdin (Shanghai, China).2.2 Synthesis of fluorescent CDs
Fluorescent CDs were synthesized according to our previously reported method,20 and were dried in vacuum oven at 40 °C overnight.2.3 Synthesis of CDs-g-HPG
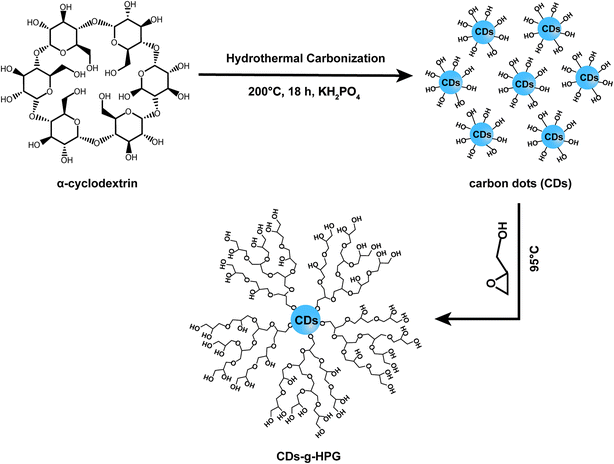
Polymerization of glycidol was carried out in a dry round bottom flask under an atmosphere of nitrogen and in dark unless otherwise stated. Briefly, 340 mg of as-prepared CDs were added to the flask followed by 1 mL of potassium methylate solution. The mixture was stirred and heated to 75 °C until the CDs dissolved. The resulting methanol was removed. The round bottom flask was kept in an oil bath at 95 °C and 17.4 mL glycidol was dropwise added using a syringe pump (1 mL h−1). After completion of the monomer addition, the reaction continued for an additional 2 h with constant stirring, and then the mixture was cooled to room temperature. Methanol (35 mL) was added and the product was passed through an Amberlite 732 cation exchange resin to remove the potassium ions. The resin was removed by vacuum filtration and the methanol was removed by rotary evaporation. Then, the product was dialysed for three days against water by using cellulose acetate dialysis tubing (MWCO 500 g mol−1). Finally, CDs-g-HPG was obtained by freeze drying. The overall synthesis scheme is illustrated in Fig. 1.2.4 Characterization of the CDs and CDs-g-HPG
The CDs or CDs-g-HPG solution in water was dropped on copper grids. After dried, the CDs or CDs-g-HPG were observed with a JEOL-2100F high-resolution transmission electron microscope (HRTEM). The zeta potentials of the CDs and CDs-g-HPG in aqueous solution were measured using a Malvern Zetasizer Nano ZS apparatus. Fourier transform infrared (FTIR) spectra of the CDs and CDs-g-HPG were obtained by using a Bruke Vertex 70 FTIR spectrometer (KBr disk). 1H nuclear magnetic resonance (1H NMR) spectra of the CDs and CDs-g-HPG were conducted on a Bruker Avance 300 MHz spectrometer with D2O as the solvent. The molecular weights of the CDs and CDs-g-HPG were measured by gel permeation chromatography (GPC, Viscotek 270 max) with polyethylene oxide as the standard and the mixed solution of 0.2 M sodium nitrate and 0.003 M sodium azide as the eluent at a flow rate of 1 mL min−1. The UV-visible absorption spectra of the CDs and CDs-g-HPG were recorded using a UV-2550 spectrophotometer (Shimadzu Corporation, Japan). The fluorescence emission spectra of the CDs and CDs-g-HPG were recorded on a Hitachi F-7000 fluorescence spectrophotometer (Hitachi High-Technologies Corp., Tokyo, Japan).2.5 Cell imaging
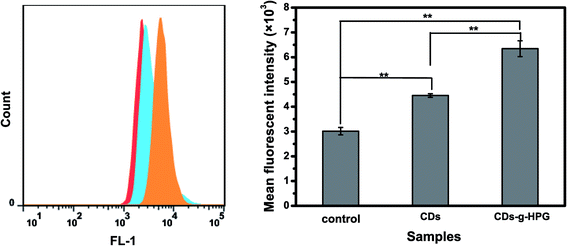
![[thin space (1/6-em)]](https://www.rsc.org/images/entities/char_2009.gif) 000 viable cells were counted and the data were analyzed using FlowJo 7.6.
000 viable cells were counted and the data were analyzed using FlowJo 7.6.2.6 Cytotoxicity
A549 cells were seeded into 96-well plates (1 × 10⁴ cells per well) at 37 °C for 24 h. Then, the cells were treated with different concentrations of the materials dissolved in DMEM for 24 h. Subsequently, the cells were washed with PBS three times followed by addition of 100 μL of the DMEM plus 10% (v/v) Cell Counting Kit8 reagent (CCK8, Dojindo Laboratories) to each well and incubated for 4 h. The absorbance was measured at 450 nm by a microplate reader (Multiskan MK3; Thermo Lab-systems, Finland). The relative cell viability was calculated with the negative control cells as 100% cell viability.2.7 RBC morphology
Freshly collected citrate-anticoagulated whole blood donated by healthy consenting volunteers was centrifuged at 1000 × g for 10 min to obtain RBC pellets followed by washing with PBS. The RBC pellet was incubated with different concentrations of the CDs or CDs-g-HPG solutions for 10 min at room temperature. The RBCs incubated with PBS were used as a negative control. Subsequently, the RBCs were fixed with 4% formaldehyde for 2 h and then dehydrated with 75, 85, 95 and 100% (v/v) ethanol for 10 min respectively. After air drying, the RBCs were coated with gold and observed with a scanning electron microscope (SEM, Philips XL-30, Holland).2.8 RBC lysis
Fresh RBC suspension (16% v/v in PBS, 50 μL) was incubated with 1 mL of different concentrations of the CDs and CDs-g-HPG solutions dissolved in PBS at 37 °C. Fifty microliters of the RBC suspension was added to 1 mL of water to yield complete hemolysis used as a positive control (100% hemolysis). After incubation for a certain time, the RBC suspensions were centrifuged at 1000 × g for 5 min, and the supernatants were collected. The absorbance values of the supernatants (200 μL) at 540 nm were measured with the microplate reader. The hemolysis of the test samples were calculated by comparing the absorbance values to that of the positive control (100% hemolysis).2.9 Statistical analysis
Data were expressed as mean values ± standard deviation (SD). Statistical analysis was performed by using one-way ANOVA with SPSS 16.0. Difference is considered significant when p < 0.05 (*) and P < 0.01 (**).3 Results and discussion
3.1 Synthesis and characterization of CDs and CDs-g-HPG
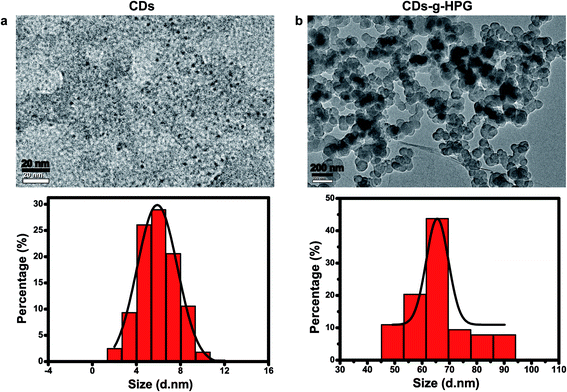
Fluorescent CDs were reported to have abundant carboxyl and hydroxyl groups on the surface.21 In this work, we prepared the CDs with abundant hydroxyl groups by hydrothermal treatment of α-cyclodextrin. Subsequently, the obtained CDs with hydroxyl groups were used as an initiator to initiate the anionic ring-opening polymerization of glycidol on the surface of the CDs to obtain CDs-g-HPG. The synthesis procedure of the CDs-g-HPG is shown in Fig. 1. The as-prepared CDs and CDs-g-HPG were near spherical in morphology and well-dispersed, as shown in their HRTEM images (Fig. 2a and b). The sizes of the CDs and CDs-g-HPG were 6.8 ± 1.7 nm and 70.8 ± 11.3 nm respectively according to their size distribution histograms (statistical analysis by ImageJ). The zeta potential of the CDs and CDs-g-HPG was −14.6 ± 1.0 mV and −15.0 ± 1.5 mV, respectively. The negative charges of the CDs and CDs-g-HPG nanoparticles were due to the existence of abundant –COOH groups on the surfaces, leading to the good dispersity and water-solubility of the two materials.The chemical structures and molecular weights of the CDs and CDs-g-HPG were respectively examined by FTIR, 1H NMR and GPC (Fig. 3). The FTIR spectrum of CDs shows C–H stretching at 2970–2880 cm−1, C–H2 bending at 1460 cm−1, and a strong band at 3411 cm−1 referring to surface hydroxyl groups of the CDs. The FTIR spectrum of CDs-g-HPG shows the typical signatures of HPG:22,23 stretching vibration of O–H, C–H, and C–O–C at 3405, 2982, and 1042–1089 cm−1, respectively. The presence of HPG on the surface of the CDs and its chemical structure were further confirmed by 1H NMR (Fig. 3b). The characteristic proton resonances of –CH2O– and –CHO– units of HPG in the range of 3.5–4.0 ppm were observed, and the solvent peak of the D2O was appeared at 4.4–4.7 ppm.23 The FTIR and 1H NMR results indicate that HPG was successfully grafted onto the surface of the CDs. From the GPC result (Fig. 3c), the eluting time was used to compare the difference of the molecular weights of the CDs and CDs-g-HPG. From the eluting times, the molecular weight of CDs-g-HPG was higher than that of the CDs, implying that the HPG was conjugated to the CDs.
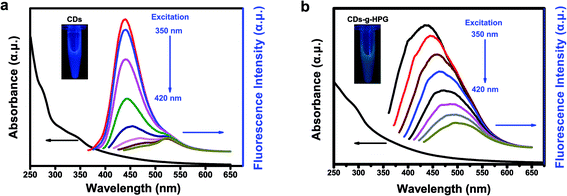
Optical properties of the CDs and CDs-g-HPG were detected by UV-visible and fluorescence emission spectra excited by changing excitation wavelengths (Fig. 4a and b). The UV-visible absorption spectrum exhibits a peak around 289 nm, which is attributable to the π–π* transition of aromatic sp2 domains.21,24 At an excitation wavelength of 350 nm, a strong emission peak at 435 nm is observed in the fluorescence emission spectra of the CDs or CDs-g-HPG. Along with the excitation wavelength increase from 350 to 420 nm, the fluorescence emission intensity decreased remarkably, and the emission peaks of the CDs shifted from 430 to 520 nm while that of CDs-g-HPG did not shift much with a maxima red shift of ∼60 nm from 435 to 500 nm. The result indicates that the obtained CDs-g-HPG displayed a strong excitation-dependence of fluorescence emission like CDs. The inset images in Fig. 4 show that the prepared CDs and CDs-g-HPG exhibited excellent water-dispersibility and emitted bright blue (CDs) and green (CDs-g-HPG) fluorescence under UV lamp (365 nm), respectively. The CDs and CDs-g-HPG emitted different fluorescence colors, which is attributed to the poly-aromatic sp2 carbon nanostructures in the materials as well as the diverse size distribution and surface functional groups.1,7 Quinine sulfate (quantum yield 54%)25 was used as a standard sample to calculate the quantum yield of the CDs and CDs-g-HPG (Table 1). The quantum yields were 1.5% for CDs and 1.2% for CDs-g-HPG, respectively. Although the fluorescence emission mechanism of CDs has not been well elucidated, there is increasing evidence that the emission arises from the radioactive recombination of excitations located at the surface energy trap.25 The quantum yield of the CDs-g-HPG was less than that of the CDs, probably because the HPG modification layer reduced the surface energy trap of the CDs.
3.2 Cell imaging
3.3 Cytotoxicity
The cytotoxicity of the CDs and CDs-g-HPG from 0.1 to 10 mg mL−1 on A549 cells was detected by CCK-8 assay. Cell viability was normalized to control cells (no materials). As shown in Fig. 7, the cell viability was significantly lower than the control when treated with the CDs as low as 0.5 mg mL−1. By contrast, the cell viability had no significant difference from the control when treated with the CDs-g-HPG as high as 2 mg mL−1. This suggests that the CDs-g-HPG had much lower cytotoxicity than the CDs did, indicating that the conjugation with HPG layer improved the bio-safety of the CDs.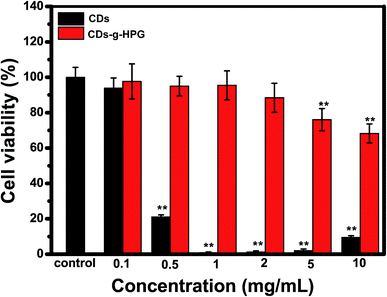 | ||
| Fig. 7 Cell viability of A549 cells after incubation with CDs or CDs-g-HPG at different concentrations for 24 h. | ||
3.4 RBC morphology
RBCs are the most abundant blood cells in the blood tissue and have important transport function for oxygen and carbon dioxide. Moreover, RBCs, due to their typical morphology and easy resource, are generally used as a membrane model to study the complicated interactions between foreign materials with mammalian cell membranes.26 RBC morphology is considered as a main criterion to evaluate the hemocompatibility of foreign materials.27 It is unavoidable for the CDs and CDs-g-HPG to contact RBCs in their blood-contacting biomedical applications. Here, we explored the effect of the CDs and CDs-g-HPG on RBCs morphology and aggregation.Fig. 8 shows the RBC morphology and aggregation in the presence of the CDs and CDs-g-HPG at different concentrations. It clearly displays that the CDs from 1 mg mL−1 altered RBC morphology from normally biconcave to crenated, and that the CDs at 5 and 10 mg mL−1 even caused RBC aggregation like big lumps. This suggests that the CDs had strong interaction with RBC membrane, which was presumed to be mediated by their hydrophobic interaction.20 By comparison, the CDs-g-HPG as high as 10 mg mL−1 did not cause the morphological change and aggregation of RBCs. It indicates that the hydrophobic interaction between the CDs and RBC membrane was prevented by the HPG layer, and that the hemocompatibility of the CDs was improved after grafted with HPG on their surface.
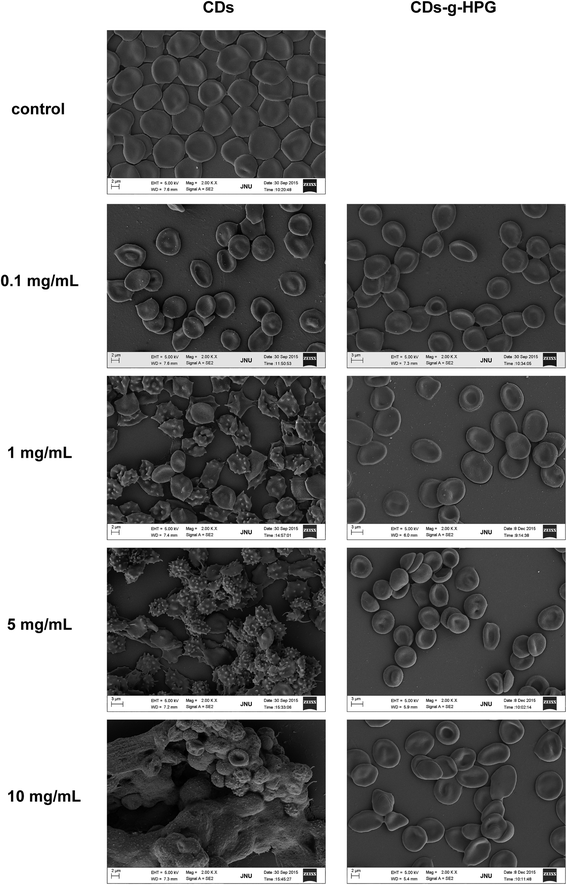 | ||
| Fig. 8 Morphology and aggregation of the RBCs in the presence of different concentrations of CDs or CDs-g-HPG. | ||
3.5 RBC lysis
We further evaluated the hemolytic properties of the CDs and CDs-g-HPG, in order to have a better understanding of the extent of the membrane damage after contact with the two materials. Hemolysis is a common index to indicate the degree of the RBC membrane damage by foreign materials. Significant hemolysis is caused when the percentage of hemolysis is above 5%.27 The hemolysis percentages of the RBCs incubated with the CDs and CDs-g-HPG are shown in Fig. 9. The hemolysis by the CDs clearly depended on their concentration and incubation time. Obviously, the CDs at 1 and 2 mg mL−1 gradually caused serious hemolysis along with incubation time. By contrast, even 10 mg mL−1 of CDs-g-HPG did not caused significant hemolysis after 24 h of incubation. This further demonstrates that the HPG layer blocked the hydrophobic interaction between the CDs and RBC membrane.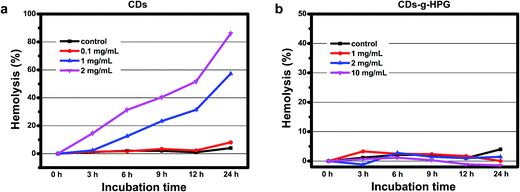 | ||
| Fig. 9 Lysis of the RBCs after incubated with different concentrations of (a) CDs or (b) CDs-g-HPG at room temperature. | ||
4 Conclusion
In this work, a fluorescent CDs-g-HPG nanohybrid composed of a CDs core and a HPG shell was synthesize by a surface-initiated anionic ROP technique. The HPG shell not only enhanced the biocompatibility of the CDs but also added numerous favorable surface functional groups (–OH) for further functionalization. Combining their convenient synthesis, unique chemical structure, favorable optical properties, good water-dispersibility and much improved bio-safety, the CDs-g-HPG has promising applications for bio-imaging, biosensors, etc.Acknowledgements
This work was financially supported by the Natural Science Foundation of Guangdong Province (2014A03031 & 2015A030313314) and the Science and Technology Project of Guangdong Province (2014A040401028).References
- Z. C. Yang, M. Wang, A. M. Yong, S. Y. Wong, X. H. Zhang, H. Tan, A. Y. Chang, X. Li and J. Wang, Chem. Commun., 2011, 47, 11615–11617 RSC.
- G. H. G. Ahmed, R. B. Laíño, J. A. G. Calzón and M. E. D. García, Microchim. Acta, 2014, 182, 51–59 CrossRef.
- Y. Zhang, Y. Shen, X. Teng, M. Yan, H. Bi and P. C. Morais, ACS Appl. Mater. Interfaces, 2015, 7, 10201–10212 CAS.
- E. S. B. C. D'Angelis do, J. R. Correa, G. A. Medeiros, G. Barreto, K. G. Magalhaes, A. L. de Oliveira, J. Spencer, M. O. Rodrigues and B. A. Neto, Chemistry, 2015, 21, 5055–5060 CrossRef PubMed.
- J. Hou, J. Dong, H. Zhu, X. Teng, S. Ai and M. Mang, Biosens. Bioelectron., 2015, 68, 20–26 CrossRef CAS PubMed.
- E. J. Goh, K. S. Kim, Y. R. Kim, H. S. Jung, S. Beack, W. H. Kong, G. Scarcelli, S. H. Yun and S. K. Hahn, Biomacromolecules, 2012, 13, 2554–2561 CrossRef CAS PubMed.
- P. Huang, J. Lin, X. Wang, Z. Wang, C. Zhang, M. He, K. Wang, F. Chen, Z. Li, G. Shen, D. Cui and X. Chen, Adv. Mater., 2012, 24, 5104–5110 CrossRef CAS PubMed.
- Q. Wang, C. Zhang, G. Shen, H. Liu, H. Fu and D. Cui, J. Nanobiotechnol., 2014, 12, 58 CrossRef PubMed.
- J. Y. Yin, H. J. Liu, S. Z. Jiang, Y. Chen and Y. F. Yao, ACS Macro Lett., 2013, 2, 1033–1037 CrossRef CAS.
- K. Junka, J. Guo, I. Filpponen, J. Laine and O. J. Rojas, Biomacromolecules, 2014, 15, 876–881 CrossRef CAS PubMed.
- P. Shen and Y. Xia, Anal. Chem., 2014, 86, 5323–5329 CrossRef CAS PubMed.
- M. Imran ul-haq, B. F. Lai and J. N. Kizhakkedathu, Macromol. Biosci., 2014, 14, 1469–1482 CrossRef CAS PubMed.
- A. Zarrabi, M. A. Shokrgozar, M. Vossoughi and M. Farokhi, J. Mater. Sci.: Mater. Med., 2014, 25, 499–506 CrossRef CAS PubMed.
- J. G. Zhang, O. B. Krajden, R. K. Kainthan, J. N. Kizhakkedathu, I. Constantinescu, D. E. Brooks and M. I. Gyongyossy-Issa, Bioconjugate Chem., 2008, 19, 1241–1247 CrossRef CAS PubMed.
- C. E. Smith, D. Ernenwein, A. Shkumatov, N. E. Clay, J. Lee, M. Melhem, S. Misra, S. C. Zimmerman and H. Kong, Biomaterials, 2015, 69, 184–190 CrossRef CAS PubMed.
- L. Zhou, C. Gao and W. J. Xu, Macromol. Chem. Phys., 2009, 210, 1011–1018 CrossRef CAS.
- A. Zill, A. L. Rutz, R. E. Kohman, A. M. Alkilany, C. J. Murphy, H. Kong and S. C. Zimmerman, Chem. Commun., 2011, 47, 1279–1281 RSC.
- L. Wang, K. G. Neoh, E. T. Kang and B. Shuter, Biomaterials, 2011, 32, 2166–2173 CrossRef CAS PubMed.
- J. H. Baker, K. C. McPhee, F. Moosvi, K. Saatchi, U. O. Hafeli, A. I. Minchinton and S. A. Reinsberg, Contrast Media Mol. Imaging, 2016, 11, 77–88 CrossRef CAS PubMed.
- S. Li, Z. Guo, Y. Zhang, W. Xue and Z. Liu, ACS Appl. Mater. Interfaces, 2015, 7, 19153–19162 CAS.
- S. N. Baker and G. A. Baker, Angew. Chem., Int. Ed. Engl., 2010, 49, 6726–6744 CrossRef CAS PubMed.
- L. Zhou, B. He, J. Huang, Z. Cheng, X. Xu and C. Wei, ACS Appl. Mater. Interfaces, 2014, 6, 7719–7727 CAS.
- P. Das and N. R. Jana, ACS Appl. Mater. Interfaces, 2014, 6, 4301–4309 CAS.
- Y. Zou, F. Y. Yan, L. F. Dai, Y. M. Luo, Y. Fu, N. Yang, J. Y. Wun and L. Chen, Carbon, 2014, 77, 1148–1156 CrossRef CAS.
- C. Liu, P. Zhang, X. Zhai, F. Tian, W. Li, J. Yang, Y. Liu, H. Wang, W. Wang and W. Liu, Biomaterials, 2012, 33, 3604–3613 CrossRef CAS PubMed.
- D. Zhong, Y. Jiao, Y. Zhang, W. Zhang, N. Li, Q. Zuo, Q. Wang, W. Xue and Z. Liu, Biomaterials, 2013, 34, 294–305 CrossRef CAS PubMed.
- B. I. Cerda-Cristerna, H. Flores, A. Pozos-Guillen, E. Perez, C. Sevrin and C. Grandfils, J. Controlled Release, 2011, 153, 269–277 CrossRef CAS PubMed.
Footnote |
| † The authors contributed equally to this work. |
| This journal is © The Royal Society of Chemistry 2017 |

