
 Open Access Article
 This Open Access Article is licensed under a
 Creative Commons Attribution 3.0 Unported Licence
Adsorption properties of pyridylphenylene dendrimers†
Olga Serenko*a,
Pavel Strashnov a,
Gennadiy Kapustinb,
Mikhail Kalininc,
Nina Kuchkinaa,
Elena Serkovaa,
Zinaida Shifrinaa and
Aziz Muzafarova
a,
Gennadiy Kapustinb,
Mikhail Kalininc,
Nina Kuchkinaa,
Elena Serkovaa,
Zinaida Shifrinaa and
Aziz Muzafarova
aA. N. Nesmeyanov Institute of Organoelement Compounds, Russian Academy of Sciences, 28 Vavilov St, Moscow 119991, Russia. E-mail: oserenko@yandex.ru
bN. D. Zelinsky Institute of Organic Chemistry, Russian Academy of Sciences, 47 Leninsky Prospect, Moscow 119991, Russia
cMoscow State University of Design and Technology, 33 Sadovnicheskaya St, Moscow 117997, Russia
First published on 9th January 2017
Abstract
Here we report a sorption and surface properties study of the first three generations of polypyridylphenylene dendrimers. A BET analysis of N2 adsorption/desorption isotherms at 77 K yielded specific surface area values not exceeding 100 m2 g−1, while theoretical estimates predicted large pore volumes and surface areas of thousands of square meters per gram. By means of MD simulations, we showed this difference to be due to the close packing of dendrimers in bulk. T-plot and BJH analyses revealed the mesoporous character of the studied systems, with pore sizes comparable to the diameters of the individual dendrimer molecules. The measured adsorption/desorption isotherms of water vapor on dendrimer generations 1 and 3 implied a chemisorption process involving the formation of hydrogen bonds.
Introduction
Dendrimers are complex monodisperse macromolecules with a regular and highly branched three-dimensional architecture and well-defined chemical structure, and are outstanding structurally ordered systems. Research on dendrimers is still one of the hottest fields in macromolecular chemistry,1–3 and so far more than one hundred types of dendrimers have been investigated.The chemical composition of dendrimers determines the stiffness of their molecular structure and the characteristics of the variation of their segmental density. For example, for flexible carbosilane dendrimers, a uniform distribution of segmental density is typical,4 while for rigid polyphenylene dendrimers the highest density is characteristically found at the periphery of macromolecule.5
Despite such differences in the density distribution through the dendrimer macromolecule, both flexible and rigid dendrimers contain inner cavities accessible to solvent. This feature makes it possible to use them as nanocontainers or nanoreactors that implement “guest–host” molecular interactions. Dendrimers have also been used as capping molecules for the synthesis of metal nanoparticles,6,7 and for targeted delivery of bioactive molecules in gene therapy.8–10 Due to the solvent accessibility of the dendrimer voids, directed molecular design of dendrimers can include chemical modifications of their interior and periphery and hence provide an approach for developing chemical sensors.1,2,11,12 PAMAM or carbosilane dendrimers can be used to accomplish such developments by adsorbing to surfaces via “grafting to” or “grafting from”13–19 procedures. The formation of PAMAM monolayers on solids has been discussed by Crooks and others,20,21 and a polyphenylene dendrimer monolayer formed using the electrospray method has been reported recently.22–24
Despite progress in the development of dendrimer-modified sorbents, information on specific surface areas (SSAs) of dendrimers in the solid state is very limited. Considering the presence of voids and the nanosize of dendrimers, one can assume their SSA values to be high. Direct measurements of the SSAs of dendrimers can provide valuable data on the porosity of the material and on the extent of intermolecular interactions and molecular packing. Since pyridylphenylene dendrimers are rigid macromolecules, they can have extrinsic porosity that depends on steric hindrances between the dendrons. A high degree of intermolecular penetration would be expected to lead to low porosity and low SSA values, whereas the SSA values of non-penetrating dendrimers would be expected to be similar to those of the free molecules. This feature makes the comparison of an experimentally measured surface area and calculated solvent accessible surface area (SASA) of a free molecule a measure of the degree of intermolecular penetration and molecular packing.
Rigid dendrimers seem to be a suitable model for adsorption studies, since they are solids in a wide temperature range.1,2,25 Adsorption experiments on rigid triazine dendrimers have shown26 their co-planarity to provide an ordered structure with a porous morphology “in block” due to van der Waals interactions and hydrogen bonds. However, N2 is not adsorbed by dendrimers, probably because of its weak van der Waals interactions with the dendritic porous surface. On the other hand, triazine dendrimers have been shown to demonstrate the ability to capture molecules of CO2 because of its polarizability. Contrary to the above-discussed co-planar dendrimers, “traditional” dendrimers have been shown to display 3D spatial arrangements. In this work, we investigated and report the surface behavior of pyridylphenylene dendrimers, which we observed to be rigid dendritic macromolecules with such 3D spatial arrangements.
Experimental
Pyridylphenylene dendrimers of the first, second and third generations (G1, G2, G3) were used. The structural formula and a 3D image of the second-generation dendrimer used are shown below. The procedure used to synthesize the dendrimers and their molecular attributes are described elsewhere.27,28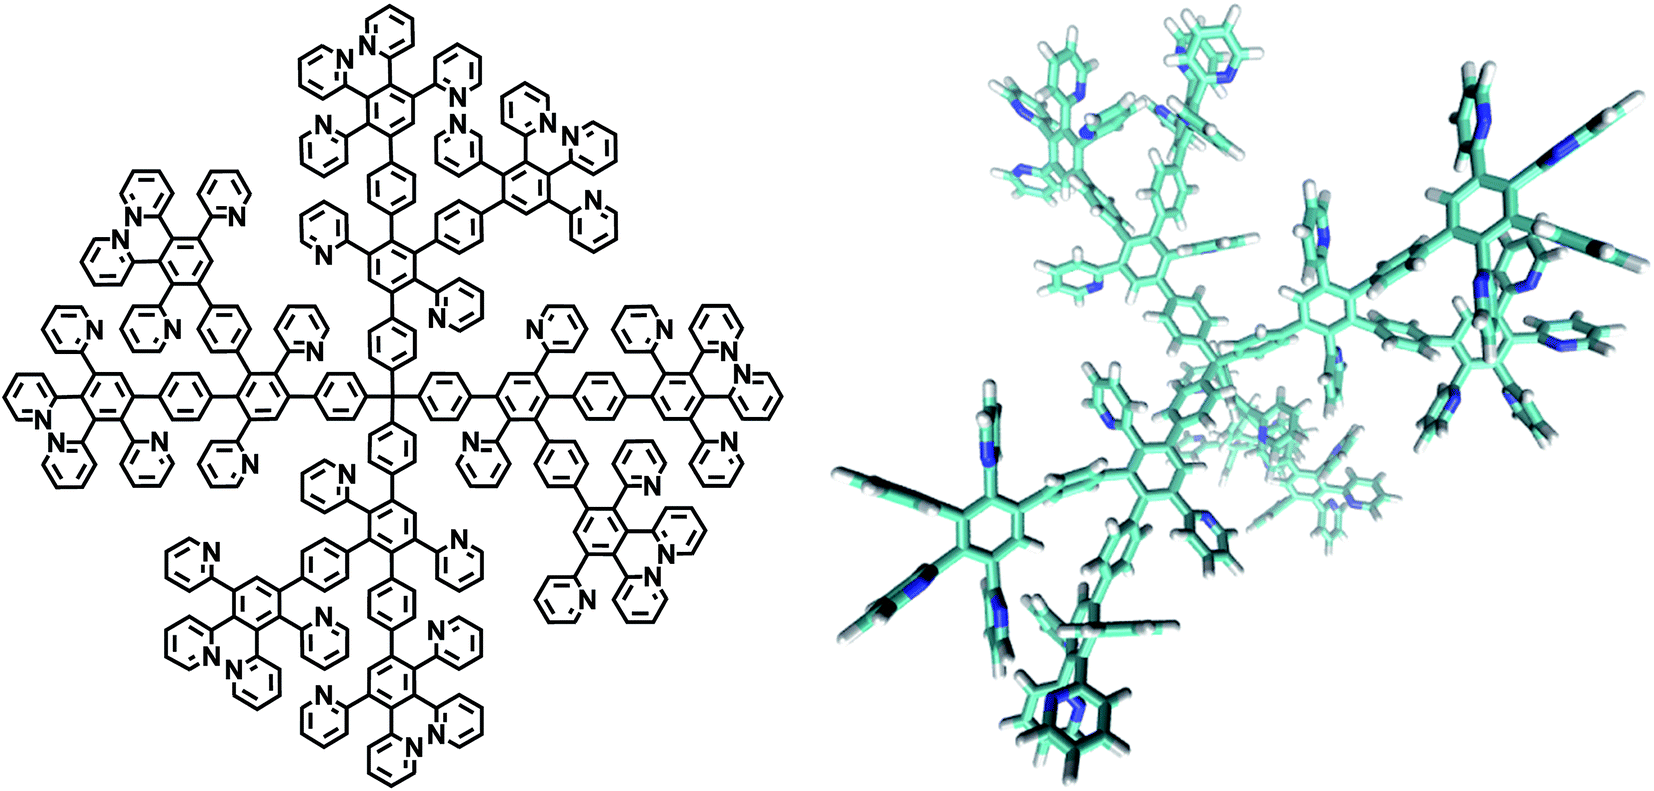
The morphology of the surface of a dendrimer powder was investigated by performing scanning microscopy with a JEOL JSM-6510LV microscope (JEOL, Japan). The dendrimer powder was placed on a conductive adhesive carbon tape and coated with 5 nm of platinum using a JEOL JFC-1600 magnetron sputtering system. Absolute densities of G1 to G3 dendrimers were determined using an AccuPyc 1340 automatic helium pycnometer (Micromeritics Instrument Corporation, USA).
The adsorption behavior of dendrimer samples was studied with a Gemini-VII analyzer (Micromeritics Instrument Corporation, USA). Nitrogen was used as an adsorbate, at 77 K. At the first stage, the samples were degassed at 423 K for 10–12 hours until the residual pressure reached 5–7 Pa.
Water vapor adsorption was measured at 298 K with McBain spiral quartz microbalances to an accuracy of 0.3–0.4 mm mg−1. Deionized water was preliminarily degassed. Samples of dendrimers were dried at 423 K and 1.33 × 10⁻² Pa until the weight was constant. The water vapor pressure was measured by using a mercury manometer with a precision of 0.02 mm and a KM-6 cathetometer, which also served to measure the spring elongation during adsorption.
Computer simulations
Equilibrated amorphous samples for an MD study were prepared using a compression and relaxation technique.29 The simulations were carried out using the LAMMPS molecular dynamics code with the PCFF force field.30 Electrostatic interactions were computed using the particle–particle particle–mesh algorithm, and long-range van der Waals interactions were calculated with a cutoff radius of 12 Å. The sampling of the equilibrated systems was carried out for 300 ps in an NPT ensemble under 3D periodic boundary conditions using a Nosé–Hoover thermostat (300 K) and barostat (1 bar).Results and discussion
Microphotographs of dendrimer powders are shown in Fig. 1. The G1 dendrimer formed dense spherical agglomerates with average dimensions of 160 ± 20 nm, but also formed smaller (40–80 nm) and larger (300–450 nm) particles. The G2 dendrimer agglomerates formed an elongated cylindrical shape, but with smaller dimensions, of 83 ± 10 nm. Unlike the G1 and G2 dendrimers, the G3 dendrimer formed shapeless micron-sized aggregates consisting of small particles of various sizes, from 25 nm to 300 nm. Table 1 shows molecular and physical characteristics of the studied dendrimers.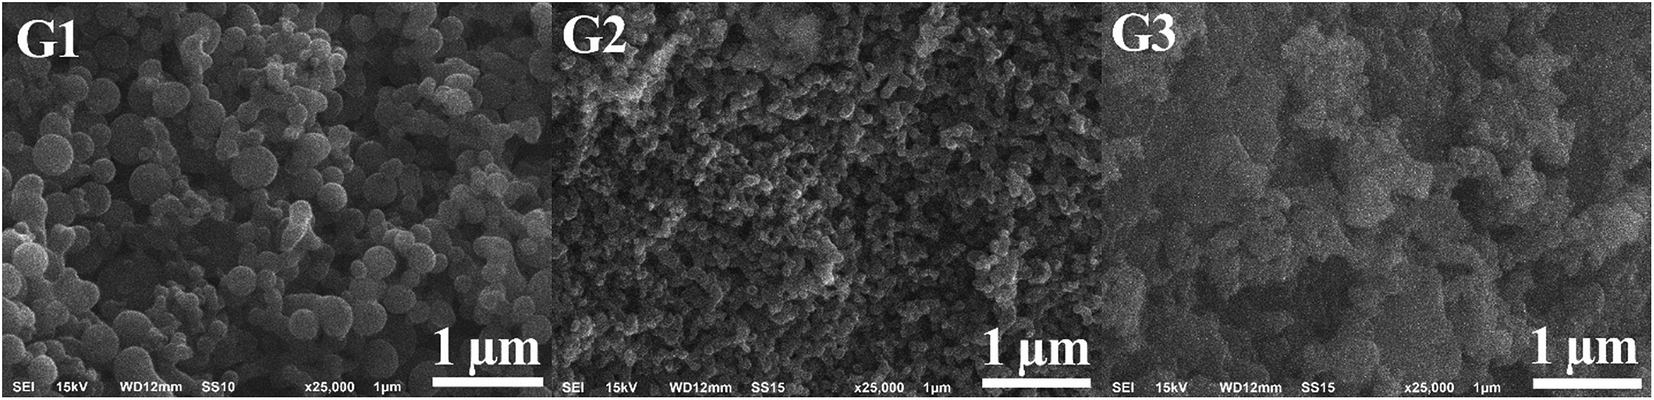 | ||
| Fig. 1 Microphotographs of dendrimer powder surfaces. ESI† shows SEM microphotographs of G1–G3 dendrimers at 0.5–5 μm scales. | ||
| Dendrimer | Rha, nm | ρ1b, g cm−3 | SSAc, m2 g−1 |
|---|---|---|---|
| a Hydrodynamic radii, obtained from DLS data.31b Absolute density determined using helium pycnometry.c SSA determined by calculating the solvent-accessible surface area of an isolated particle using a nitrogen probe with a radius R of 1.82 Å per mass unit. | |||
| G1 | 1.9 | 1.48 ± 0.02 | 7499 |
| G2 | 2.4 | 1.29 ± 0.01 | 6444 |
| G3 | 3.7 | 1.28 ± 0.01 | 5677 |
Theoretical estimates of the SSAs of individual dendrimer nanoparticles suggested high adsorption rates for all three generations of the studied dendrimers (Table 1).
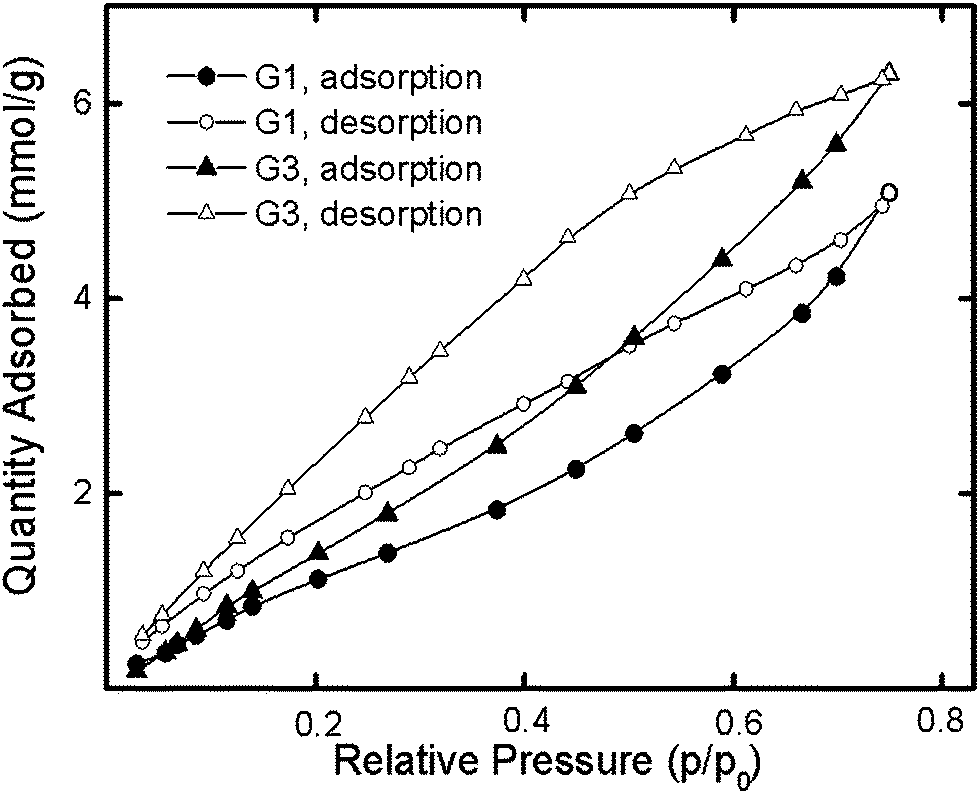
Low-temperature nitrogen adsorption isotherms are shown in Fig. 2a. Such isotherms are typical for physical adsorption and indicate the polymolecular nature of the adsorbed layers. Asymptotic approximation to the p = p0 line indicated the capillary condensation in the free space between particles.32
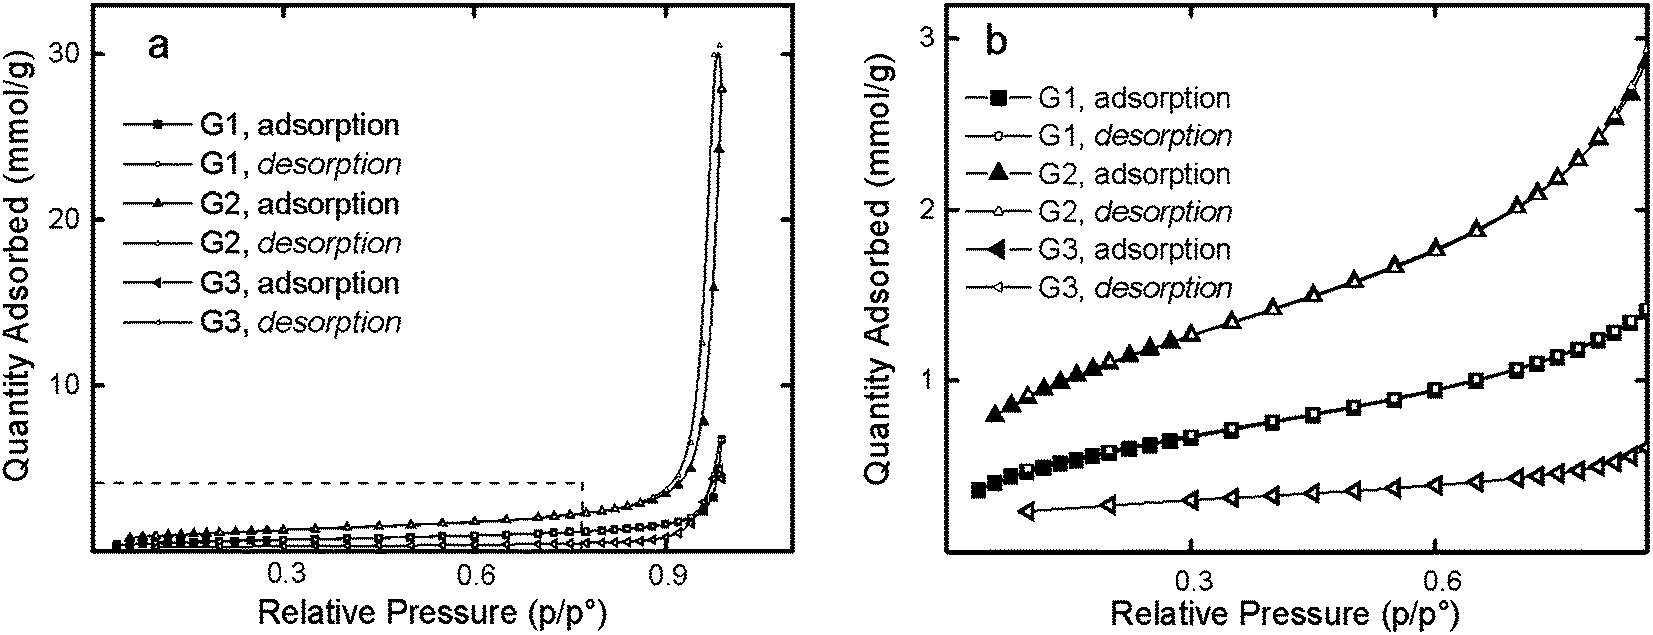 | ||
| Fig. 2 Overall view (a) and enlarged section (b) of nitrogen sorption–desorption isotherms for the G1, G2 and G3 dendrimers at 77 K. | ||
Nitrogen adsorption isotherms of the dendrimers were observed to contain a small hysteresis loop. Fig. 2b shows the initial section of sorption isotherms in the relative pressure range 0.06–0.8. The lowest sorption was characteristic of G3 dendrimers while the high sorption was peculiar to G2.
Table 2 shows the adsorption parameters of the studied dendrimers. Their SSAs were found to be two orders of magnitude smaller than those theoretically predicted for the corresponding isolated molecules.
| Dendrimer | Specific pore volume, cm3 g−1 | Method | |||||
|---|---|---|---|---|---|---|---|
| BET | BJH | T-plot | |||||
| S, m2 g−1 | Pore size, nm | S, m2 g−1 | Pore volume cm3 g−1 | Pore size, nm | S, m2 g−1 | ||
| G1 | 0.105 | 47 | 9.0 | 41 | 0.114 | 11.4 | 50 |
| G2 | 0.619 | 87 | 28.4 | 86 | 0.674 | 31.4 | 91 |
| G3 | 0.141 | 18 | 12.3 | 17 | 0.150 | 35.5 | 19 |
According to a t-plot analysis, the dendrimers were shown not to form micropores, and to form mesopores with dimensions exceeding the diameter of the individual dendrimer (Table 2). Whereas the dendrimer diameter varied from 3.8 nm to 7.4 nm (Table 1), the pore size was determined according to BET analysis to be between 9.0 nm and 28.4 nm. Fig. 3 shows the BJH adsorption cumulative areas for the G1, G2, and G3 dendrimers. The surface areas for G1 and G3 resulted from mesopores with dimensions of 5 nm, whereas for G2, the meso- and macropores with dimensions of 20–90 nm contributed to the surface area. The similar sizes of the dense G1 and G3 dendrimer agglomerates could explain the similarities of their respective cumulative area curves (Fig. 3), whereas the different particle size and shape of G2 clarified the observation that the significant contribution of its macropores to its surface area was unlike that of either of the others. Altogether, these results suggested dense dendrimer aggregates to be impenetrable to nitrogen molecules, thus resulting in no contribution of the inner dendrimer area to the porosity of the material. We can assume this behavior to be due to the dense packing of dendrimers and the large area of close intermolecular contacts. Another piece of evidence supporting this concept was the G2 specific surface area—average G2 agglomerates were found to be smaller than those of G1 and G2 (Fig. 1), and therefore to have larger SSAs.
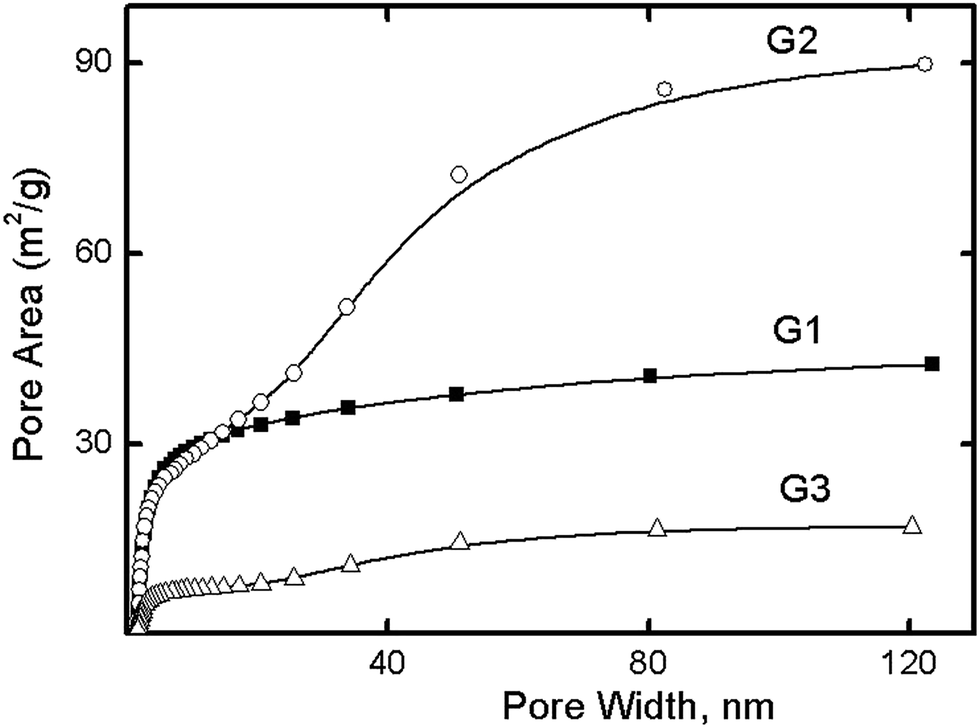 | ||
| Fig. 3 BJH adsorption cumulative areas for G1, G2, and G3. | ||
We supposed that the pyridine moieties in the dendrimers might provide for the successful sorption of polar compounds, such as water. Assuming the nitrogen atom of the pyridyl groups to be the sorption center,33 we expected more effective sorption for G1 than for G3, since the percentage of pyridine groups is higher in the former than in the latter. However, G1 and G3 yielded water sorption isotherms (Fig. 4) showing the opposite result.
 | ||
| Fig. 4 Water sorption–desorption isotherms at 298 K for G1 and G3. | ||
It should be noted that water is a specific adsorbate, and even at small extents of adsorbent surface filling, water molecules have shown a tendency to associate with each other in hydrogen-bonded complexes adjacent to the surface of the dendrimer.34 To analyze the experimental data, the Langmuir equation was used, since it assumes the presence of hydrophilic adsorption centers. The results obtained in the current study were in good agreement with the linear Langmuir equation at low pressures (p/p0 = 0.1–0.35). Calculated values for the sorption capacities αm of monolayer water by the G1 and G3 dendrimers are given in Table 3.
| Dendrimer | αm, mmol g−1 (according to chemical structure) | αm, mmol g−1 (Langmuir equation) | αm, mmol g−1 (according to eqn (1)) | αm, mmol g−1 (Dubinin comparison method) |
|---|---|---|---|---|
| G1 | 8.61 | 4.95 | 1.73 | 8.55 |
| G3 | 7.96 | 10.75 | 3.20 | 11.90 |
Another equation for the calculation of water sorption was previously proposed35 for hydrophilic biopolymers. This equation is
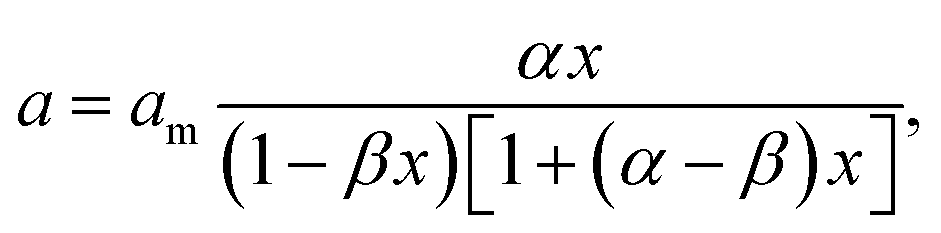 | (1) |
The adsorbance capacity αm values for G1 and G3 were also obtained using the Dubinin approach: the water sorption isotherms for G1 and G3 were compared with that of a sample containing a known number of sorption centers.34 One of the determinants of this comparative method is the identity of the chemical nature of the analyzed sample and the reference. In this work, we used oxidized activated carbon SKT-4 as a reference. It has 7.74 mmol of primary adsorption centers of water per gram, leading to values of 8.61 mmol g−1 and 7.96 mmol g−1 for G1 and G3, respectively.
The relationship between the water sorption of the dendrimers and the specific sorption (a/am) with activated carbon is shown in Fig. 5. The p/p0 ratios for both dendrimers and the reference were the same. In this case, the slope of the line in Fig. 5 would be proportional to the number of sorption centers of the dendrimers, i.e., am. The results for the dendrimers studied are listed in Table 3.
 | ||
| Fig. 5 The dependence of water adsorption on relative adsorption for G1 and G3. | ||
The different methods yielded sorption capacities (Table 3) that differed from each other and from theoretically calculated values based on the chemical formula of the dendrimers.
For G1, the am values were found to be less than theoretically calculated values, suggesting the inaccessibility of some sorption centers to water. This relationship was not observed for G3. The greater amount of water sorbed by G3 than by G1 (Fig. 4) can be attributed to the peculiarity of the sorption process for G3. Unlike G1, third-generation dendrimers have both peripheral and inner sorption centers that are obviously accessible to water molecules in different manners. The diffusion of adsorbate to nitrogen atoms of the inner part of the G3 dendrimer was apparently difficult because of the hydrogen-bond interactions of this dendrimer with water that had already been absorbed. The G3 structure provided for both primary and secondary sorption processes and explained the greater sorption by G3 than by G1. The calculations of sorption capacity carried out using the methods discussed above do not consider such a possibility. The bigger G3 hysteresis loop compared to G1 indirectly revealed this assumption. Due to the lower accessibility of the inner nitrogen groups of the G3 dendrimer, its desorption was slower than that of G1.
For both dendrimers, the desorption branch of the water sorption–desorption isotherm did not overlap with the sorption branch at low p/p0 levels (Fig. 4). The presence of residual water revealed the chemisorption process provided by hydrogen bond formation. The sorption capacity at p/p0 = 0.913 was measured to be almost the same, specifically 10.01 mmol g−1 and 10.15 mmol g−1 for G1 and G3, respectively, despite the kinetically different sorption processes for dendrimers of different generations. Also, the values exceeded the theoretically calculated chemisorption for these dendrimers. Thus, the molecular surfaces of the dendrimers did not participate in the physical adsorption process because the dendrimers aggregated. On the other hand, in the case of chemisorption, the occurrence of hydrogen bonds between functional groups of the dendrimers and the adsorbate provided effective sorption, wherein both the inner and peripheral functional groups of the dendrimers were able to serve as centers of sorption.
It is well known that various properties of materials, in particular sorption ability, depend on molecular packing density. Dendrimers of interest are rigid nanoparticles and have a shape that allows for formation of intermolecular contacts over a significant area. A possible mutual arrangement of two interacting G2 dendrimers is shown in Fig. 6. These dendrimers appear to be able to form contacts over a large area, with no steric hindrances to such molecular packing.
 | ||
| Fig. 6 Probable packing arrangement of the second-generation dendrimers (G2). | ||
To construct a model of an atomic-level G1 system featuring realistic molecular packing in silico, we used the 21-step compression and relaxation scheme of Larsen et al.29 This algorithm has shown consistent results (density and pore size distribution) for rigid molecular systems, independent of initial conditions. A system of 125 G1 particles having an initial density of 0.5 g cm−3 was subjected to the 21-step compression and relaxation scheme (Pmax = 50 kbar, Pfinal = 50 kbar, Tmax = 1000 K). The final density averaged over four independent simulations was 1.119 ± 0.002 g cm−3. The specific surface area of the G1 dendrimer, measured as SASA with a probe radius of 1.82 Å and averaged over all the particles, was determined to be 74.01 ± 51.51 m2 g−1. This value was consistent with the specific surface area values obtained using BET theory (Table 2) and suggested the very large difference between the theoretical assessments for individual molecules and the experimental values to be due to the dense molecular packing of the bulk dendrimer.
Conclusions
For the first time, the sorption properties of pyridylphenylene dendrimers have been elucidated. The specific surface areas of dendrimers defined using traditional methods for adsorption analysis did not exceed 100 m2 g−1. The large difference between the theoretically predicted maximum specific surface area and the experimental values was a consequence of the dense molecular packing of dendrimer particles. Thus, the surfaces of the dendrimers, as formed, could not participate in physical adsorption because of the large intermolecular contact area. In contrast, in the case of chemisorption, the nitrogen atoms of the dendrimers served as active sorption centers and hence promoted an effective adsorption.The high degree of intermolecular interactions and the interpenetration of dendrimer macromolecules were likely the cause of the lack of formation of micropores on the surfaces of the first-generation pyridylphenylene dendrimers. This relationship allows us to propose a molecular design route for directly increasing the sorption area of solid, rigid dendrimers, namely by loosening the intermolecular interactions, which can be accomplished in turn by modifying the surface groups or by introducing higher generation of dendrimers.
Acknowledgements
Financial support from the Russian Science Foundation is gratefully acknowledged (project No. 15-13-30026). The authors thank the Mendeleev University of Chemical Technology of Russia CCU for technical support.References
- D. Turp, T.-T.-T. Nguyen, M. Baumgarten and K. Mullen, New J. Chem., 2012, 36, 282–298 RSC.
- A. C. Grimsdale and K. Müllen, Angew. Chem., Int. Ed., 2005, 44, 5592–5629 CrossRef CAS PubMed.
- M. Seiler, Chem. Eng. Technol., 2002, 25, 237–253 CrossRef CAS.
- A. I. Kuklin, A. Kh. Islamov, G. M. Ignat'eva, L. A. Ozerina, N. A. Shumilkina, V. D. Myakushev, E. Yu. Sharipov, A. M. Muzafarov, A. N. Ozerin, R. I. Mukhamedzyanov and V. I. Gordelii, Polym. Sci., Ser. A, 2002, 44, 1273–1280 Search PubMed.
- S. Rosenfeldt, N. Dingenouts, D. Pötschke, M. Ballauff, A. J. Berresheim, K. Müllen, P. Lindner and K. Saalwächter, J. Lumin., 2005, 111, 225–238 CrossRef CAS.
- L. M. Bronstein and Z. B. Shifrina, Chem. Rev., 2011, 111, 5301–5344 CrossRef CAS PubMed.
- C. Kaewtong, G. Jiang, R. Ponnapati, B. Pulpoka and R. Advincula, Soft Matter, 2010, 6, 5316–5319 RSC.
- J. Yang, Q. Zhang, H. Chang and Y. Cheng, Chem. Rev., 2015, 115, 5274–5300 CrossRef CAS PubMed.
- P. T. Wong, K. Tang, A. Coulter, S. Tang, J. R. Baker and S. K. Choi, Biomacromolecules, 2014, 15, 4134–4145 CrossRef CAS PubMed.
- M. Sun, A. Fan, Z. Wang and Y. Zhao, Soft Matter, 2012, 8, 4301–4305 RSC.
- J. Satija, V. V. R. Sai and S. Mukherji, J. Mater. Chem., 2011, 21, 14367–14386 RSC.
- G. A. Evtyugin and E. E. Stoikova, J. Anal. Chem., 2015, 70, 517–534 CrossRef CAS.
- B. Fadhel, M. Hearn and A. Chaffee, Microporous Mesoporous Mater., 2009, 123, 140–149 CrossRef CAS.
- M. L. Ainalem, R. A. Campbell and T. Nylander, Langmuir, 2010, 26, 8625–8635 CrossRef CAS PubMed.
- B. Gonzalez, M. Colilla, C. L. de Laorden and M. Vallet-Regi, J. Mater. Chem., 2009, 19, 9012–9024 RSC.
- Y. Jing, L. Wei, Y. Wang and Y. Yu, Microporous Mesoporous Mater., 2014, 183, 124–133 CrossRef CAS.
- Y. Li, J. Yang, C. Huang, L. Wang, J. Wang and J. Chen, J. Chromatogr. A, 2015, 1392, 28–36 CrossRef CAS PubMed.
- E. J. Acosta, C. S. Carr, E. E. Simanek and D. F. Shantz, Adv. Mater., 2004, 16, 985–989 CrossRef CAS.
- Á. Martínez, E. Fuentes-Paniagua, A. Baeza, J. Sánchez-Nieves, M. Cicuéndez, R. Gómez, F. J. de la Mata, B. González and M. Vallet-Regí, Chem.–Eur. J., 2015, 21, 15651–15666 CrossRef PubMed.
- M. Wells, D. L. Dermody, H. C. Yang, T. Kim, R. M. Crooks and a J. Ricco, Langmuir, 1996, 12, 1989–1996 CrossRef CAS.
- K. J. Shah, T. Imae and A. Shukla, RSC Adv., 2015, 5, 35985–35992 RSC.
- D. Lubczyk, C. Siering, J. Lörgen, Z. B. Shifrina, K. Müllen and S. R. Waldvogel, Sens. Actuators, B, 2010, 143, 561–566 CrossRef CAS.
- D. Lubczyk, M. Grill, M. Baumgarten, S. R. Waldvogel and K. Müllen, Chempluschem, 2012, 77, 102–105 CrossRef CAS.
- M. Brutschy, R. Stangenberg, C. Beer, D. Lubczyk, M. Baumgarten, K. Müllen and S. R. Waldvogel, Chempluschem, 2015, 80, 54–56 CrossRef CAS.
- M. S. Rajadurai, Z. B. Shifrina, N. V Kuchkina, A. L. Rusanov and K. Müllen, Russ. Chem. Rev., 2007, 76, 767 CrossRef CAS.
- C.-H. Lee, M.-R. Tsai, Y.-T. Chang, L.-L. Lai, K.-L. Lu and K.-L. Cheng, Chem.–Eur. J., 2013, 19, 10573–10579 CrossRef CAS PubMed.
- Z. B. Shifrina, M. S. Averina, N. V Firsova, A. L. Rusanov and K. Muellen, Dokl. Chem., 2005, 400, 34–38 CrossRef CAS.
- Z. B. Shifrina, M. S. Rajadurai, N. V. Firsova, L. M. Bronstein, X. Huang, A. L. Rusanov and K. Muellen, Macromolecules, 2005, 38, 9920–9932 CrossRef CAS.
- G. S. Larsen, P. Lin, K. E. Hart and C. M. Colina, Macromolecules, 2011, 44, 6944–6951 CrossRef CAS.
- S. Plimpton, J. Comput. Phys., 1995, 117, 1–19 CrossRef CAS.
- E. V. Andreitchenko, C. G. Clark, R. E. Bauer, G. Lieser and K. Müllen, Angew. Chem., Int. Ed., 2005, 44, 6348–6354 CrossRef CAS PubMed.
- J. M. Casper, J. Polym. Sci., Polym. Lett. Ed., 1977, 15, 632–633 CrossRef.
- D. W. van Krevelen and P. J. Hoftyzer, Properties of Polymers, Correlations with Chemical Structure, Elsevier, New York, 1972 Search PubMed.
- R. S. Vartapetyan, A. M. Voloshchuk, M. M. Dubinin and T. A. Moskovskaya, Bull. Acad. Sci. USSR, Div. Chem. Sci., 1988, 37, 1751–1755 CrossRef.
- V. V. Ugrozov, A. N. Filippov and Y. I. Sidorenko, Colloid J., 2007, 69, 232–236 CrossRef CAS.
Footnote |
| † Electronic supplementary information (ESI) available. See DOI: 10.1039/c6ra27064f |
| This journal is © The Royal Society of Chemistry 2017 |