
 Open Access Article
 This Open Access Article is licensed under a
 Creative Commons Attribution 3.0 Unported Licence
Few-layer TiO2–B nanosheets with N-doped graphene nanosheets as a highly robust anode for lithium-ion batteries†
Zhisong Han‡
 a,
Jun Peng‡a,
Li Liua,
Gang Wang*a,
Feng Yua and
Xuhong Guob
a,
Jun Peng‡a,
Li Liua,
Gang Wang*a,
Feng Yua and
Xuhong Guob
aSchool of Chemistry and Chemical Engineering, Key Laboratory for Green Processing of Chemical Engineering of Xinjiang Bingtuan, Key Laboratory of Materials-Oriented Chemical Engineering of Xinjiang Uygur Autonomous Region, Shihezi University, Shihezi 832003, P. R. China. E-mail: gwangshzu@163.com
bState Key Laboratory of Chemical Engineering, East China University of Science and Technology, Shanghai 200237, P. R. China
First published on 23rd January 2017
Abstract
We used a hydrothermal method to fabricate a N-doped TiO2–bronze/N-doped graphene nanocomposite (N-TiO2–B/NG). X-ray photoelectron spectroscopy confirmed that the nitrogen was successfully doped in the TiO2–B and graphene sheets. The N-TiO2–B/NG nanocomposites exhibited a high specific capacity, which was much higher than the capacities of pure TiO2–B. Our materials has a high specific capacity of 583.3 mA h g−1 in the first cycle, and at a high current density of 50C, the capacity was still as high as 153.3 mA h g−1. The stable cycling performance and excellent rate characteristics indicate this material has a great potential for high power lithium ion batteries.
1. Introduction
Tremendous research from both academy and industry has been dedicated to rechargeable lithium-ion batteries (LIBs) in the last few decades for the upcoming era of portable electronics, electric vehicles (EVs), and hybrid electric vehicles (HEVs).1–4 However, commercial Li-ion batteries still cannot satisfy the requirements of those large-scale power sources. They require breakthroughs in terms of power/energy density, safety, and long-term stability.5,6 As is known, the widely used anode material in commercial Li-ion battery is graphite. One concern for graphite is its low discharge potential, which may cause the decomposition of the organic electrolyte, resulting in a serious incident.7–9 As a result, numerous efforts have been devoted to developing safe, high-performance transition-metal oxide anode materials.6,10–12 In this respect, TiO2 has attracted significant attention because of its relatively high lithium insertion/extraction voltage (∼1.6 V vs. Li/Li+) and excellent stability. This improves the safety of the batteries versus traditional graphite anodes.13,14 In addition, its low volume variation (<4%) during the lithiation/delithiation process favors large-scale energy storage.15TiO2 has various polymorphs, including rutile, anatase, brookite and TiO2–B.16 Anatase is the most widely studied polymorph of TiO2 for LIBs but still faces some challenges in practical applications, mainly because of its low specific capacity. Luckily, TiO2–B (bronze), a relatively new polymorph of titania, is able to accommodate 1 Li+ per Ti, corresponding to a high theoretical capacity of 335 mA h g−1. However, the poor electronic and ionic conductivity of TiO2–B has limits in its application as a high power anode material.17,18 Meanwhile, unstable cell structure or continuous side reactions between the electrode material and the electrolyte will cause unsatisfactory cyclability.
Until now, various efforts have been made to improve the electronic conductivity and/or Li-ion diffusion ability of TiO2–B. One proposed strategy has been to coat conductive materials, such as carbon materials. Among all of the carbon materials, graphene has proven to be a very effective material to improve the conductivity and electrochemical performance of electrode materials/carbon composites due to its high conductivity and large surface area based on our previous works.6,11,17 Another strategy to improve the electrochemical performance of TiO2–B is to design nanostructures because nanostructured materials can facilitate the Li-ion diffusion in electrodes by shortening the Li-ion insertion/extraction pathway.19 Thus, various nanostructured TiO2–B, such as nanowires, nanotubes and nanosheets, have been studied as anode materials for Li-ion batteries.20–22 Furthermore, the electrochemical performance of TiO2 is also dependent on its crystalline phase and chemical doping.23 For example, nitrogen doping has been proven to be an effective strategy for improving the capacity of TiO2.24–26 In addition, it has also been proven that chemical doping of nitrogen is an effective method to improve the electrochemical performance of carbon materials since nitrogen doping can alter the electronic and chemical properties of carbon materials because of its comparable atomic size and five valence electrons that are available to form strong valence bonds with carbon atoms.27–29 Based on the above analysis, the combination of N-doped, nanostructured TiO2 and N-doped graphene (NG) would improve the electrochemical performance of TiO2. However, to the best of our knowledge, there are no such reports on composites of N-doped nanostructured TiO2–B nanosheets on the surface of NG nanosheets as electrodes for Li-ion batteries. Many researchers have suggested several methods to produce NG such as chemical vapor deposition (CVD),30 arc discharge,31 nitrogen plasma process,32 thermal annealing with nitrogen source,33 so on. Nevertheless, most of the methods have shown unavoidable disadvantages such as limited scale yields, long preparation time, and a complex procedure coupled with expensive equipment.
Herein, we have synthesized N-doped TiO2–B nanosheet/N-doped graphene composite (N-TiO2–B/NG) using hydrazine monohydrate as the nitrogen source, and both TiO2–B and the graphene nanosheets were doped by nitrogen atom at the same time with heat treatment due to the decomposition of hydrazine monohydrate. Electrochemical experiments showed that the as-prepared N-TiO2–B/NG exhibited excellent electrochemical performance as the anode material in a Li-ion battery.
2. Experimental section
2.1. Materials
Titanium isopropoxide (TTIP), polyethylene oxide–polypropylene oxide–polyethylene oxide (PEO20–PPO70–PEO20, Pluronic P123) and natural graphite powder (325 mesh) were purchased from Alfa-Aesar. Ethylene glycol was purchased from Beijing Chemical Reagent Factory. All other reagents were of analytical grade and used without further purification.2.2. Synthesis of N-TiO2–B/NG composites
Graphene oxide (GO) was synthesized from graphite powder according to the modified Hummers method.31–33 In a typical synthesis, titanium isopropoxide (TTIP, 1.05 g) was added into 0.74 g of concentrated HCl solution during vigorous stirring (bottle A), and 0.2 g polyethylene oxide–polypropylene oxide–polyethylene oxide (PEO20–PPO70–PEO20, Pluronic P123) was dissolved in 3.0 g of ethanol (EtOH) (bottle B). After stirring for 15 min, the solution in bottle B was added into bottle A and stirred for another 30 min. Graphene oxide (80 mg) was ultrasonicated in diethylene glycol (DEG, 20 mL) to produce a clear solution. Then, a 2.5 mL TTIP solution with 20 mL of a graphene oxide solution was transferred into a 45 mL autoclave and heated at 150 °C for 20 h. The products of the hydrothermal reaction were washed with ethanol three times, and the gray powders were collected after washing/centrifugation and drying at 80 °C for 24 h. Then, the obtained gray powder was put into a Teflon vessel containing 5 mL of hydrazine monohydrate without direct contact between the material and the hydrazine monohydrate. Then, the Teflon vessel was treated at 125 °C for 4 h to reduce the graphene oxide. After cooling to room temperature, the product was washed with deionized water. Finally, the material was further heat treated at 400 °C for 2 h in an argon flow with a heating rate of 1 °C min−1 to improve the crystallization of TiO2–B. For comparison, the TiO2–B nanosheets were synthesized using the same procedure only without the addition of GO.2.3. Materials characterization
X-ray diffraction (XRD) of the samples was measured on a Bruker AXS D8 X-ray diffractometer with a Cu-Kα X-ray source operating at 40 kV and 100 mA. The morphologies of the materials were observed using field-emission scanning electron microscope (FESEM, JEOL JSM-6700F) and transmission electron microscope (TEM, FEI Tecnai G2). X-ray photoelectron spectroscopic (XPS) measurements were made on a PHI1600 ESCA system. Thermogravimetric analysis (TGA) was carried out on a NETZSCH STA 449 F3 simultaneous thermal analyzer.2.4. Electrochemical measurement
The electrochemical experiments were performed using 2032-type coin cells with metallic lithium foil as the counter electrode. The working electrodes were prepared with active materials, carbon black, and PVDF binder at a weight ratio of 8![[thin space (1/6-em)]](https://www.rsc.org/images/entities/char_2009.gif) :1:1 in N-methyl-2 pyrrolidinone (NMP). The obtained slurry was coated onto Cu foil and dried at 120 °C for 12 h. The dried tape was then punched into round plates with a diameter of 12.0 mm to be used as the cathode electrodes. The loading density of the electrode was about 2 mg cm−2. The working electrode and counter electrode were separated by a Celgard 2400 membrane. The electrolyte used was 1 M LiPF6 dissolved in a mixture of ethyl carbonate (EC), dimethyl carbonate (DMC) and ethylmethyl carbonate (EMC) with a volume ratio of 1:1:1. The assembly of the cell was conducted in an Ar-filled glove box (H2O and O2 <1 ppm) followed by an overnight aging treatment before the test. Galvanostatic charge–discharge was measured on a LAND battery tester (LAND CT 2001A, China) in the voltage window of 1.0–3.0 V versus Li+/Li. All of the specific capacities were calculated on the basis of the total weight of the active materials. Cyclic voltammetry (CV) and electrochemical impedance spectroscopy (EIS) were measured using a potentiostat (CHI 604C, CH Instrumental Inc.). The impedance spectra were carried out in the frequency range from 100 kHz to 0.01 Hz.
:1:1 in N-methyl-2 pyrrolidinone (NMP). The obtained slurry was coated onto Cu foil and dried at 120 °C for 12 h. The dried tape was then punched into round plates with a diameter of 12.0 mm to be used as the cathode electrodes. The loading density of the electrode was about 2 mg cm−2. The working electrode and counter electrode were separated by a Celgard 2400 membrane. The electrolyte used was 1 M LiPF6 dissolved in a mixture of ethyl carbonate (EC), dimethyl carbonate (DMC) and ethylmethyl carbonate (EMC) with a volume ratio of 1:1:1. The assembly of the cell was conducted in an Ar-filled glove box (H2O and O2 <1 ppm) followed by an overnight aging treatment before the test. Galvanostatic charge–discharge was measured on a LAND battery tester (LAND CT 2001A, China) in the voltage window of 1.0–3.0 V versus Li+/Li. All of the specific capacities were calculated on the basis of the total weight of the active materials. Cyclic voltammetry (CV) and electrochemical impedance spectroscopy (EIS) were measured using a potentiostat (CHI 604C, CH Instrumental Inc.). The impedance spectra were carried out in the frequency range from 100 kHz to 0.01 Hz.
3. Results and discussion
We performed field-emission scanning electron microscopy (FESEM) and transmission electron microscopy (TEM) analyses on the synthesized TiO2–B nanosheets, and these are shown in Fig. 1. These nanosheets can be clearly distinguished in the SEM image (Fig. 1a) and low-magnification TEM image (Fig. 1b).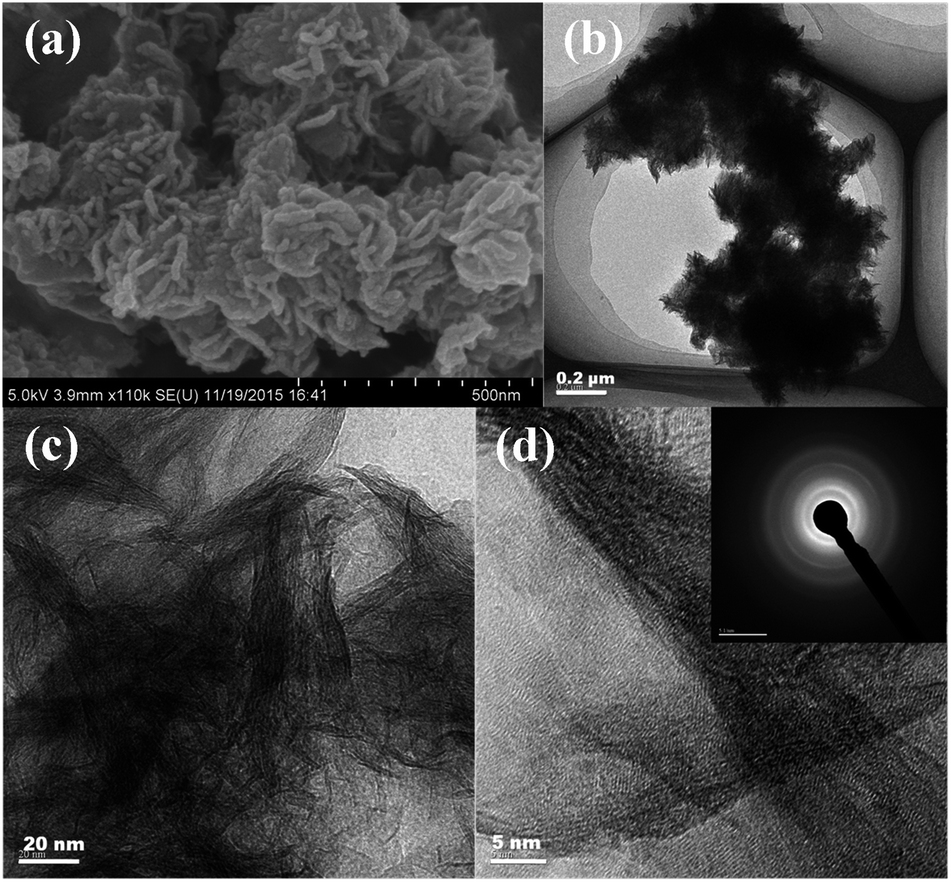 | ||
| Fig. 1 (a) SEM images and (b, c and d) TEM images of TiO2–B nanosheets. Inset in d shows the SAED pattern of TiO2–B nanosheets. | ||
They exist in the form of groups of nanosheets. The magnified TEM image (Fig. 1c) revealed that all nanosheets are rolled up due to surface tension, which is similar to the general behaviour of graphene. The HRTEM (Fig. 1d) and SAED pattern (inset in Fig. 1d) of the TiO2–B nanosheets have shown unsharp crystal lattice fingerprints and Debye Scherrer rings, indicating the poor crystalline nature of the TiO2–B nanosheets.
Fig. 2 shows the FESEM and TEM images of the N-TiO2–B/NG composite. From the FESEM image (Fig. 2a) we can see that the N-TiO2–B/NG composite was composed of a lot of layered nanosheets. The formation of such structures implies the successful growth of TiO2–B nanosheets-on-graphene, since only the aggregation of TiO2–B nanosheets with flower-like morphology is formed without the graphene support (Fig. 1a). From the TEM image of the N-TiO2–B/NG composite at a low magnification (Fig. 2c), we can see that the TiO2–B nanosheets are homogeneously loaded on the graphene nanosheets. The higher magnification TEM image revealed that the TiO2–B nanosheets only have 3 to 6 layers with a thickness of 2–4 nm (indicated by red arrows). The HRTEM of the N-TiO2–B/NG composite (Fig. 2e) clearly displays the lattice fringes of TiO2–B, indicating the highly crystalline nature of N-TiO2–B nanosheets in the TiO2–B/NG composite. The interplanar distance between the lattice fringes is 0.31 nm, which can be indexed to the (002) crystal plane of TiO2–B. The SAED pattern (insets in Fig. 2e) further reveals the perfect crystallinity of TiO2–B.
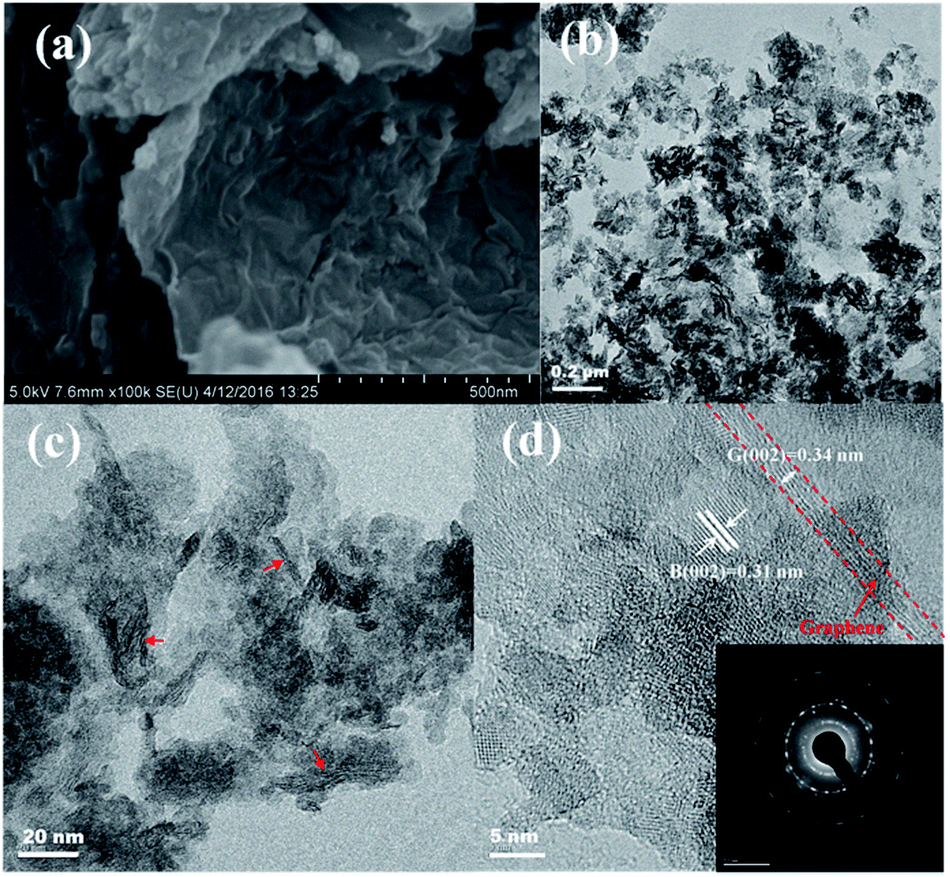 | ||
| Fig. 2 (a) SEM images and (b, c and d) TEM images of N-TiO2–B/NG composite. Inset in d shows the SAED pattern of N-TiO2–B/NG composite. | ||
XRD is performed to investigate the crystal structure of TiO2–B and N-TiO2–B/NG composite and is shown in Fig. 3a. All patterns exhibit the elaborate diffraction peaks of monoclinic TiO2–B in the C2/m space group (JCPDS no. 74-1940), which is in good agreement with the previous reports.12,18 The sharp diffraction peaks at ∼24.9°, ∼28.2° and ∼48.61° can be assigned to the (110), (002) and (020) reflections of the monoclinic TiO2(B), respectively. All the diffraction peaks are broad, indicating that the product is a nano-sized material as expected. The XRD pattern of the N-TiO2–B/NG composite is very similar to that of TiO2–B, indicating that the N-doped graphene does not affect the crystal structure of TiO2–B. However, it should be noted that the diffraction peaks of TiO2–B in the N-TiO2–B/NG composite show a higher intensity compared to that of the N-TiO2–B nanosheets, indicating that the presence of graphene can promoted the crystallization of TiO2–B in the calcination process at 400 °C, which is consistent with the TEM observed results. In addition, there are no characteristic XRD peaks of graphene observed in the N-TiO2–B/NG composite. This result is attributed to the destruction of the regular stacking of N-doped graphene upon anchoring the N-TiO2–B nanosheets and because it overlaps with the (110) peak of TiO2–B as well. To determine the specific content of graphene in the N-TiO2–B/NG composite, TGA was carried out (Fig. 3b). It can be observed that there were two steps of weight loss below 800 °C. The first step of weight loss below 200 °C is due to the loss of absorbed water for the composite, and this is followed by the second step of weight loss above 200 °C, which may be ascribed to the combustion of graphene into CO2. Thus, the graphene and TiO2–B content are estimated at approximately 11.4 and 88.6 wt%, respectively.
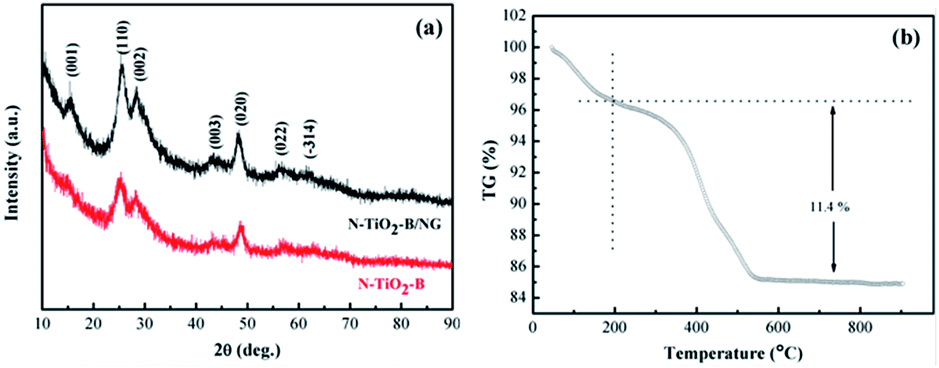 | ||
| Fig. 3 (a) XRD pattern of N-TiO2–B/NG and TiO2–B; (b) TGA curve of the N-TiO2–B/NG composite. | ||
The N-TiO2–B/NG composite was further investigated by XPS.
Fig. 4a shows the XPS survey spectrum of the N-TiO2–B/NG composite in the region of 0–800 eV. The spectrum indicated the presence of Ti, O, C and N, arising from N-TiO2–B and NG. As shown in the high resolution XPS spectrum of Ti 2p (Fig. 4b), the Ti 2p3/2 and Ti 2p1/2 peaks are located at the binding energies of 459.08 and 464.79 eV, respectively, which is in agreement with the value of Ti4+ in the TiO2 lattice.34 The spectrum of the experimental O 1s band obtained for the N-doped samples (Fig. 4c) can be deconvoluted into two components at 530.5 (main peak) and 531.8 eV, corresponding to O2− in the TiO2 lattice and the residual oxygen containing groups in graphene. The high-resolution C 1s peak (Fig. 4d) was centered at 284.8 eV, and the tail at higher binding energies indicated the existence of carbon atoms connected to N and O heteroatoms. The peak can be fitted to four peaks. The main peak observed at 284.8 eV can be assigned to C![[double bond, length as m-dash]](https://www.rsc.org/images/entities/char_e001.gif) C bonds, the peak at 285.6 eV assigned to C–N and C–O, the peak at 287 eV assigned to C–N and CO, and the peak at 289 eV assigned to N–CO. The relatively weak signals of the C–O and CO groups indicate that most of the oxygen is removed and GO is reduced to RGO. The broad N 1s XPS peak of the N-doped sample (Fig. 4d) can be fitted to five peaks of Ti–N (396.0 eV), pyridinic N (398.2 eV), pyrrolic N and O–Ti–N (399.6 eV), graphitic N (401.0 eV) and C–N–O (402.8 eV), indicating the successful doping of nitrogen atoms into the TiO2 lattice as well as into the graphene framework.35,36 The XPS also tell us the N content in graphene and TiO2–B is 4.4% and 2.3%, respectively. What is more, the content of pyridinic N, pyrrolic N, and graphitic N have been determined to be about 48%, 23% and 29%, respectively. The amount of pyridinic and pyrrolic N can provide more active sites for Li storage and facilitate the transfer of Li ions and electrons in the electrode.37,38
C bonds, the peak at 285.6 eV assigned to C–N and C–O, the peak at 287 eV assigned to C–N and CO, and the peak at 289 eV assigned to N–CO. The relatively weak signals of the C–O and CO groups indicate that most of the oxygen is removed and GO is reduced to RGO. The broad N 1s XPS peak of the N-doped sample (Fig. 4d) can be fitted to five peaks of Ti–N (396.0 eV), pyridinic N (398.2 eV), pyrrolic N and O–Ti–N (399.6 eV), graphitic N (401.0 eV) and C–N–O (402.8 eV), indicating the successful doping of nitrogen atoms into the TiO2 lattice as well as into the graphene framework.35,36 The XPS also tell us the N content in graphene and TiO2–B is 4.4% and 2.3%, respectively. What is more, the content of pyridinic N, pyrrolic N, and graphitic N have been determined to be about 48%, 23% and 29%, respectively. The amount of pyridinic and pyrrolic N can provide more active sites for Li storage and facilitate the transfer of Li ions and electrons in the electrode.37,38
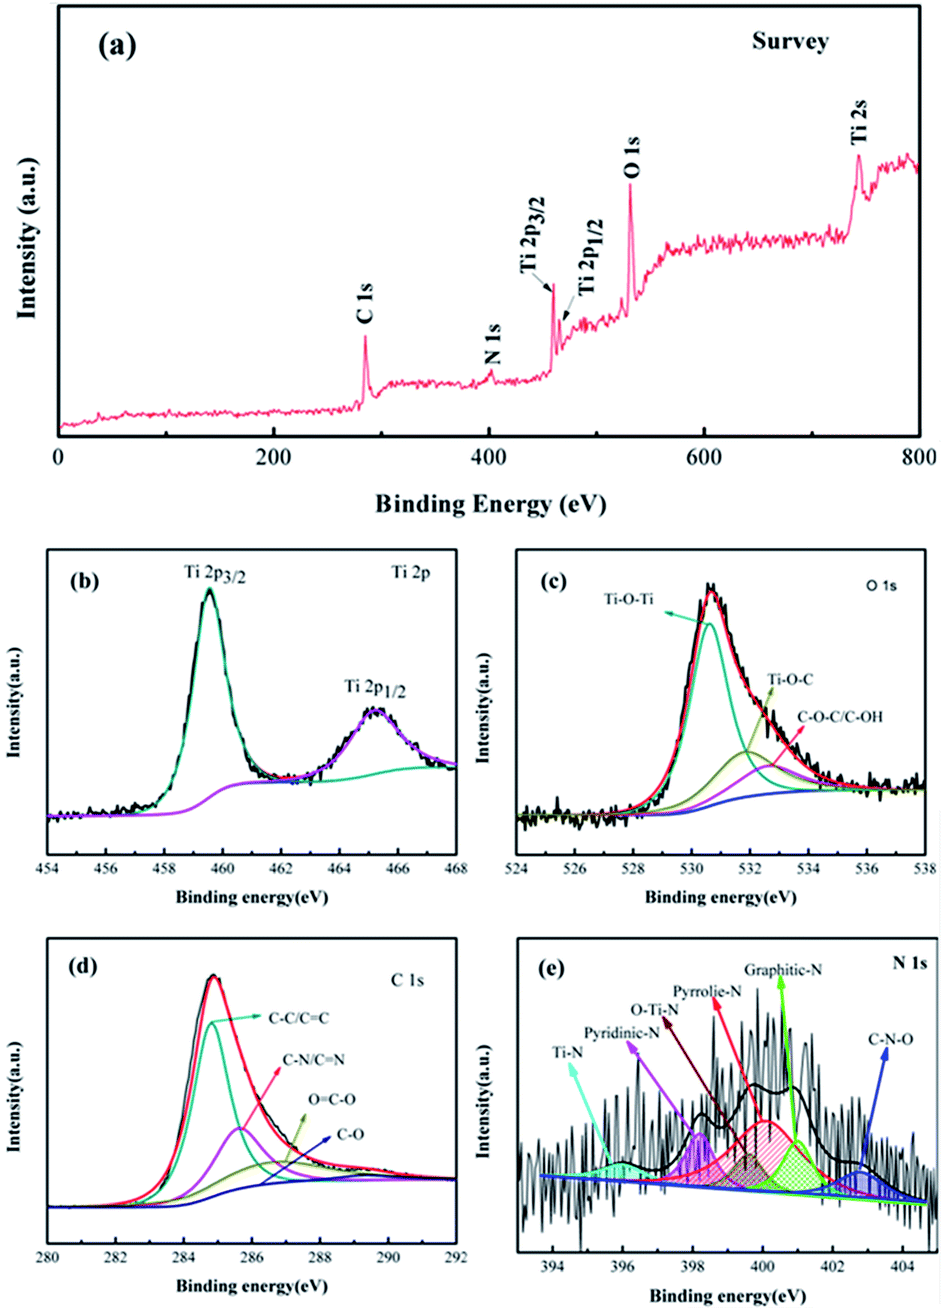 | ||
| Fig. 4 XPS spectra of the N-TiO2–B/NG composite. (a) XPS survey spectrum; (b) Ti 2p; (c) O 1s; (d) C 1s and (e) N 1s. | ||
In order to further verify the electrochemical properties of TiO2–B, TiO2–B/GNS and N-TiO2–B/NG, we tested the cyclic voltammograms (CVs). Fig. 5a–c shows the representative CVs curves for the different electrodes at a scan rate of 0.1 mV s−1. Two pairs of S peaks at approximately 1.5/1.6 V (vs. Li/Li+) and 1.55/1.65 V (vs. Li/Li+) are assigned to TiO2–B, and one pair of A peaks at approximately 1.75/1.9 V (vs. Li/Li+) is characteristic for Li insertion into anatase.32 Notably, the CVs show a broad feature highly similar to a typical pseudo capacitive behaviour, which arises from the TiO2–B nanosheets with a unique open crystal structure.39,40 The CVs from the 2nd and 3rd cycle nearly overlap, suggesting excellent reversibility upon Li+ insertion/extraction in these materials. Fig. 5d–f shows the CVs of TiO2–B, TiO2–B/GNS, N-TiO2–B/NG electrodes under different scan rates. All three samples show similar behaviors: the intensities of both the cathodic (discharge) and anodic (charge) currents increase with the scan rate over the entire potential window. All the peak positions slightly shift with the scan rate increase due to polarization. It can be seen that the corresponding electrode polarizations for TiO2–B/GNS and N-TiO2–B/NG are smaller than those of bare TiO2–B, indicating that the GNS and NG in the nanocomposite improves the electrochemical kinetics of the electrode. When the scan rate increases to 1.0 mV s−1, the CVs of N-TiO2–B/NG remain conspicuously intact, while that of TiO2–B and TiO2–B/GNS change, further indicating that the N-TiO2–B/NG has better electrochemical kinetic properties.
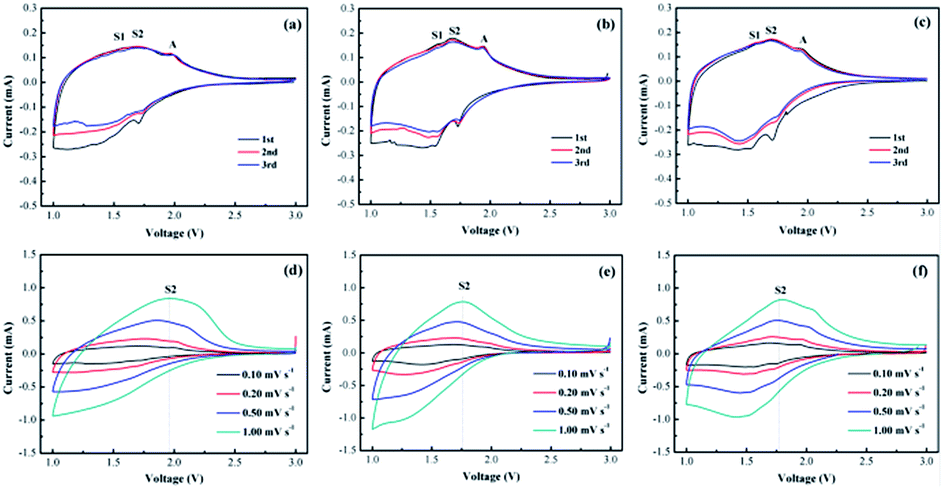 | ||
| Fig. 5 CVs of the (a) TiO2–B, (b) TiO2–B/GNS, and (c) N-TiO2–B/NG at a scan rate of 0.1 mV s−1 and CVs of the (d) TiO2–B, (e) TiO2–B/GNS, and (f) N-TiO2–B/NG at different scan rates. | ||
Fig. 6a–c compares the 1st, 2nd, 20th, 50th and 100th discharge/charge profiles of the TiO2–B, TiO2–B/GNS, and N-TiO2–B/NG at a current rate of 0.6C between 1.0 and 3.0 V (vs. Li+/Li). It can be seen that the first discharge/charge voltage profiles for the three electrodes are very similar and are consistent with their corresponding CV plots. TiO2–B nanosheets can deliver a capacity of only 512.7 mA h g−1 at the current density of 0.6C for the first discharge, while the first discharge capacity of TiO2–B/GNS and N-TiO2–B/NG increased to 574.6 and 583.3 mA h g−1, respectively. What is more, it should be emphasized that an obvious change in both the charge and discharge profiles is observed for the bare TiO2–B nanosheets in subsequent cycles, while no obvious changes are observed even after 100 cycles for TiO2–B/GNS and N-TiO2–B/NG, which further indicates that TiO2–B/GNS and N-TiO2–B/NG present a much better electrochemical lithium storage performance than the bare TiO2–B electrode. In Fig. 6d, it can be seen that the reversible capacity of the bare TiO2–B nanosheets rapidly decreases from 385.6 to 210 mA h g−1 up to 100 cycles with a capacity retention of only 54.6%, while the reversible capacity of the N-TiO2–B/NG slightly decreases with cycling and reaches 326.4 mA h g−1 after 100 cycles, showing a high capacity retention of 67.8%. It is important to note that there is an obvious synergistic effect among TiO2–B, GNS and N-doping in the composite, which plays a central role in the excellent cyclic performance of the N-TiO2–B/NG composite. Apparently, the performance of the N-TiO2–B/NG composite is superior to that of most of the previously reported TiO2–graphene nanomaterials.41,42
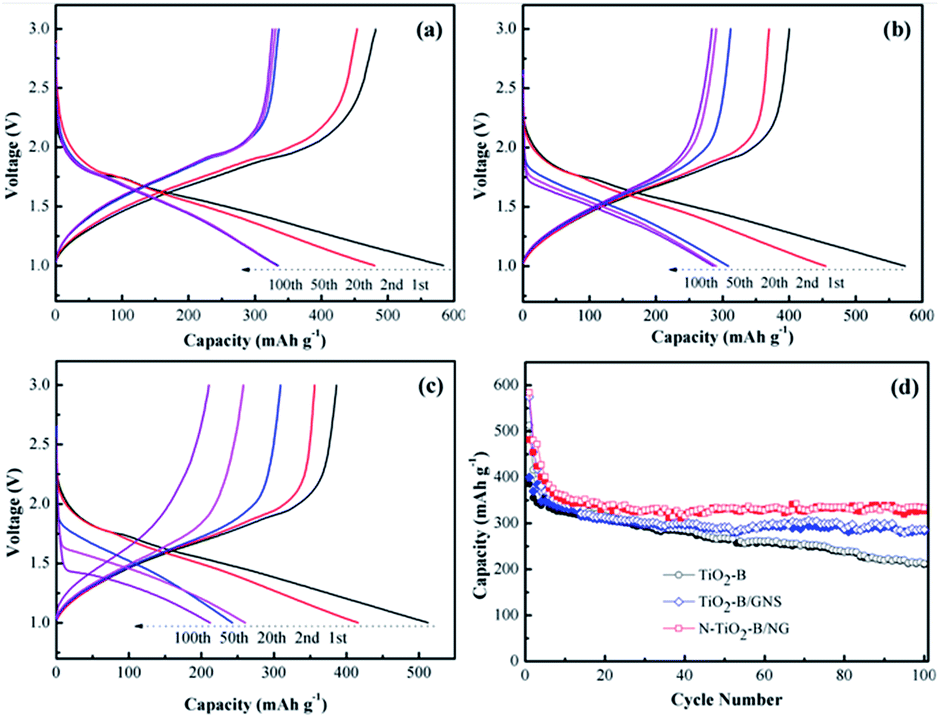 | ||
| Fig. 6 Galvanostatic discharge–charge curves of (a) N-TiO2–B/NG, (b) TiO2–B/GNS and (c) TiO2–B nanosheets cycled at the 1st, 2nd, 20th, 50th, and 100th between 1.0 and 3 V (vs. Li/Li+) at 0.6C; (d) cycling stability of TiO2–B, TiO2–B/GNS and N-TiO2–B/NG at 0.6C. | ||
Fig. 7a compares the rate performance of TiO2–B, TiO2–B/GNS and N-TiO2–B/NG composites under different current densities. It can be clearly observed that the reversible capacity gradually decreases as the current density increases. Upon increasing the discharge–charge rates to 2C, 5C, 10C, 20C, and 50C, the reversible capacities of N-TiO2–B/NG were maintained at about 236.3, 216.1, 204.6, 185.6 and 153.3 mA h g−1, respectively, but there was only 35 mA h g−1 for the bare TiO2–B at the current density of 50C, indicating that the graphene and N-doping in the composite effectively improved the rate performance of the electrode. It was noted that, when the current density recovered to 1C after the rate performance test, the reversible capacities of N-TiO2–B/NG returned back to approximately their initial value, which further indicated the excellent reversibility of N-TiO2–B/NG. Thus, the N-TiO2–B/NG composite shows promising electrochemical properties as a high capacity LIB anode material.
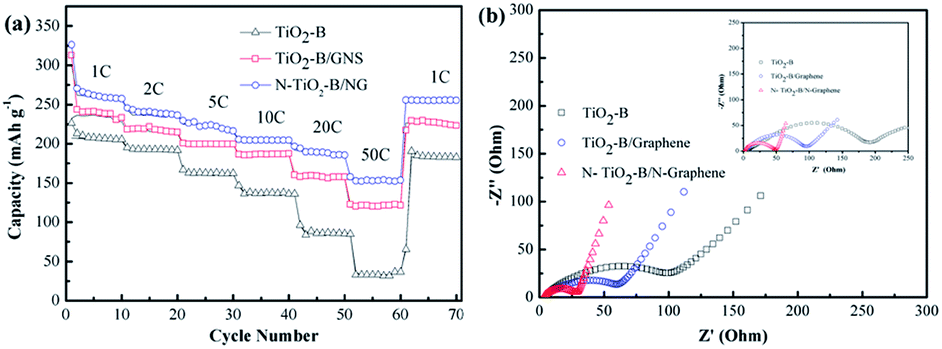 | ||
| Fig. 7 (a) Rate performances of different composites from 1C to 50C; (b) Nyquist plots of different samples. Inset in b shows the Nyquist plots of the corresponding samples after 100 cycles. | ||
The electrochemical impedance spectroscopy was also used to evaluate the electrochemical performance of the as-prepared samples. As shown in Fig. 7b, the Nyquist plots of all three samples have shown the typical characteristics of one semicircle in the middle-high frequency range and a sloping straight line in the low frequency. The semicircle in the middle frequency range indicated the charge-transfer resistance (Rct), relating to the charge transfer through the electrode/electrolyte interface. From Fig. 7b, it can be found that the radius of the semicircle of the N-TiO2–B/NG electrode is the smallest and that of the TiO2–B is the largest among the three samples. The smaller radius of the semicircle indicates the lower Rct. Therefore, the Rct of the N-TiO2–B/NG electrode is much smaller than that of the TiO2–B electrode, indicating that the Rct of the TiO2 electrode can be lowered by doping N atoms into TiO2 in combination with N-doped graphene nanosheets. The Nyquist plots of the three samples after 100 cycles (inset in Fig. 7b) show that the Rct of the TiO2–B and TiO2–B/GNS samples increased to some extent after 100 cycles, but the Rct of N-TiO2–B/NG after 100 cycles had almost no change, indicating the high stability of the N-TiO2–B/NG composites during long charge/discharge cycles.
4. Conclusions
The N-TiO2–B/NG composite has been successfully prepared by a facile hydrothermal method combined with a hydrazine monohydrate vapor reduction method. XPS analysis confirms the successful doping of nitrogen in the structure of the graphene nanosheets and the TiO2–B lattice. In addition, the TiO2–B nanosheets are substantially bonded to the NG sheets. As a result, the N-TiO2–B/NG exhibits a high specific capacity as well as an excellent rate performance as an anode material in the Li-ion battery. Therefore, the research on the N-TiO2–B/NG composite demonstrates an efficient way to realize the enhancement of the electrochemical performance of the LIB anode materials, thus casting a new light on the development of advanced anode materials for next-generation, high-performance LIBs.Acknowledgements
This work was financially supported by Program for Changjiang Scholars and Innovative Research Team in University (PCSIRT, No. IRT1161) and Program of Science and Technology Innovation Team in Bingtuan (No. 2011CC001) and the National Natural Science Foundation of China (No. 21263021, U1303291).References
- B. Kang and G. Ceder, Nature, 2009, 458, 190 CrossRef CAS PubMed.
- J. B. Goodenough and Y. Kim, Chem. Mater., 2010, 22, 587 CrossRef CAS.
- X. L. Wang, G. Li, M. H. Seo, F. M. Hassan, M. A. Hoque and Z. W. Chen, Adv. Energy Mater., 2015, 5, 1501106 CrossRef.
- Y. X. Tang, Y. Y. Zhang, W. L Li, B. Ma and X. D. Chen, Chem. Soc. Rev., 2015, 44, 5926 RSC.
- L. Hu, H. Zhong, X. Zheng, Y. Huang, P. Zhang and Q. Chen, Sci. Rep., 2012, 2, 986 Search PubMed.
- J. Peng, G. Wang, Y. T. Zuo, G. Li, F. Yu, B. Dai and X. H. Guo, RSC Adv., 2016, 6, 20741 RSC.
- X. Li and C. Wang, J. Mater. Chem. A, 2013, 1, 165 CAS.
- S. B. Yang, X. L. Feng and K. Mullen, Adv. Mater., 2011, 23, 3575 CrossRef CAS PubMed.
- Y. M. Li, Z. G Wang and X. J. Lv, J. Mater. Chem. A, 2014, 1, 15473 Search PubMed.
- J. Wang, N. Yang, H. Tang, Z. Dong, Q. Jin, M. Yang, D. Kisailus, H. Zhao, Z. Tang and D. Wang, Angew. Chem., Int. Ed., 2013, 52, 6417 CrossRef CAS PubMed.
- Y. T Zuo, G. Wang, J. Peng, G. Li, Y. Q. Ma, F. Yu, B. Dai, X. H. Guo and C. P. Wong, J. Mater. Chem. A, 2016, 4, 2453 Search PubMed.
- T. Shen, X. F. Zhou, H. L. Cao, C. Zheng and Z. P. Liu, RSC Adv., 2015, 5, 22449 RSC.
- Y. S. Hu, L. Kienle, Y. G. Guo and J. Maier, Adv. Mater., 2006, 18, 1421 CrossRef CAS.
- Z. Wang and X. W. Lou, Adv. Mater., 2012, 24, 4124 CrossRef CAS PubMed.
- J. Qiu, P. Zhang, M. Ling, S. Li, P. Liu, H. Zhao and S. Zhang, ACS Appl. Mater. Interfaces, 2012, 4, 3636 CAS.
- P. Roy and S. K. Srivastava, J. Mater. Chem. A, 2015, 3, 2454 CAS.
- V. Etacheri, J. E. Yourey and B. M. Bartlett, ACS Nano, 2014, 8, 1491 CrossRef CAS PubMed.
- C. J. Chen, X. L. Hu, Z. H. Wang, X. Q. Xiong, P. Hu, Y. Liu and Y. H. Huang, Carbon, 2014, 69, 302 CrossRef CAS.
- A. S. Arico, P. Bruce, B. Scrosati, J. M. Tarascon and W. van Schalkwijk, Nat. Mater., 2005, 4, 366 CrossRef CAS PubMed.
- X. L. Li, Y. L. Zhang, T. T. Li, Q. N. Zhong, H. Y. Li and J. M. Huang, J. Power Sources, 2014, 268, 372 CrossRef CAS.
- J. Qu, J. E. Cloud, Y. A. Yang, J. N. Ding and N. Y. Yuan, ACS Appl. Mater. Interfaces, 2014, 6, 22199 CAS.
- G. F. Ren, M. N. F. Hoque, J. W. Liu, J. Warzywoda and Z. Y. Fan, Nano Energy, 2016, 21, 162 CrossRef CAS.
- A. Ramadoss and S. J. Kim, Mater. Chem. Phys., 2013, 140, 405 CrossRef CAS.
- Y. Q. Zhang, Q. Fu, Q. L. Xu, X. Yan, R. Y. Zhang, Z. D. Guo, F. Du, Y. J. Wei, D. Zhang and G. Chen, Nanoscale, 2015, 7, 12215 RSC.
- Y. M. Li, Z. G. Wang and X. J. Lv, J. Mater. Chem. A, 2014, 2, 15473 CAS.
- X. Bai, T. Li, Y. X. Qi, Y. X. Wang, L. W. Yin, H. Li, N. Lun and Y. J. Bai, Electrochim. Acta, 2016, 187, 389 CrossRef CAS.
- D. Geng, S. Yang, Y. Zhang, J. Yang, J. Liu, R. Li, T.-K. Sham, X. Sun, S. Ye and S. Knights, Appl. Surf. Sci., 2011, 257, 9193 CrossRef CAS.
- X. Li, H. Wang, J. T. Robinson, H. Sanchez, G. Diankov and H. Dai, J. Am. Chem. Soc., 2009, 131, 15939 CrossRef CAS PubMed.
- Y. Wang, Y. Shao, D. W. Matson, J. Li and Y. Lin, ACS Nano, 2010, 4, 1790 CrossRef CAS PubMed.
- Z. Zhang, Q. Chu and H. Li, J. Colloid Interface Sci., 2013, 409, 38–42 CrossRef CAS PubMed.
- X. Yan, Y. Zhang and K. Zhu, J. Power Sources, 2014, 246, 95–102 CrossRef CAS.
- M. Wagemaker, R. van de Krol, A. P. M. Kentgens, A. A. Van Well and F. M. Mulder, J. Am. Chem. Soc., 2001, 123, 11454 CrossRef CAS PubMed.
- A. R. Armstrong, G. Armstrong, J. Canales and P. G. Bruce, Angew. Chem., 2004, 116, 2336 CrossRef.
- Z. Lin, G. Waller, Y. Liu, M. Liu and C. P. Wong, Adv. Energy Mater., 2012, 2, 884 CrossRef CAS.
- J.-G. Kim, D. Shi, K.-J. Kong, Y.-U. Heo, J. H. Kim, M. R. Jo, Y. C. Lee, Y.-M. Kang and S. X. Dou, ACS Appl. Mater. Interfaces, 2013, 5, 691 CAS.
- Z.-S. Wu, A. Winter, L. Chen, Y. Sun, A. Turchanin, X. Feng and K. Mullen, Adv. Mater., 2012, 24, 5130 CrossRef CAS PubMed.
- Y. Yu, X. Liu, Z. Yang and L. Gu, Chem.–Eur. J., 2016, 5, 233 Search PubMed.
- F. Zheng, Y. Yang and Q. Chen, Nat. Commun., 2014, 5, 5261 CrossRef CAS PubMed.
- A. G. Dylla, G. Henkelman and K. J. Stevenson, Acc. Chem. Res., 2013, 46, 1104 CrossRef CAS PubMed.
- B. Erdem, R. A. Hunsicker, G. W. Simmons, E. D. Sudol, V. L. Dimonie and M. S. El-Aasser, Langmuir, 2001, 17, 2664 CrossRef CAS.
- J. Hou, R. Wu, P. Zhao, A. Chang, G. Ji, B. Gao and Q. Zhao, Mater. Lett., 2013, 100, 173 CrossRef CAS.
- H. Sohn, D. Kim, J. Lee and S. Yoon, RSC Adv., 2016, 6, 39484–39491 RSC.
Footnotes |
| † CCDC 217777 and 218383. For crystallographic data in CIF or other electronic format see DOI: 10.1039/c6ra26929j |
| ‡ These authors contributed equally to this work. |
| This journal is © The Royal Society of Chemistry 2017 |