 Open Access Article
Creative Commons Attribution 3.0 Unported Licence
Reductive removal of gaseous nitrous oxide by activated carbon with metal oxide catalysts
Hong Mengb,
Linpo Yuanab,
Jiajun Gaoc,
Nannan Renb,
Yingzhou Lub and
Chunxi Li *ab
*ab
aState Key Laboratory of Chemical Resource Engineering, Beijing University of Chemical Technology, Beijing 100029, P. R. China. E-mail: licx@mail.buct.edu.cn; Fax: +86 10 64410308; Tel: +86 10 64410308
bCollege of Chemical Engineering, Beijing University of Chemical Technology, Beijing 100029, P. R. China
cSchool of Chemical Engineering and Pharmacy, Wuhan Institute of Technology, Wuhan 430205, P. R. China
First published on 7th February 2017
Abstract
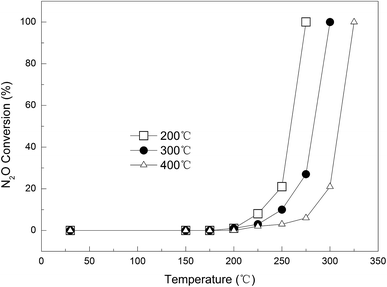
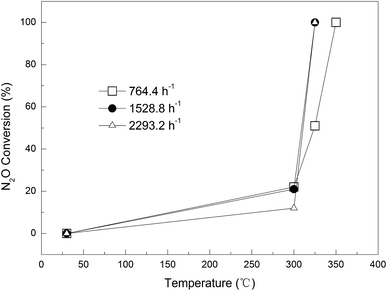
The efficient reductive decomposition of gaseous nitrous oxide (N2O) from industrial effluents is of practical importance in abating greenhouse gas emissions. In the present study, active carbon (AC) has been chosen as both a reductive agent and a catalyst support. Dozens of AC-based catalysts with different kinds and amounts of metal oxide have been prepared under various conditions and characterized. The performances of Cu-containing AC have been studied at varying gas flow rates, Cu contents, and calcination temperatures. N2O in a gas mixture (42% N2O, 58% N2) was found to be completely removed by Cu-loaded AC (9 wt% Cu, calcined at 400 °C) at 325 °C with a GHSV of 2293 h−1. This process is viable by virtue of the low cost of AC and easier manipulation and process control in comparison with alternative methods employing reductive gases such as hydrogen and ammonia.
1. Introduction
Nitrous oxide (N2O) is a greenhouse gas with a global warming potential value of about 310. As a by-product of the manufacture of several chemical products, such as adipic acid and nitric acid, its atmospheric concentration has increased significantly over the last decades, and continues to increase by 0.2–0.3% per year.1 This inexorable trend has attracted a great deal of attention for the development of an efficient method for the removal of N2O from industrial exhausts, especially for the tail gas of the adipic acid production process using HNO3 as oxidizing agent, where the N2O content is as high as 38% along with N2 48.1%, O2 4.4%, CO2 9.5%, and NO 0.03% (in wt%).2A direct decomposition process is generally used for gas effluents with low N2O concentrations,3 which operates at high temperatures (>500 °C) with various catalysts, e.g., hydrotalcite-like materials,4 metal-containing zeolites,5–7 or supported metal oxides,8–11 e.g. CaO–Co3O4,12 and NiLaOx.13 The decomposition of N2O is composed of three steps, viz., adsorption, cleavage of the N–O bond, and desorption of O2, of which the desorption of O2 is considered as the rate-limiting step. To promote O2 desorption, some reductive substances, e.g., CH4, NH3,14 H2,15 and CO,16 have been used to instantly consume the in situ generated O2. However, these reductive gases are expensive and/or explosive, and their flow rate needs dynamic control according to the composition of the gas stream, which complicates the process. Activated carbon (AC), as an inexpensive and active solid reducing agent, can overcome these drawbacks, and is thus worthy of study for the reductive removal of N2O. In fact, coal char is effective in reducing N2O and NO to N2 at combustion temperature,17 and AC loaded with alkali metal oxides shows better performance. Both Na and K can catalyze the reaction between carbon and N2O, and K is better than Na.18,19 The reaction between N2O and C may also be catalyzed by Ni and Pt, and further promoted by K, as reported by Gonçalves et al.20,21
To date, little research has been conducted to compare the performances of different metal oxides supported on AC for the removal of N2O under otherwise identical conditions. In this paper we are focused on the treatment of the tail gas of adipic acid production process through catalytic reduction of N2O using AC as a solid reducing agent. For this purpose, we made a comparative study on the catalytic performances of different metal oxides for the reduction of N2O on AC, and CuO is found to be the most efficient one. Based on catalyst characterization, a structure–activity relationship has been elucidated, and a reaction mechanism is proposed.
2. Experimental
2.1 Chemical materials
The AC used was a commercial coconut-shell-derived carbon (Tangshan Hua Neng Technology Carbon Co., Ltd., Tangshan, China). All metal nitrates, i.e. Cu(NO3)2·3H2O, Ce(NO3)3·6H2O, Ni(NO3)2·6H2O, Zn(NO3)2·6H2O, Co(NO3)2·6H2O, Fe(NO3)3·9H2O, and Mn(NO3)2, were of analytical reagent grade (Beijing Chem. Co., Ltd., Beijing, China, purity ≥ 99.0%) and were used as received. All aqueous solutions were prepared with deionized water.2.2 Pre-treatment of AC
The AC was firstly ground into particles of 10–20 mesh, boiled with deionized water for 15 min, and then washed five times with deionized water. The resultant particles were placed in an oven and dried at 110 °C for 24 h.2.3 Preparation of AC-supported metal oxide catalysts
Certain amounts (0.1–11 wt%, mass fraction of metal atom in AC) of metal nitrate were weighed and dissolved in water (300 mL), AC (30 g) was added to each metal nitrate solution, and the mixtures were stirred magnetically for 24 h at room temperature. They were then placed in an oven and dried at 90 °C for 72 h until the water had completely evaporated. The resultant AC was transferred to a muffle furnace and calcined at 200, 300, or 400 °C for 2 h. Hereinafter, the obtained catalysts are designated as xM-AC-T, where M represents the supported metal, x is the mass fraction of metal atoms in the AC, and T is the calcination temperature.2.4 Catalyst characterization
Fourier-transform infrared (FTIR) spectra in the range ν = 4000–400 cm−1 were recorded at room temperature on a Nicolet 6700 spectrometer. Spectra were collected after 32 scans at 4 cm−1 resolution. The spectra were acquired from KBr pellets composed of 1 mg of the samples and 100 mg of KBr dried at 200 °C for 24 h. X-ray diffraction (XRD) patterns of the calcined samples were recorded at room temperature on a D/Max 2500 (VB2+ PC) diffractometer using Cu-Kα radiation, operated at 40 kV and 200 mA. The patterns were recorded over a 2θ range of 10–90° with a 0.02° step size. Simultaneous thermogravimetric analysis (TGA) and derivative thermogravimetric analysis curves were recorded on a TGA/DSC1/1100 SF apparatus at a heating rate of 10 °C min−1 over the range 25–700 °C in air. X-ray photoelectron spectroscopy (XPS) spectra were recorded on an ESCALAB 250 apparatus with a scanning electron spectroscopy for chemical analysis (ESCA) microscope equipped with an Al monochromatic X-ray source (300 W), employing a beam diameter of 2 mm in CAE analyzer mode. All binding energies were referenced to the C 1s peak at 285 eV. The individual components were obtained by curve fitting.2.5 N2O removal experiments
A stainless steel tubular reactor of Φ5 (i.d.) × 650 mm (effective length 200 mm) was used to investigate the activity of metal oxides supported on AC for N2O removal at atmospheric pressure. Catalyst (2.0 g) was loaded into the reactor each time, and the gas mixture (42% N2O, 58% N2) was fed at rates varying from 50 to 150 mL min−1 by means of a V10FA mass flow controller. The reaction temperature was controlled through a proportion integral derivative (PID)-regulated oven. To compare the catalytic performances of different transition metal oxides, the reaction temperature was varied from 300 to 550 °C in steps of 50 °C. To study the effect of the Cu-loading on the performance of the AC-supported Cu catalysts, the reaction temperature was varied from 300 to 550 °C in steps of 25 °C. Furthermore, the reaction temperature was varied from 150 to 325 °C in steps of 25 °C to evaluate the activities of the catalysts calcined at different temperatures. In all of the experiments, temperature was increased at a rate of 5 °C min−1. At any given temperature, the reaction duration was 1 h. The concentration of N2O in the outlet gas was monitored online by means of a TM GC7700 gas chromatograph equipped with a TCD and a Porapak Q (6 m × 3 mm) column.3. Results and discussion
3.1 Characterization of the catalysts
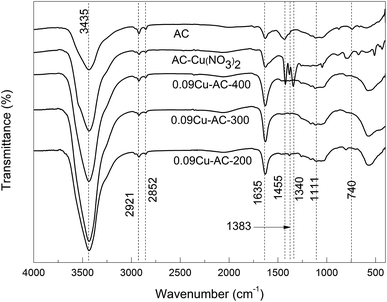
Fig. 2 shows the FTIR spectra of Cu-loaded AC samples calcined at 200, 300, and 400 °C, respectively. It is evident that the loaded Cu(NO3)2 was completely converted to CuO in all of the calcined samples.
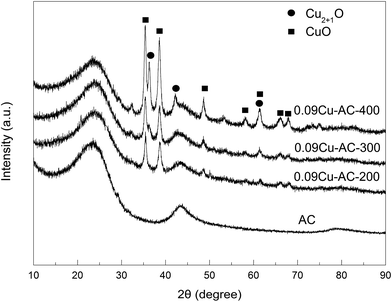
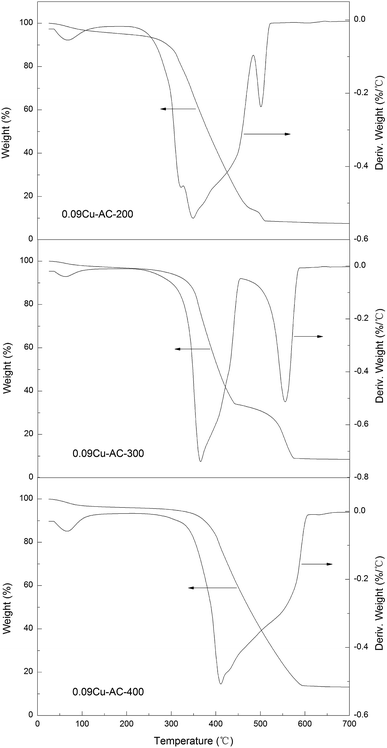
XRD patterns of the Cu-loaded AC samples calcined at 200, 300, and 400 °C are presented in Fig. 4. Several peaks attributable to CuO and Cu2O were observed,32,34 and the intensities of these peaks increased steadily with increasing calcination temperature, implying increasing crystallinity of the copper oxides. Additionally, the content of Cu2O increased with increasing calcination temperature, suggesting that a certain amount of CuO was reduced by AC at 400 °C.
3.2 Comparison of catalytic activities of different metal oxides
The catalytic activities of different metal oxides were evaluated in the tubular reactor using 2 g of each catalyst at a gas flow rate of 100 mL min−1, and the results are shown in Table 1. It can be seen that N2O was not decomposed over the pristine AC below 350 °C, but its decomposition increased significantly with increasing temperature. For example, the conversion of N2O increased drastically from 6% at 400 °C to 100% at 550 °C. Moreover, different metal oxides exhibited different activities for the conversion of N2O. Specifically, 0.01Cu-AC-400 and 0.01Ni-AC-400 completely removed N2O at 400 °C and 450 °C, respectively. The products were exclusively N2 and CO2, as befits the occurrence of the redox reaction between AC and N2O according to eqn (1):| 2N2O + C = 2N2 + CO2 | (1) |
| Pristine/metal-loaded ACs | N2O conversion (%) | |||||
|---|---|---|---|---|---|---|
| 300 °C | 350 °C | 400 °C | 450 °C | 500 °C | 550 °C | |
| AC | 0 | 0 | 6 | 16 | 39 | 100 |
| 0.01Mn-AC-400 | 2 | 3 | 13 | 49 | 100 | — |
| 0.01Fe-AC-400 | 1 | 2 | 17 | 81 | 94 | 100 |
| 0.01Co-AC-400 | 3 | 13 | 35 | 66 | 100 | — |
| 0.01Ni-AC-400 | 3 | 5 | 29 | 100 | — | — |
| 0.01Cu-AC-400 | 4 | 18 | 100 | — | — | — |
| 0.01Zn-AC-400 | 0 | 1 | 5 | 28 | 100 | — |
| 0.01Ce-AC-400 | 3 | 4 | 8 | 30 | 100 | — |
| 0.01CoCe-AC-400 | 4 | 17 | 35 | 61 | 100 | — |
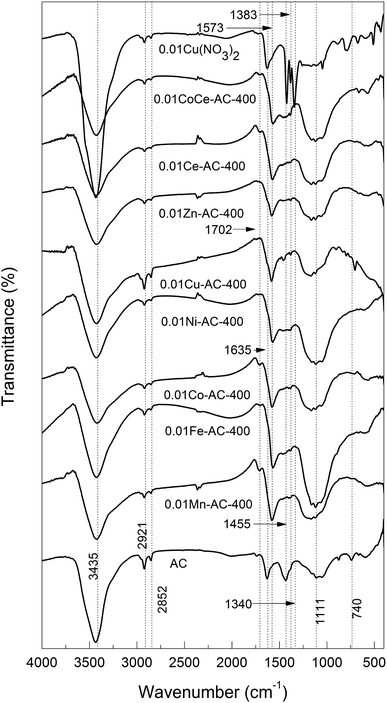
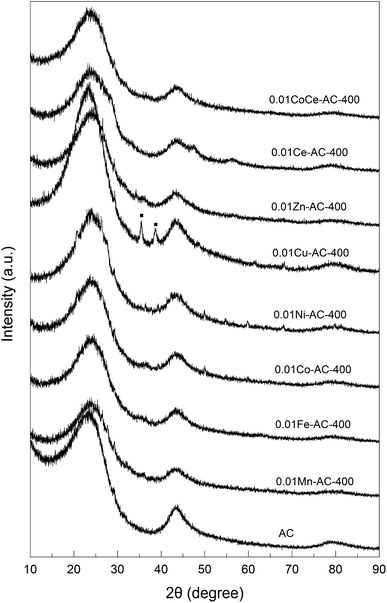
As evidenced by the FTIR and XRD results, the major difference between the catalysts lay in the loaded metal species, while the structure of the AC remained essentially the same. Therefore, the reactivity differences of the catalysts can be mainly attributed to the different activities of the supported metal oxides for the redox reaction of AC and N2O. The catalytic activities decreased in the order Cu > Co > Ni > Fe > Mn > Ce > Zn. This order conforms to that reported by Campa et al. for the reductive removal of N2O with CH4, where the order was Cu > Co > Mn.35 Therefore, 0.01Cu-AC-400 proved to be the most active catalyst for N2O removal among all those studied, and was deemed worthy of further study.
3.3 Reactivity of Cu-based ACs under varying conditions
3.4 Catalytic mechanism
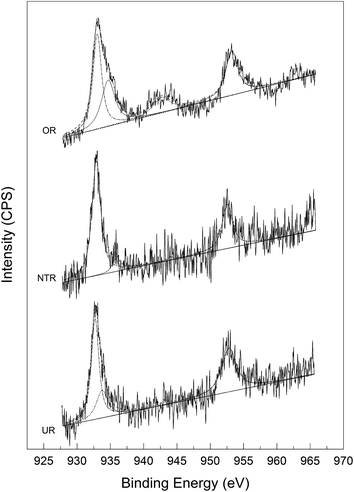
The decomposition process of N2O is believed to involve its redox reaction with carbon under catalysis by the loaded metal oxide, as is manifested by the consumption of AC and the presence of CO2 in the gas effluent. However, this process may be achieved in two different ways, i.e., catalytic decomposition of N2O, forming O2 and in situ oxidation therewith of the carbon support, or reduction of copper oxides by carbon to Cu metal, followed by the in situ oxidation of Cu by N2O. To identify the reaction mechanism, we studied the XPS patterns of three different reagents, namely, the original reactant (OR, 0.03Cu-AC-200), the nitrogen-treated reactant (NTR, obtained by heating OR at 400 °C in N2 for 5 h), and the used reactant (UR, obtained by heating the NTR at 400 °C in N2O for 2 h). Fig. 9 shows the Cu 2p XPS spectra.As can be seen from the XPS spectra, the primary and shoulder peaks appear at binding energies (B.E.) of around 933 and 943 eV, respectively, for Cu 2p3/2. As shown in Table 2, the B.E. values of the primary peaks for NTR and UR were slightly lower than that for OR, implying a lower valence of Cu in NTR and UR. This might be attributed to the reduction of CuO by carbon at a high temperature of 400 °C. All of the samples showed a shake-up satellite peak at around 943 eV, which is characteristic of Cu2+. Meanwhile, the weakened satellite peaks for NTR and UR imply decreased amounts of Cu2+ and increased amounts of Cu+ or Cu0 therein. The intensity ratios of the satellite and primary peaks for Cu 2p3/2 are shown in Table 2. This ratio is about 0.55 for standard CuO and 0 for a Cu0 phase.36 As can be seen in Table 2, NTR showed the lowest valence of Cu, UR showed a slightly higher valence, and OR showed the highest valence.
| Sample | Cu 2p3/2 mpa B.E. | Cu 2p3/2 spb B.E. | Splitting energyc (eV) | Isp/Impd |
|---|---|---|---|---|
| a “mp” denotes the main peak.b “sp” denotes the shake-up satellite peak.c “splitting energy” is the energy difference between mp and sp.d “Isp/Imp” is the intensity ratio of sp and mp. | ||||
| OR | 933.1 | 942.7 | 9.6 | 0.21 |
| NTR | 932.9 | 944.0 | 11.1 | 0.03 |
| UR | 932.7 | 943.3 | 10.6 | 0.04 |
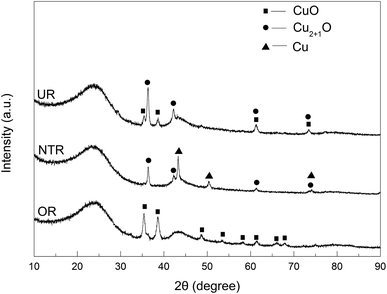
In addition to the XPS results, the above samples were also analyzed by XRD. As is evident from Fig. 10, CuO peaks were only seen for OR; they were no longer seen for NTR due to complete conversion to Cu2O and Cu. Supposedly, at a high temperature of 400 °C under nitrogen, the CuO component in the OR sample was successively reduced by AC to Cu2O and Cu, such that the amount of Cu became dominant. In contrast, only CuO and Cu2O were found in UR, and no elemental Cu could be detected. This may be the net result of the oxidation of Cu by N2O and the reduction of CuO by carbon when NTR was heated to 400 °C in N2O atmosphere. This phenomenon is consistent with earlier investigations by Carabineiro et al.,37,38 and Zhu et al.19
Based on our experimental evidence and above analysis, the catalytic mechanism of CuO for the reductive removal of N2O by AC is assumed to proceed as follows:
| 4CuO + C → 2Cu2O + CO2 | (2) |
| 2Cu2O + C → 4Cu + CO2 | (3) |
| 2Cu + N2O → Cu2O + N2 | (4) |
| Cu2O + N2O → 2CuO + N2 | (5) |
In this process, CuO is involved in transfer of the O atom from N2O to carbon, accelerating the overall redox reaction between N2O and AC. In short, AC in the present process serves as a consumptive solid reductant for reducing N2O to nitrogen, while CuO functions as a catalyst for the reaction between N2O and carbon.
3.5 Applicability and challenge of the present process
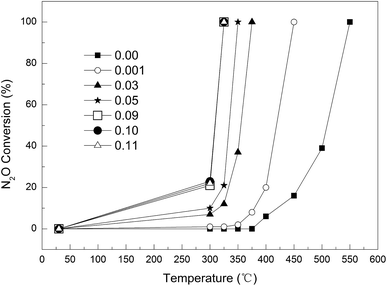
Catalytic reduction of N2O may be achieved at mild conditions by using AC as solid reducing agent and CuO as catalyst. This process is especially suitable for the treatment of tail gas of the adipic acid production process with high concentration of N2O, and is advantageous due to its safety, ease of control, low operating temperature (300–400 °C), and lower cost of AC. And even the industrial waste AC may be also applicable, which further reduces the raw material cost and makes a resource use of another industrial waste. However, some challenges should be considered and tackled properly, e.g. competitive oxidation of O2 with N2O and emission of toxic metal oxide nanoparticles from the exhaust gas. In fact, such competitive oxidation is inevitable in all reductive removal processes of N2O with varying reducing agents, such as H2, CO, and CH4. However, the reactivity of N2O with AC is higher than that of O2, as manifested by its lower reaction temperature on 0.09Cu-AC-400, i.e. 300 °C for N2O (Fig. 6) and about 375 °C for air (O2) (Fig. 5). Therefore, the inhibition effect of O2 for the reduction of N2O may be quite low at appropriate conditions, for example, the presence of O2 was found to have no influence on the N2O-char reactivity at higher temperature.39,40 In contrast, at lower temperature of 320 °C and lower N2O content (0.3% N2O in helium gas), the coexistent 1.5% O2 may lead to a 20% lowering of reactivity of N2O on Cu2O-AC catalyst25 due to the blocking effect of O2 for the active sites of AC.26 As a reducing agent, AC will be oxidized and consumed gradually, and the residue toxic metal oxides may be emitted from the exhaust gas to the atmosphere. However, this problem may be solved through conventional technical approaches. For example, by using a moving-bed reactor, most of the ultrafine metal oxide particles will be retained in the reactor due to the filtering effect of the granular AC catalyst, some of the particles can be collected as sediment in the baffled heat exchanger for cooling the high temperature exhaust gas to ambient temperature, and finally, the ultrafine ashes can be further removed to reach the environmental standard by wet or electrostatic dust collector.4. Conclusions
N2O can be completely decomposed by AC at 550 °C through a redox reaction between AC as reductant and N2O as oxidant. The decomposition reaction is greatly enhanced by some transition metal oxide catalysts, among which CuO has proved to be the best one. Complete removal of N2O was achieved by 0.09Cu-AC-200 at a much lower temperature of 275 °C. The catalytic mechanism of CuO has been studied by XPS and XRD, which would seem to involve the reduction of CuO to Cu2O and Cu by AC, and oxidation of Cu to Cu2O and CuO by N2O. In this process, CuO is involved in transfer of the O atom from N2O to carbon, accelerating the overall redox reaction between N2O and AC.References
- M. A. Zamudio, S. Bensaid, D. Fino and N. Russo, Ind. Eng. Chem. Res., 2011, 50, 2622–2627 CrossRef CAS.
- N. Li, Chem. Ind. Eng. Prog., 2007, 26, 1659–1661 CAS.
- Y. Shen, C. Li, Y. Tang and S. Zhu, RSC Adv., 2015, 5, 13212–13219 RSC.
- S. Kannan, Appl. Clay Sci., 1998, 13, 347–362 CrossRef CAS.
- J. K. Lee, Y. J. Kim, H. J. Lee, S. H. Kim, S. J. Cho, I. S. Nam and S. B. Hong, J. Catal., 2011, 284, 23–33 CrossRef CAS.
- B. M. Abu-Zied, Microporous Mesoporous Mater., 2011, 139, 59–66 CrossRef CAS.
- B. H. Chen, N. Liu, X. Y. Liu, R. D. Zhang, Y. P. Li, Y. X. Li and X. L. Sun, Catal. Today, 2011, 175, 245–255 CrossRef CAS.
- T. P. Gaidey, Russ. J. Appl. Chem., 2009, 82, 1689–1705 CrossRef.
- V. G. Komvokis, M. Marti, A. Delimitis, I. A. Vasalos and K. S. Triantafyllidis, Appl. Catal., B, 2011, 103, 62–71 CrossRef CAS.
- S. S. Kim, S. J. Lee and S. C. Hong, Chem. Eng. J., 2011, 169, 173–179 CrossRef CAS.
- M. Hussain, D. Fino and N. Russo, J. Hazard. Mater., 2012, 211, 255–265 CrossRef PubMed.
- Q. Zhang, X. Tang, P. Ning, Y. Duan, Z. Song and Y. Shi, RSC Adv., 2015, 5, 51263–51270 RSC.
- C. Li, Y. Shen, S. Zhu and S. Shen, RSC Adv., 2014, 4, 29107–29119 RSC.
- T. Xu, C. Wang, X. Wu, B. Zhao, Z. Chen and D. Weng, RSC Adv., 2016, 6, 97004–97011 RSC.
- M. Mihet, V.-M. Cristea, P.-S. Agachi, A.-M. Cormos and M. D. Lazar, RSC Adv., 2016, 6, 89259–89273 RSC.
- P. Nematollahia and M. D. Esrafili, RSC Adv., 2016, 6, 59091–59099 RSC.
- J. Rodriguez-Mirasol, A. C. Ooms, J. R. Pels, F. Kapteijn and J. A. Moulijn, Combust. Flame, 1994, 99, 499–507 CrossRef CAS.
- Z. H. Zhu and G. Q. Lu, J. Catal., 1999, 187, 262–274 CrossRef CAS.
- Z. H. Zhu, G. Q. Lu and R. T. Yang, J. Catal., 2000, 192, 77–87 CrossRef CAS.
- F. Gonçalves and J. L. Figueiredo, Appl. Catal., B, 2004, 50, 271–278 CrossRef.
- F. Gonçalves and J. L. Figueiredo, Appl. Catal., B, 2006, 62, 181–192 CrossRef.
- Y. Chen, Z. Hu, X. Wang, G. Zhao, Y. Liu and W. Liu, Acta Phys.-Chim. Sin., 2008, 249, 1589–1596 Search PubMed.
- J. Sun, H. Wang and B. Sun, Chin. J. Environ. Eng., 2011, 5, 261–266 CAS.
- C. Wang, Y. Liu, X. Zheng, Z. Wen, A. Liu, X. Xu and Z. Hu, Gongneng Cailiao, 2010, 9, 1520–1528 Search PubMed.
- Z. H. Zhu, L. R. Radovic and G. Q. Lu, Carbon, 2000, 38, 451–464 CrossRef CAS.
- Y. H. Li, G. Q. Lu and V. Rudolph, Chem. Eng. Sci., 1998, 53, 1–26 CrossRef CAS.
- S. A. Carabineiro, F. B. Fernandes, A. M. Ramos, J. Vital and I. F. Silva, Catal. Today, 2000, 57, 305–312 CrossRef CAS.
- A. N. Zhou, X. L. Ma and C. S. Song, Appl. Catal., B, 2009, 87, 190–199 CrossRef CAS.
- Y. F. Jia and K. M. Thomas, Langmuir, 2000, 16, 1114–1122 CrossRef CAS.
- B. H. Stuart, Infrared Spectroscopy: Fundamentals and Applications, Wiley, 2004 Search PubMed.
- W. N. R. W. Isahak, M. W. M. Hisham and M. A. Yarmo, J. Chem., 2013, 2013, 1–6 CrossRef.
- J. Co, P. D. Standards, Powder Diffraction File, ASTM, Newtown Square, PA, USA, 2004, pp. 48–1548 Search PubMed.
- L. Chmielarz, M. Rutkowska, P. Kuśtrowski, M. Drozdek, Z. Piwowarska, B. Dudek, R. Dziembaj and M. Michalik, J. Therm. Anal. Calorim., 2011, 105, 161–170 CrossRef CAS.
- J. Co, P. D. Standards, Powder Diffraction File, ASTM, Newtown Square, PA, USA, 2004, pp. 05–0667 Search PubMed.
- M. C. Campa, V. Indovina and D. Pietrogiacomi, Appl. Catal., B, 2012, 111, 90–95 CrossRef.
- A. Patel, P. Shukla, T. Rufford, S. Wang, J. Chen, V. Rudolph and Z. H. Zhu, Appl. Catal., A, 2011, 409, 55–65 CrossRef.
- S. A. Carabineiro, F. B. Fernandes, R. J. C. Silva, J. S. Vital, A. M. Ramos and I. M. Fonseca, Catal. Today, 2008, 133, 441–447 CrossRef.
- S. A. Carabineiro, F. B. Fernandes, J. S. Vital, A. M. Ramos and I. M. Fonseca, Appl. Catal., B, 2005, 59, 181–186 CrossRef CAS.
- I. Gulyurtlu, H. Esparteiro and I. Cabrita, Fuel, 1994, 73, 1098–1102 CrossRef CAS.
- J. Rodriguez-Mirasol, A. C. Ooms, J. R. Pels, F. Kapteijn and J. A. Moulijn, Combust. Flame, 1994, 99, 499–507 CrossRef CAS.
| This journal is © The Royal Society of Chemistry 2017 |

