
 Open Access Article
 This Open Access Article is licensed under a Creative Commons Attribution-Non Commercial 3.0 Unported Licence
Importance of volatile AAEM species to char reactivity during volatile–char interactions
Changshuai Du ,
Li Liu and
Penghua Qiu*
,
Li Liu and
Penghua Qiu*
School of Energy Science and Engineering, Harbin Institute of Technology, Harbin, 150001, P. R. China. E-mail: qiuph@hit.edu.cn
First published on 7th February 2017
Abstract
The volatile alkali and alkaline earth metallic (AAEM) species are an important component of the involved reactants during volatile–char interactions and are beneficial to char reactivity. A fluidized-bed/fixed-bed combination reactor was employed to investigate the effects of volatile AAEM species on the char reactivity at 800 °C. ICP-OES and X-ray Photoelectron Spectroscopy (XPS) were utilized to reveal the evolution of AAEM species and char structures during volatile–char interactions. The results indicate that a large proportion of volatile AAEM species would migrate onto the char substrate, amounting to over 50% of the volatilization amount of AAEM species derived from char during volatile–char interactions. Concentrations of AAEM species accord well with the oxygen atomic concentrations on the char surface. The volatile AAEM species migrated onto the char would bond with the oxygen preferentially, likely to stabilize the oxygen-containing structures. The reactivity of the char reacted with the volatile loading of AAEM species is about two times higher than that reacted with the volatile free-of-AAEM species. It is believed that the volatile AAEM species show a better catalytic activity than the residual AAEM species in original char, possibly due to the more stable bonds between volatile AAEM species and the char matrix, or the better dispersion of volatile AAEM species in char. The conclusions clearly demonstrate that the volatile AAEM species play a significant role in the char reactivity.
1. Introduction
The volatile–char interactions existing in most gasification processes significantly affect many elementary steps of the pyrolysis and gasification including the evolution of the char structure,1–4 the fate of alkali and alkaline earth metallic (AAEM) species,5–8 the reforming of coal tar9–13 and the emission of N/S pollutants.14,15 Therein, the change of char structure and the volatilization of AAEM play dominant roles in altering the char reactivity.16–19 Particularly, the AAEM species could act as an excellent catalyst in gasification and thus enhance char reactivity.20–22AAEM species existing in gasification contain two types, the gas-phase AAEM species accompanied by the volatile release (defined as volatile AAEM species) and the solid-phase AAEM species remained in the char (defined as residual AAEM species). In the actual pyrolysis and gasification, as fuel solids are constantly fed into the gasifier, the char particles will be surrounded by the volatiles that contain many components, i.e. CO2, H2O, tar, radicals, light hydrocarbons and vapour AAEM species etc. As shown in Fig. 1, the adsorption of volatile AAEM species and the release of residual AAEM species may take place simultaneously during volatile–char interactions. Both of the AAEM species sources would affect the char structure and its reactivity. Nevertheless, most previous studies5–7 lay emphasis on investigating the changes and effects of residual AAEM species during the volatile–char interaction, owing to the resultant catalytic activity of residual AAEM species on the char reactions. In this regard, AAEM-free coal samples treated by acid washing are generally utilized to generate volatile free of gas-phase AAEM species to eliminate the influence of volatile AAEM species. Other experiments1,3 involved the volatile–char interactions are conducted under the volatile containing gas-phase AAEM species, but the AAEM species in the resultant char are not separated into two parts, the re-adsorbed volatile AAEM species or the residual solid-phase AAEM species, to obtain the comprehensive understanding about the effects of AAEM species. Little attentions are thus focused on the effect of volatile AAEM species on char reactivity during volatile–char interaction.
 | ||
| Fig. 1 The schematic diagram of the changes of AAEM species during volatile–char interaction. | ||
Adsorption of volatile AAEM species may have two decided advantages in the gasification. One is the reducing of AAEM species content in the product, which is beneficial to the ash-related problems (e.g. slagging and fouling)23,24 or the corrosion of the turbine components.25,26 Another one is the increasing of AAEM species content in the char, which contributes to the promotion of the char reactivity. Therefore, a novel conceptual process could be proposed for taking the advantages of the adsorption of volatile AAEM species by adjusting the occurrence of volatile–char interaction in the gasification. The volatile–char interaction could thus play a positive role on the char reactivity. As stated above, despite the knowledge about AAEM species in pyrolysis and gasification have been extensively acquired, e.g. the volatilization of AAEM species,27–32 the effects of them on the structure and reactivity of char,16,28,33 the understanding of volatile AAEM species is highly desirable and essential for developing this novel conceptual gasification technology.
To date, direct evidence regarding the migration and the adsorption behaviours of volatile AAEM species on char surface has not been effectively investigated and the changes of char structure and reactivity caused by the volatile AAEM species still remain unclear. For the aim to independently elucidate the effects of volatile AAEM species during the volatile–char interaction, we employ a two-stage fluidized-bed/fixed-bed reactor in which the char particles placed in fixed-bed can directly react with the volatiles generated from the feeding fuel in fluidized-bed. The feeding raw coals in fluidized-bed section by acid washing or not endow the produced volatiles without or with AAEM species, respectively, and thus enable the independent determination of the influence of volatile AAEM species in this study.
2. Experimental
2.1 Sample preparation
There are three kinds of coal samples and two kinds of char samples used in the tests, which are raw coal (R-form), acid-washed coal (H-form), demineralized coal (D-form), raw coal char (R-char), and acid-washed coal char (H-char), respectively. All the samples were prepared from Zhundong coal at diameter 106–150 μm. R-form coal and H-form coal were also used to prepare the corresponding chars (R-char and H-char) under certain reaction conditions. The samples were collected in Teflon sample bottles and stored at 4 °C for future use. The properties of the R-form coal samples are given in Table 1.| Ash components analysis | |||||||||
|---|---|---|---|---|---|---|---|---|---|
| SiO2 | Al2O3 | Fe2O3 | CaO | MgO | K2O | Na2O | MnO2 | TiO2 | Othera |
| 35.65 | 11.40 | 14.50 | 18.97 | 4.27 | 1.43 | 2.12 | 0.23 | 4.45 | 6.98 |
The raw coal sample was stirred in 0.1 M HCl solution (1 g![[thin space (1/6-em)]](https://www.rsc.org/images/entities/char_2009.gif) :50 mL) for 24 hours under N2 atmosphere and then washed with deionized water until the neutral pH of the solution. The washed coal sample was dried in an oven at 35 °C for 48 h and collected in a Teflon container in an incubator. The preparation of the demineralized coal (D-form) contained two acid leaching steps. Firstly, the raw coal sample was stirred in 5 M HCl solution (1 g:50 mL) for 24 hours. Then, the filtered sample was stirred in 48% HF solution (1 g:50 mL) for 24 hours. The collection method was similar to the H-form sample preparation.
:50 mL) for 24 hours under N2 atmosphere and then washed with deionized water until the neutral pH of the solution. The washed coal sample was dried in an oven at 35 °C for 48 h and collected in a Teflon container in an incubator. The preparation of the demineralized coal (D-form) contained two acid leaching steps. Firstly, the raw coal sample was stirred in 5 M HCl solution (1 g:50 mL) for 24 hours. Then, the filtered sample was stirred in 48% HF solution (1 g:50 mL) for 24 hours. The collection method was similar to the H-form sample preparation.
Besides the solid samples, volatile matters were used as gaseous reactants. The volatile generated from R-form coal was defined as R-volatile. The volatile generated from D-form coal was defined as D-volatile. The reactions between H-char and volatiles were used as blank test, comparing with the reactions between R-char and volatiles. Interactions between R-char and R-volatile, D-volatile and argon are named as R-C + R-V, R-C + D-V and R-C + F-V, respectively. Interactions between H-char and R-volatile, D-volatile and argon are named as H-C + R-V, H-C + D-V and H-C + F-V, respectively. These codes are used in the follow figures. The demineralized coal was used to produce free-AAEM volatile. The amounts of AAEM species contained in the three samples are shown in Table 2. A trace of potassium element in the Zhundong coal is ignored in this study. The test arrangements in this study are given in Table 3.
| Sample | Alkali and alkaline earth metallic species content | |||
|---|---|---|---|---|
| Na | K | Ca | Mg | |
| R-form | 0.096 | 0.022 | 0.821 | 0.156 |
| H-form | 0.002 | 0.005 | 0.079 | 0.009 |
| D-form | 0.0001 | 0.0003 | 0.003 | 0.0001 |
| Samples | Reacting volatiles | ||
|---|---|---|---|
| R-char | R-volatile (R-C + R-V) | D-volatile (R-C + D-V) | Free-volatile (R-C + F-V) |
| H-char | R-volatile (H-C + R-V) | D-volatile (H-C + D-V) | Free-volatile (H-C + F-V) |
2.2 Preparation of char samples
Char samples, namely R-char and H-char, were prepared from R-form and H-form coal samples at the fast heating rate in a high temperature drop-tube furnace (HDTF). The HDTF is mainly composed of drop-tube reactor, feeding system, gas distribution system, heating furnace, sample collector and gas analyser. The detail information about this experiment setup was presented in elsewhere.34,35 R-form or H-form coal samples were fed into the drop-tube reactor at 12 g h−1 with pure argon as carrying gas (purity 99.999% in volume). The temperature of the reactor was set at 900 °C, and under such condition, the sample particles would be heated at a heating rate of 104 K s−1. The sampling probe was placed at the position where the samples kept reacting around 0.7 s to collect R-char and H-char for subsequent experiments. The same experiment condition ensured that the identical basis has existed for both R-char and H-char. Otherwise, the circumstance inside the HDTF was close to the situation in actual pyrolysis since the primary reactions and secondary reactions of the solid sample took place simultaneously. Therefore, both R-char and H-char samples prepared from this system were reasonable and adapted to be used in the char reaction system.2.3 Char reaction system
A reactor (id. 29 mm) combined fluidized-bed and fixed-bed is used to carry out the volatile–char interaction experiments (Fig. 2). This experimental system is mainly composed of fluidized-bed/fixed-bed reactor, gas distribution system, temperature controlling system and heating system. The main body of the reactor is made of high temperature resistant stainless steel (up to 1200 °C). The top section of the reactor is a fixed bed, and the bottom section is a fluidized bed. Three screen meshes (300 meshes) are installed in the reactor to separate the reaction zones and avoid the escape of solid samples, wherein the bottom mesh is employed to load the fluidized bed materials and distribute the fluidizing agent. These meshes use only once for each experiment. Besides the main body, several tubes (T1, T2, T3 and T4 shown in Fig. 2) are designed to input reaction gas, solid samples and to hold thermocouples for acquiring the temperature in the reaction zone, respectively. There are four calibrated thermocouples installed in the experimental system. Two are for controlling the furnace temperature by adjusting the current input of the electric heater, and the other two are for monitoring the temperatures at both the fluidized-bed reaction zone and the fixed-bed reaction zone, respectively. Besides, an electric heating furnace is used to heat up the reactor and the mass flow controllers (CA200) are employed to monitor the flow rates of reacting gases.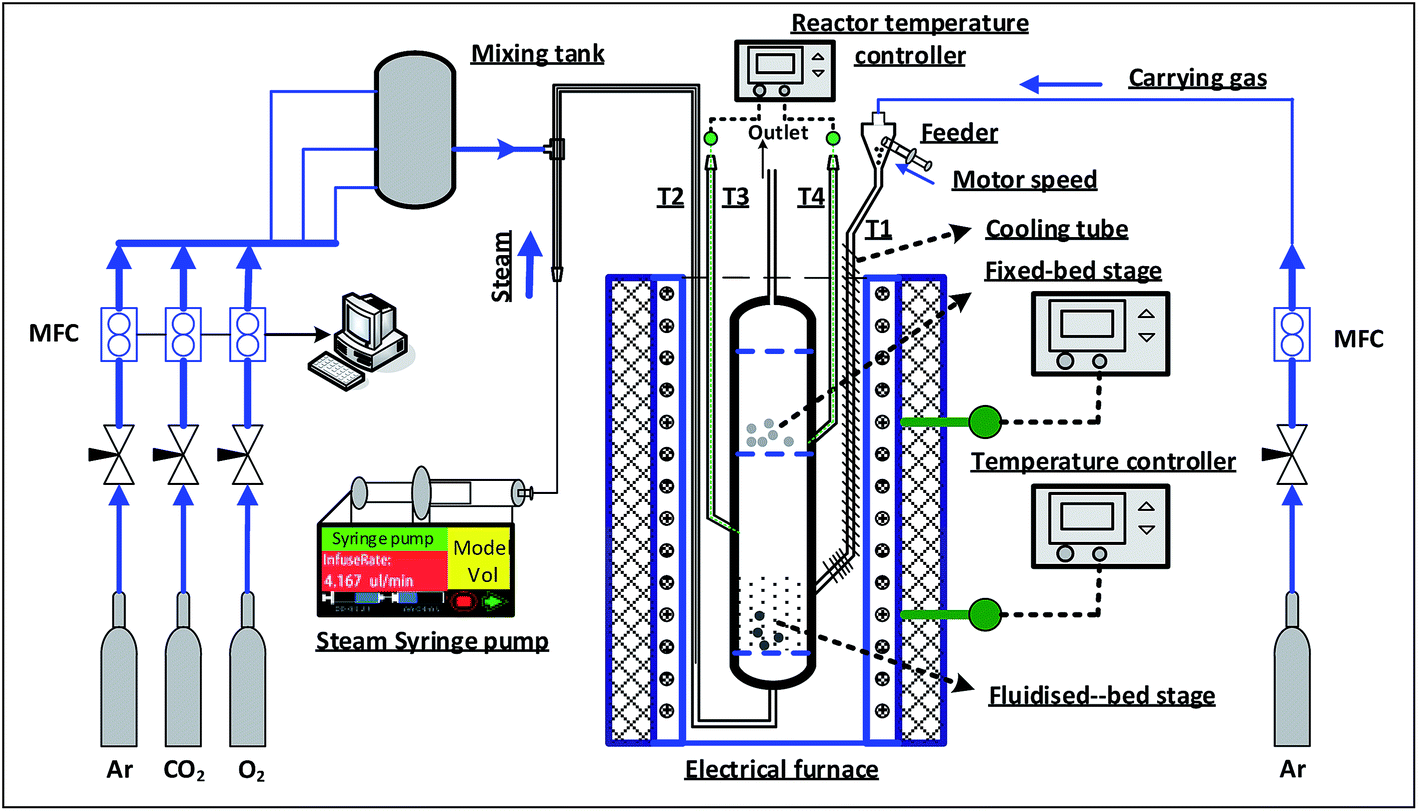 | ||
| Fig. 2 Schematic of the two-stage fluidized-bed/fixed-bed combination reactor. | ||
2.4 Experimental procedure
Before experiments, the reactor was cleaned by two steps to ensure no pollutants affecting the following char reaction. The first step was the purging of the internal surface of the reactor and the feeding tubes by N2 at fast flow after the reactor was disassembled. The second step was the burning of the inter-surface of the reactor, as well as the screen mesh and the quartz sand (loaded in the fluidized bed), which was conducted by putting the reactor into a furnace at 600 °C, and blowing pure oxygen for 30 min at 500 ml min−1 to burn out the impurities inside the reactor. In a general test, the sample char (weighted 200 ± 1 mg) was first loaded into the fixed-bed before the reactor was put into the furnace. Argon was then supplied into the reactor from the bottom tube (T2) for at least 10 min at 1000 ml min−1 to substitute the gases completely which originally existed in the reactor since the gas flow could purging the reactor (V: 240 ml) by over 40 times. The argon flow would not be ceased to supply until the test finished. After the furnace was heated up and the temperature maintained at 800 °C for 10 min, the reactor was put into the furnace. There would be a bit temperature fall in the furnace while the reactor came in, so the test would not start until the temperature inside the reactor increase to 800 °C. Then the feeder started to feed the R-form or D-form samples (80 mg min−1) along with a 400 ml min−1 argon flow into the fluidized-bed zone from the tube T1. The oil cooling system worked simultaneously to decrease the temperature of the feeding tube to 150 °C to inhibit the coal pyrolysis in the feeding tube. The R-volatile and D-volatile produced from the pyrolysis of R-form and D-form samples in the fluidized bed zone, then flowed up onto the fixed-bed zone and reacted with the char samples. While the R-form or D-form samples were fed for 10 min, the test was terminated and the reactor was taken out of the furnace immediately. After the reactor cooled down to room temperature, the char in the fixed bed zone was collected.2.5 Analysis methods and data processing
TGA was employed to measure the reactivity of char samples collected from the reactor. About 5 mg samples were placed in a Pt crucible, and then operated under the settings programmed for TGA. First, the temperature increased to 105 °C under N2 atmosphere and held for 20 minutes to remove the moisture in the samples completely. Then the temperature continued to increase and reached 400 °C at the same atmosphere. After holding for 2 min, the atmosphere was switched to the normal air, and the char reacted with oxygen at the moment. A relatively low temperature is beneficial to minimize the annealing effects on char reactivity.6 Though the condition mentioned above is not similar to the actual reaction conditions, it can also well reflect the char reactivity, which is susceptible to the char characteristics (e.g. AAEM species or structures).1,27 Following the previous studies,16,36,37 it confirms that the effects of heat and mass transfer can be neglect, and the intrinsic reactivity is determined under this method. The specific char reactivity (R) is calculated from the data of TGA at any given time, and describes the changes in the whole conversion, which is reasonable to indicate the char reactivity, using the following equation:
 | (1) |
The contents of AAEM species in the chars were obtained using ICP-OES (Perkin-Elmer Optima 5300 DV). Additionally, XPS (PHI 5400 ESCA System) was used to detect the atomic binding energy and intensity so as to analyse the distribution of elements on the char surfaces and the chemical structures of char.38,39
3. Results and discussion
3.1 Direct evidence and quantification of the migration of volatile AAEM species to the char
| (R-volatile) → R + gas + tar + AAEM(g), | (2) |
| (D-volatile) → R + gas + tar, | (3) |
 | ||
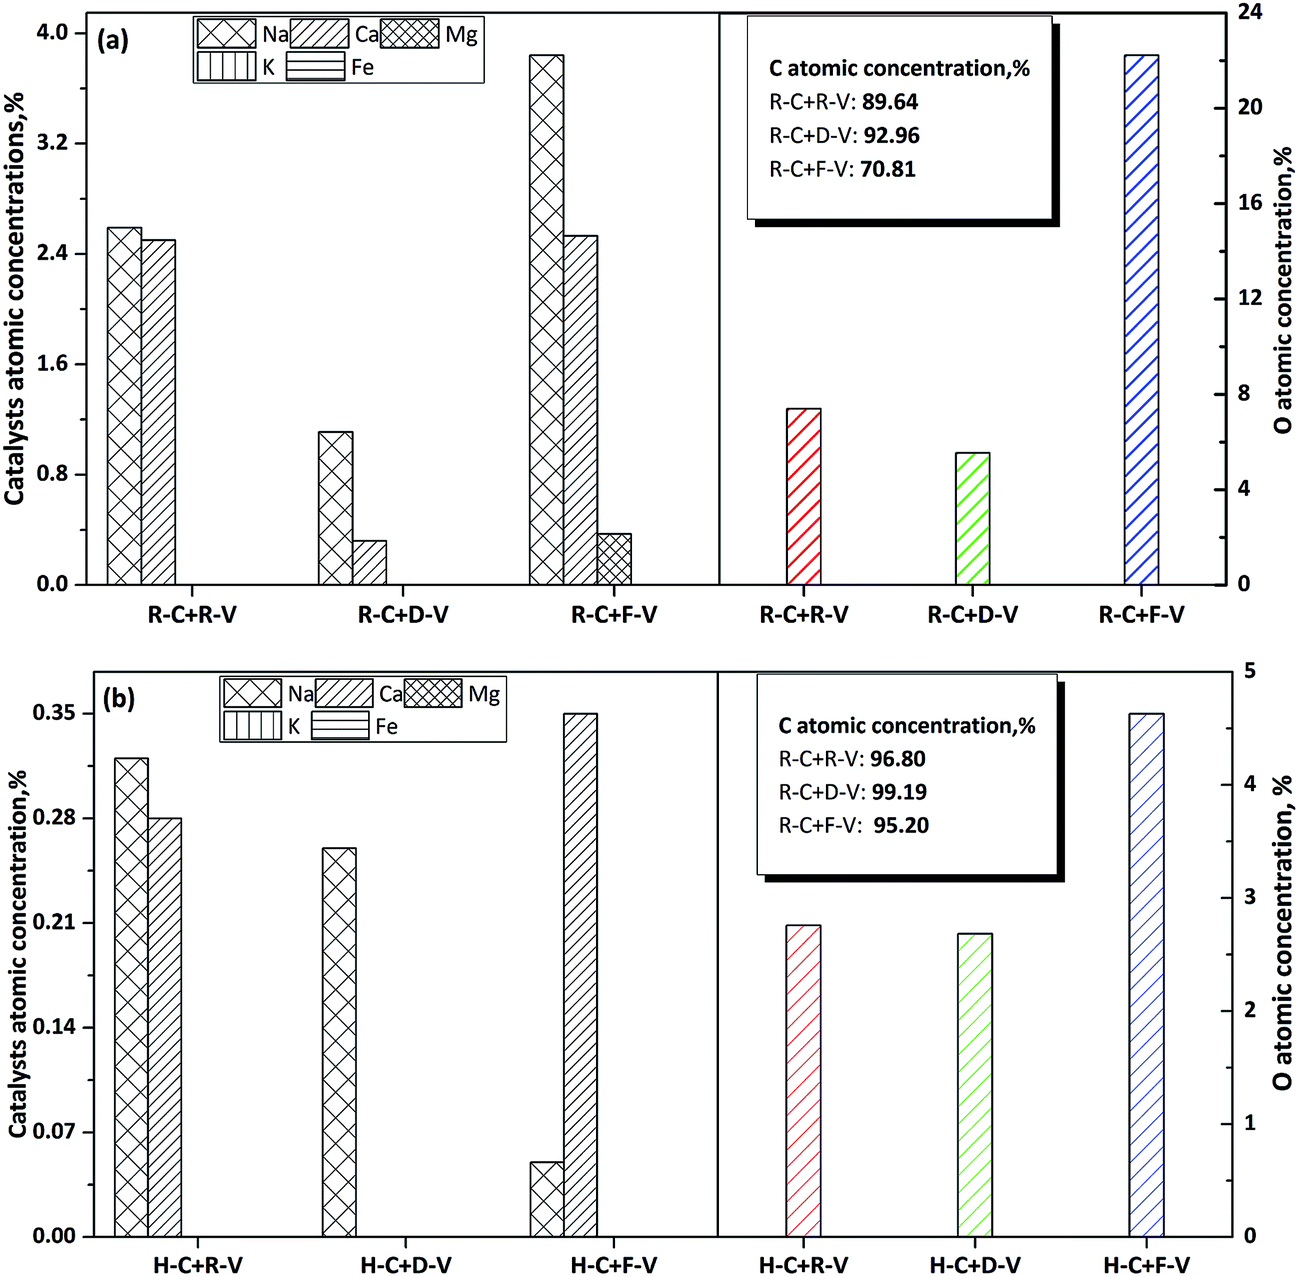
| Fig. 3 Effects of char–volatiles interactions on AAEM species of R-char (a) and H-char (b), R-chars reacted with R-volatile, D-volatile and free-volatile (labelled as R-C + R-V, R-C + D-V and R-C + F-V, respectively), and the labels for H-chars are H-C + R-V, H-C + D-V and R-C + F-V, respectively. | ||
 | ||
| Fig. 4 Mass yields of R-char (a) and H-char (b) under the different conditions, the simple descriptions for the labels as Fig. 3 shows. | ||
The free radicals in volatiles generated from thermal cracking of tars, tar precursors, and light hydrocarbons are very reactive. It is assumed that these radicals will greatly affect volatilization of AAEM species in the char during volatile–char interactions.5–8 Previous studies28,33,40 have shown that the presence of AAEM species in coal can decrease the tar yield during pyrolysis. This can be attributed to AAEM species catalysis of the decomposition of tar precursors, resulting in a higher concentration of free radicals in the volatile. Thus, the R-volatile produced from R-form samples could increase volatilization of AAEM species in the char more than the D-volatile produced from D-form samples. In combination with the earlier quantitative analysis (Fig. 3), this confirms that a large proportion of the volatile AAEM species from the volatile–char interaction of R-char with R-volatile migrate onto the char surface, amounting to >50% of the AAEM species that are volatilized from the R-char in reaction with D-volatile. In the other words, because of migration of the volatile AAEM species, the level of AAEM species in the bulk of the char would decrease by <50% after the volatile–char interaction.
 | ||
| Fig. 5 The dispersion of chemical elements on the surface of R-char (a) and H-char (b), the simple descriptions for the labels as Fig. 3 shows. | ||
The XPS results for chemical elements on the char surface were obtained for an area measuring 0.8 mm × 2 mm, which is much larger than the size of a single char particle. Therefore, the XPS results were obtained from many char particles and used to calculate averaged values, which were representative of the entire char sample. Electrons emitted from the top 1–10 nm of the solid surface were analysed to enable identification and quantification of all surface elements. The surfaces of micropores in the char (e.g. internal surfaces) were difficult to analyse because it is hard for electrons to escape from pores during XPS, which causes measurement losses. Therefore, we focused on measuring the atomic concentrations of Na and Ca on the external surfaces. After reaction with D-volatile, the atomic concentrations of Na and Ca on the external surface of the R-char decreased by 71% and 87% more, respectively, than in the reaction with free-volatile. The reductions observed in atomic concentrations were much greater than the reductions observed for the proportions of AAEM species in the bulk of char, where Na decreased by 28.58% and Ca by 5.63% (Fig. 3). Compared with the reaction with free-volatile, when reacted with R-volatile, the Na atomic concentration decreased by 32.55% more on the external surface of the char, and the Ca atomic concentration showed almost no change. By comparison, the reductions observed for Na and Ca proportions in the bulk of char were about 12.72% and 2.97%, respectively. Considering the dispersion of Na species in the char, the total content of Na species (m0) in the bulk of char that reacts with the free-volatile is given by the sum of the contents of these species on the internal surface (mi) and the external surface (me), as shown in eqn (4). The reduction in Na species for chars reacted with D-volatile and R-volatile compared with char reacted with free-volatile can be expressed as shown in eqn (5) (D-volatile) and 6 (R-volatile). The total reduction for Na species in the bulk of char (i.e. 28.58% m0) is given by the sum of the reduction of Na species on the internal surface (i.e. x% mi) and that on the external surface (i.e. 71% me). Addition of Na species to the char surface from migration of volatile AAEM species after the reaction with R-volatile, compared with addition of Na species for char reacted with D-volatile, is expressed in eqn (7). The total Na content added to the char (15.86% m0) is the sum of the contents of Na species added to the internal ((x% − y%)mi) and external (38.45% me) surfaces.
| m0 = mi + me | (4) |
| (28.58% m0) = (x% mi) + (71% me) | (5) |
| (12.72% m0) = (y% mi) + (32.55% me) | (6) |
| (15.86% m0) = ((x% − y%)mi) + (38.45% me) | (7) |
The x and y percentages represent reductions in the proportions of Na species dispersed on the internal surfaces of chars reacted with D- and R-volatiles, respectively, compared with char reacted with free-volatile. Therefore, (x% − y%) represents the proportion of Na added to the internal surface of the char reacted with the R-volatile, compared with char reacted with the D-volatile. If eqn (4) is combined with eqn (5)–(7), ranges for x%, y% and x% − y% can be calculated at <28.58%, <12.72%, and <15.86%, respectively. The volatile–char interactions primarily take place on the external surface of the char, and the proportions of released AAEM species dispersed on the external surfaces should be higher than those of AAEM species dispersed on the internal surfaces, as shown by x% < 71% compared with y% < 32.55%. This occurs because of diffusion and steric hindrance barriers that reduce access of the volatiles to micropores, which means they do not easily penetrate into the char. The inherent AAEM species, both in dissolved salts and organic structures, disperse well at atomic- and nano-scales in the char matrix. It seemed likely that the rate-limiting step was the diffusion of volatiles within the char matrix. A previous study inferred that radicals will replace AAEM species inside the char matrix during volatile–char interactions.16 In addition, for the migration of volatile AAEM species onto the surface of the char, the proportion of Na species dispersed on the internal surface ((x% − y%) < 15.86%) was much lower than that of Na species dispersed on the external surface (38.45%). This could be attributed to migration of volatile AAEM species onto the surface of the char.
3.2 Changes in the char structure with the migration of volatile AAEM species
| (–CM + CC–X) → (CM–CC–X) | (8) |
| (–CM + CC–X) → (CM–X) + (CC) | (9) |
For both R- and H-char, higher concentrations of O atoms were observed on the char surface for char reacted with free-volatiles than for chars reacted with R- or D-volatiles (Fig. 5). The O atoms were mainly present in O-containing functional groups in the char, and volatile–char interactions seemed to increase the decomposition or transformation of the O-containing structures. The concentration of O atoms on the char surfaces corresponded with the AAEM species concentrations, especially for R-char. This relationship suggests that changes in the AAEM species will alter the effect of the volatile–char interaction on O-containing structures, because the radicals in the volatile will replace the AAEM species on the surface of char. It is likely that the loss of AAEM species from the char surface during volatile–char interactions decreased the stability of O-containing structures. Then, when volatile AAEM species migrated onto the char surface, this stabilized the O-containing structures. Oxygen present in the char seemed to favour retention of AAEM species, and likely served as a link between the AAEM species and the char matrix.41,42 Thus, the AAEM species and the oxygen in the char were likely to form chemical bonds (e.g. AAEM–O), which made the AAEM species and O-containing groups more stable.
Because of the migration of volatile AAEM species to the char surface, a higher proportion of the oxygen present in the char reacted with R-volatiles than reacted with D-volatiles. Volatile AAEM species that migrate onto the char surface will preferentially bond to the char matrix through oxygen in the char, which favours the retention of oxygen in the char. The AAEM species are replaced by free radicals from the gas phase during volatile–char interactions, which will likely break AAEM–O bonds. Therefore, migration of volatile AAEM species will involve cycles of bond-breaking and bond-formation. Earlier studies have suggested that the reformed bonds will be more stable than the original bonds.16,28,33 This means that any volatile AAEM species that have migrated onto the char surface will be harder to release than the original AAEM species in the bulk of the char. Therefore, it is likely that chemical dispersion of volatile AAEM species in the char will induce changes in the catalytic activity and structural features, and this will affect the char reactivity.
![[double bond, length as m-dash]](https://www.rsc.org/images/entities/char_e001.gif) O structures were observed. When the levels of O-containing structures on the char surface were compared for char reacted with R-, D-, and free-volatiles, the volatile–char interaction (e.g. R- and D-volatiles) promoted the transformation or decomposition of C–O and –COO structures. The reduction in the level of structures containing the carboxyl group or carboxylates (–COO) was particularly pronounced, with a decrease of around eight times compared to the free-volatile reaction. Coal can contain carboxyl groups in carboxylic acids and carboxylates, and in the present study, the AAEM species that had carboxyl groups were mainly carboxylates. The volatilization of AAEM species that occurred with the volatile–char interactions weakened the stability of the O-containing groups, and the O-containing structures were prone to decomposition at 800 °C.
O structures were observed. When the levels of O-containing structures on the char surface were compared for char reacted with R-, D-, and free-volatiles, the volatile–char interaction (e.g. R- and D-volatiles) promoted the transformation or decomposition of C–O and –COO structures. The reduction in the level of structures containing the carboxyl group or carboxylates (–COO) was particularly pronounced, with a decrease of around eight times compared to the free-volatile reaction. Coal can contain carboxyl groups in carboxylic acids and carboxylates, and in the present study, the AAEM species that had carboxyl groups were mainly carboxylates. The volatilization of AAEM species that occurred with the volatile–char interactions weakened the stability of the O-containing groups, and the O-containing structures were prone to decomposition at 800 °C.
 | ||
| Fig. 6 Structural features of R-chars reacted with R-volatile (a), D-volatile (b) and free-volatile (c). | ||
 | ||
| Fig. 7 Structural features of H-chars reacted with R-volatile (a), D-volatile (b) and free-volatile (c). | ||
Analysis of the O-containing structures on the surface of H-char (Fig. 7) showed that C–O and COO– groups were present at trace levels. The low levels of O-containing structures could be attributed to the low concentration of AAEM species based on the relationship between AAEM species and O-containing groups. There were fewer O-containing structures present on the surface of H-char after reaction with R-volatile or D-volatile than there were after reaction with free-volatile. Even for H-char reacted with R-volatile, high levels of AAEM species on the char surface did not result in high levels of O-containing structures. Therefore, the level of AAEM species did not appear to be correlated with the level of O-containing structures at very low contents of AAEM species or oxygen in the char.
3.3 Effects of volatile AAEM species on char reactivity
The effects of R-volatile, D-volatile, and free-volatile on char reactivity were investigated (Fig. 8). Comparison of the char reactivities showed that the char samples reacted with R-volatile and D-volatile were less reactive than those that reacted with free-volatile. These results show that volatiles carried by AAEM species and those not carried by AAEM species both decrease the char reactivity. In previous studies, radicals in the gas phase have always been regarded as the main factor affecting reactivity.1,5–7 The changes we observed in AAEM species and char structure (Sections 3.1 and 3.2) were closely related to the char reactivity. Therefore, the effects of volatile AAEM species on the contents of different AAEM species and structural features of the char will be reflected in the char reactivity. | ||
| Fig. 8 Effects of volatile AAEM species on the reactivity of R-char (a) and H-char (b). | ||
For R-char reacted with R- and D-volatiles, the reactivity profiles (Fig. 8a) showed that the reactivity of the char reacted with R-volatile was on average twice that of the char reacted with D-volatile. This difference in reactivity could be caused by differences in the chars' structural features, which can include oxygen-containing, aliphatic, and aromatic groups. When evaluating structural differences between the chars, first we can ignore differences caused by thermal annealing (e.g. thermal decomposition of aliphatic structures and the condensation of aromatic structures) because both char samples underwent similar thermal treatment. Next, when considering oxygen-containing structures, as discussed in Section 3.2, these are affected by the dispersion of AAEM species in the char, especially for the volatile AAEM species. Therefore, the oxygen-containing structures should be taken into account when evaluating the differences in char reactivity. Finally, aromatic structures can greatly affect the char reactivity, and changes in these structures are caused by volatile–char interactions. Radicals in the gas phase can induce condensation of small aromatic rings, and this will decrease the char reactivity. However, the degree of change in an aromatic structure is independent of the level of radicals.1 Therefore, slight differences in the levels of radicals between R-volatile and D-volatile will have little effect on the char structures and the char reactivity. This means that AAEM species and oxygen-containing structures will be the main factors determining char reactivity.
As indicated in Sections 3.1 and 3.2, the proportions of AAEM species in the R-char that reacted with R-volatile because of the migration of volatile AAEM species were higher than the proportions that reacted with D-volatile by 22.21%, 2.82%, and 4.01% for Na, Ca, and Mg, respectively. In the char that reacted with R-volatile, the contents of C–O and COO– structures were higher by 26.7% and 85%, respectively, than the contents of the same structures in char that reacted with D-volatile. AAEM species, which are regarded as excellent catalysts, and O-containing groups, which are regarded as reactive structures, would tend to increase the char reactivity. Therefore, it was not surprising that the reactivity of R-char reacted with R-volatile was twice that of R-char reacted with D-volatile. A comparison of the reactivity profile of these two chars showed that as the rate of conversion and decomposition of O-containing structures increased, the differences between the chars' reactivities also increased. It was very likely that volatile AAEM species in the char were the dominant factor affecting char reactivity at high char conversion levels and low oxygen content.
The reactivity profiles of H-char reacted with R-volatile and D-volatile were also evaluated (Fig. 8b). In this case, only trace levels of AAEM species and O-containing structures were present in the H-char (Fig. 3 and 7). Even without the contribution of O-containing structures to the char reactivity, the reactivity of the char reacted with R-volatile was twice that of char reacted with D-volatile, and this was similar to the reactivity profile of R-char. Therefore, migration of volatile AAEM species to the char surface had an important role in determining the char reactivity. Moreover, the increasing difference between the reactivities of the two chars indicated that the volatile AAEM species had better catalytic activity than residual AAEM species in the original char. This was likely caused by the increased stability of bonds between the volatile AAEM species and char matrix, better dispersion of volatile AAEM species in the char, or an increase in catalytic materials in the char. Studies of the catalytic mechanism of volatile AAEM species for the char reaction are currently underway.
4. Conclusions
The migration of volatile AAEM species was a key step during volatile–char interactions. This study showed that volatile AAEM species are important to char reactivity and appeared to be essential to achieve positive effects on char gasification from volatile–char interactions. The main conclusions were as follows:(1) Higher proportions of AAEM species were present in the bulk and on the surface of the char reacted with R-volatile than with D-volatile because of migration of volatile AAEM species from the R-volatile onto the char. A large proportion of volatile AAEM species migrated to the char surface during volatile–char interactions at 800 °C. In total, >50% of the AAEM species that were volatilized from the R-char in reaction with D-volatile migrated to the char. This increased the dispersion of AAEM species on the external surface of the char compared to dispersion on the internal surface of the char.
(2) The levels of AAEM species were correlated to the atomic concentration of oxygen on the char surface. Volatile AAEM species would bond with oxygen on the surface of char, and this would favour retention of the oxygen and AAEM species in char. Analysis of the oxygen-containing structures on the surface of the char showed that they were mainly C–O and COO– structures, and these structures combined with the volatile AAEM species.
(3) The reactivity of char reacted with R-volatile was on average twice that of char reacted with D-volatile, which showed that volatile AAEM species affected the char reactivity. The volatile AAEM species had better catalytic activity than residual AAEM species in the original char, which could be attributed to more stable bonds between the volatile AAEM species and char matrix or better dispersion of the volatile AAEM species in the char.
Acknowledgements
The authors gratefully acknowledge the financial support received from the National Natural Science Foundation of China (Grant No. 51376053) and the Foundation for Innovative Research Groups of the National Natural Science Foundation of China (Grant No. 51421063).References
- S. Zhang, Z. Min, H.-L. Tay, M. Asadullah and C.-Z. Li, Fuel, 2011, 90, 1529 CrossRef CAS.
- X. Li, J.-I. Hayashi and C.-Z. Li, Fuel, 2006, 85, 1700 CrossRef CAS.
- S. Zhang, J.-I. Hayashi and C.-Z. Li, Fuel, 2011, 90, 1655 CrossRef CAS.
- X. Li and C.-Z. Li, Fuel, 2006, 85, 1518 CrossRef CAS.
- H. Wu, D. Quyn and C.-Z. Li, Fuel, 2002, 81, 1033 CrossRef CAS.
- X. Li, H. Wu, J.-I. Hayashi and C.-Z. Li, Fuel, 2004, 83, 1273 CrossRef CAS.
- H. Wu, X. Li, J.-I. Hayashi, T. Chiba and C.-Z. Li, Fuel, 2005, 85, 1221 CrossRef.
- D. M. Keown, J.-I. Hayashi and C.-Z. Li, Fuel, 2008, 87, 1187 CrossRef CAS.
- T. Matsuhara, S. Hosokai, K. Norinaga, K. Matsuoka, C.-Z. Li and J.-I. Hayashi, Energy Fuels, 2010, 24, 76 CrossRef CAS.
- Z. Min, P. Yimsiri, M. Asadullah, S. Zhang and C.-Z. Li, Fuel, 2011, 90, 2545 CrossRef CAS.
- Y. Song, Y. Wang, X. Hu, J. Xiang, S. Hu and L. Zhang, et al., Fuel, 2014, 122, 60 CrossRef CAS.
- Y. Song, Y. Wang, X. Hu, J. Xiang, S. Hu and D. Mourant, et al., Fuel, 2015, 143, 555 CrossRef CAS.
- L. Zhang, T. Matsuhara, S. Kudo, J.-I. Hayashi and K. Norinaga, Fuel, 2013, 112, 681 CrossRef CAS.
- M. Yao, D. Chu, Y. Liu and Y. Liu, Environ. Sci. Technol., 2008, 42, 4771 CrossRef CAS PubMed.
- Y. Zhang, M. Wang, Z. Qin, Y. Yang, C. Fu, L. Feng and L. Chang, Fuel, 2014, 103, 915 CrossRef.
- C.-Z. Li, Fuel, 2013, 112, 609 CrossRef CAS.
- S. Kajitani, H.-L. Tay, S. Zhang and C.-Z. Li, Fuel, 2013, 103, 7–13 CrossRef CAS.
- B. Bayarsaikhan, N. Sonoyama, S. Hosokai, T. Shimada and J. Hayashi, Fuel, 2006, 85, 340 CrossRef CAS.
- K. Matsuoka, S. Hosokai, Y. Kato, K. Kuramoto, Y. Suzuki, K. Norinaga and J.-I. Hayashi, Fuel Process. Technol., 2013, 116, 308 CrossRef CAS.
- K. Miura, K. Hashimoto and P. L. Silveston, Fuel, 1989, 68, 1461 CrossRef CAS.
- M. Veraa and A. T. Bell, Fuel, 1978, 57, 194 CrossRef CAS.
- K. Mitsuoka, S. Hayshi, H. Amano, K. Kayahara, E. Sasaoaka and M. A. Uddin, Fuel Process. Technol., 2011, 92, 26 CrossRef CAS.
- D. Nutalapati, R. Gupta, B. Moghtaderi and T. F. Wall, Fuel Process. Technol., 2007, 88, 1044 CrossRef CAS.
- J. Capablo, Fuel Process. Technol., 2016, 153, 58 CrossRef CAS.
- Y. Niu, H. Tan and S. Hui, Prog. Energy Combust. Sci., 2016, 52, 1 CrossRef.
- M. Bläsing and M. Müller, Fuel Process. Technol., 2013, 106, 289 CrossRef.
- D. M. Quyn, H. Wu and C.-Z. Li, Fuel, 2002, 81, 143 CrossRef CAS.
- C.-Z. Li, C. Sathe, J. R. Kershaw and Y. Pang, Fuel, 2000, 79, 427 CrossRef CAS.
- T. Okuno, N. Sonoyama, J.-I. Hayashi, C.-Z. Li and C. Sathe, Energy Fuels, 2005, 5, 2164 CrossRef.
- D. M. Quyn, H. Wu, S. P. Bhattacharya and C.-Z. Li, Fuel, 2002, 2, 151 CrossRef.
- L. Jiang, S. Hu, J. Xiang, S. Su, L. Sun, K. Xu and Y. Yao, Bioresour. Technol., 2012, 116, 278 CrossRef PubMed.
- D. M. Quyn, J.-I. Hayashi and C.-Z. Li, Fuel Process. Technol., 2005, 86, 1241 CrossRef CAS.
- C. Sathe, Y. Pang and C.-Z. Li, Energy Fuels, 1999, 13, 748 CrossRef CAS.
- S. Sun, J. Zhang, X. Hu, S. Wu, J. Yang, Y. Wang and Y. Qin, Energy Fuels, 2009, 23, 74 CrossRef CAS.
- J. Zhang, S. Sun, X. Hu, R. Sun and Y. Qin, Energy Fuels, 2009, 23, 2376 CrossRef CAS.
- R. G. Jenkins, S. P. Nandi and P. L. Walker, Fuel, 1973, 52, 288 CrossRef CAS.
- L. R. Radovic, P. L. Walker and R. G. Jenkins, Fuel, 1983, 62, 209 CrossRef CAS.
- W. H. Lee and P. J. Reucroft, Carbon, 1999, 37, 7 CrossRef CAS.
- P. Chingombe, B. Saha and R. J. Wakeman, Carbon, 2005, 43, 3132 CrossRef CAS.
- M. J. Wornat and R. Sakurovs, Fuel, 1996, 75, 867 CrossRef CAS.
- D. M. Keown, G. Favas, J.-I. Hayashi and C.-Z. Li, Bioresour. Technol., 2005, 96, 1570 CrossRef CAS PubMed.
- K. Hashimoto, K. Muira, J. Xu, A. Watanabe and H. Masukami, Fuel, 1986, 65, 489 CrossRef CAS.
| This journal is © The Royal Society of Chemistry 2017 |