DOI:
10.1039/C6RA26941A
(Paper)
RSC Adv., 2017,
7, 5437-5444
Atomic oxygen resistance of polyimide fibers with phosphorus-containing side chains†
Received
17th November 2016
, Accepted 29th December 2016
First published on 17th January 2017
Abstract
A series of polyimide (PI) fibers were spun and exposed to atomic oxygen (AO). The PI fibers contained phosphorus in the macromolecular side chain, which was derived from DATPPO diamine. An AO exposure experiment was conducted in a ground-based AO-effect simulation facility. The changes in the surface morphologies and compositions of PI fibers before and after AO erosion were investigated by field emission scanning electron microscopy and X-ray photoelectron spectrometry (XPS). After AO exposure, the phosphorus-containing PI fibers exhibited a denser surface morphology compared with that of the pure PI fibers. XPS results indicated that phosphate species formed on the surfaces of phosphorus-containing PI fibers after AO exposure protected against further erosion. After AO erosion, the mass loss of phosphorus-containing PI fibers was lower than that of pure PI fibers. Moreover, at an AO fluence of 5.0 × 10²⁰ atoms per cm2, the retention of tensile strength and Young's modulus of phosphorus-containing PI fibers were 64.87% and 66.04%, respectively, which were higher than those of pure PI fibers. The results of the current study are crucial for understanding the relationship between polymer structure and AO-resistant properties of PI fibers to develop new materials with low-earth orbit applications.
Introduction
Aromatic polyimide (PI) fibers belong to a family of high-performance polymeric fibers.1 PI fibers are attractive and desirable spacecraft materials because of their excellent thermal stability,2 good mechanical properties, and outstanding irradiation3 and chemical resistance.4 However, almost all polymeric materials and a few metals are damaged both chemically and physically in the space environment, which presents the hazards5 of high vacuum, high-energy irradiation, thermal cycling, and atomic oxygen (AO). Currently, many satellites, such as observation satellites and space stations, are deployed in low earth orbit (LEO). Although in-orbit6,7 and ground-simulation experiments have yet to confirm the precise dangers of AO,8–10 the dominant chemical constituent in LEO, its destructive potential is substantially increased by high spacecraft speeds. AO is formed when O2 molecular bonds are broken by solar photons at wavelengths below 0.243 μm.11,12 The surfaces facing the direction of travel of the spacecraft are eroded by high AO flux (approximately 1014 to 1015 atoms per cm2 per s) at collision energies of approximately 4.5–5.0 eV. Recent space shuttle flights have demonstrated that interactions between spacecraft surfaces and high-velocity (∼8 km s−1) oxygen atoms within the LEO environment can significantly change the surface properties of many materials, which negatively affect the in-orbital works of a spacecraft.13
PI fibers have many excellent properties for space applications, such as irradiation resistance and flame retardancy. However, PI fibers have a poorly resistant to AO. In recent years, polymers containing phenyl phosphine oxide (PPO) groups have been studied extensively for many applications because of their excellent adhesion to metal substrates and good organic solubility. A notable feature of the PPO group is AO resistance. A series of PPO-containing polymers14 have been designed for durability in the space environment by Connell and co-workers at NASA, Langley Center.15 Short-term space flight exposure experiments6,7,14 showed that polymers containing PPO groups have improved AO resistance. Long-term exposure experiments are in progress.
Studies on the effects of AO exposure on the durability of PI fibers have yet to be reported. Based on our previous work,16 we designed and prepared a series of PI fibers containing PPO groups as pendent substituents, and then exposed fibers to AO beams. This study aims to (1) illustrate the effect of phosphorus content on the AO resistance of phosphorus-containing PI fibers, (2) demonstrate the relationship between the polymer structures and AO-resistant properties of phosphorus-containing PI fibers, and (3) propose a schematic illustration for the mechanism that confers the AO resistance of phosphorus-containing PI fibers.
Experimental section
Materials
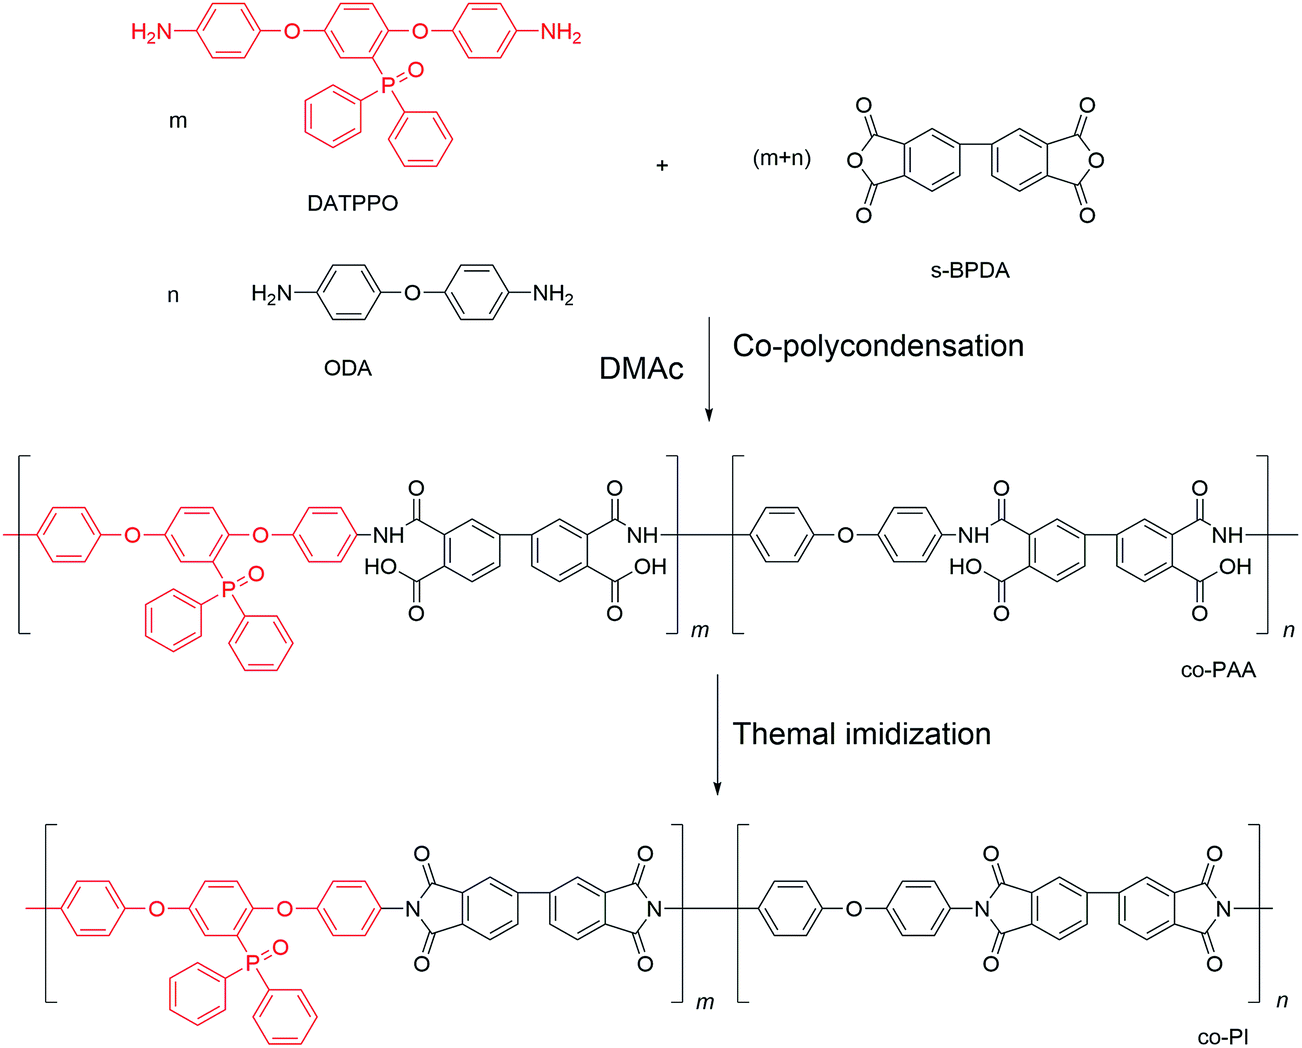
N,N′-Dimethylacetamide (DMAc) was purchased from Tianjin Fine Chemical Co. Ltd. (Tianjin, China) and used as received. 4,4′-Oxydianiline (4,4′-ODA) and 3,3′,4,4′-biphenyltetracarboxylic dianhydride (s-BPDA) were purchased from Shanghai Research Institute of Synthetic Resins. s-BPDA was vacuum-dried at 160 °C overnight prior to use. [2,5-Bis(4-aminophenoxy)phenyl] diphenylphosphine oxide (DATPPO) was synthesized according to our previous work;16 its structure is shown in Scheme 1. All other solvents were used without further purification.
 |
| | Scheme 1 The fabrication flowchart of PI fibers. | |
Fabrication of PI fibers
PPO-containing PAA solutions were synthesized by polycondensation. Briefly, equimolar amounts of two aromatic diamines, ODA and DATPPO, were reacted with s-BPDA (Scheme 1). A mixture containing a 2![[thin space (1/6-em)]](https://www.rsc.org/images/entities/char_2009.gif) :8 (DATPPO:ODA) molar ratio of diamine to dianhydride in DMAc with a solid content of 15% (w/w) was allowed to react at room temperature for 24 h. PAA solutions were degassed prior to being spun into fibers. Other PAA solutions with different diamine molar ratios were treated similarly. A diamine ratio exceeding 6:4 (DATPPO:ODA) resulted in PAA solutions with viscosities too low for fiber formation. Therefore, diamine ratios were set as 0/10, 2/8, 4/6, and 6/4.
:8 (DATPPO:ODA) molar ratio of diamine to dianhydride in DMAc with a solid content of 15% (w/w) was allowed to react at room temperature for 24 h. PAA solutions were degassed prior to being spun into fibers. Other PAA solutions with different diamine molar ratios were treated similarly. A diamine ratio exceeding 6:4 (DATPPO:ODA) resulted in PAA solutions with viscosities too low for fiber formation. Therefore, diamine ratios were set as 0/10, 2/8, 4/6, and 6/4.
The PAA fibers were prepared via a dry-jet wet spinning process, as shown in Fig. 1. The solutions were passed into a coagulation bath through 50-hole spinnerets. Then, the coagulated filaments were passed through a washing bath. The fibers were dried and thermal-imidized followed by collection with a winder. Scheme 1 shows the chemical reaction involved in the fabrication of PI fibers. In addition, Scheme 1 indicates that PAA fibers were converted to PI fibers after thermal cyclization.
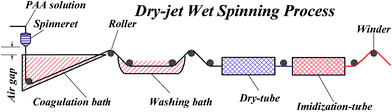 |
| | Fig. 1 Fabrication processing flowchart of PI fibers. | |
AO exposed testing
The AO irradiation experiment was performed in a ground-based AO effects simulation facility, a type of FDPAO (Filament Discharging Plasma-type Atomic Oxygen Simulation Facility) simulation facility (Fig. S1†). Conditions in the vacuum chamber were as follows: working air pressure of 0.13–0.15 Pa, discharge voltage of 118–200 V, and discharge current of 200 mA. Collision ionization and the dissociation of oxygen molecules by electrons formed oxygen plasma. The main components of plasma are O2, O2+, O, O+, and electrons. Table 1 presents the AO exposure testing conditions.
Table 1 AO exposure testing conditions
| Medial AO flux, atoms per cm2 per s |
Hours, (h) |
Total fluence, (atoms per cm2) |
| AO fluence, atoms per cm2 |
5 |
8.3 × 10¹⁹ |
| 10 |
1.4 × 10²⁰ |
| 15 |
2.0 × 10²⁰ |
| 20 |
2.6 × 10²⁰ |
| 25 |
3.4 × 10²⁰ |
| 30 |
5.0 × 10²⁰ |
| Vacuum, Pa |
0.13–0.15 |
PI fibers exceeding 20 cm in length were placed on the sample tray in the vacuum chamber. To calibrate exposure flux, standard Kapton® films were randomly placed around the fibers. All the samples were weighed before and after exposure to different levels of AO fluxes. The AO fluence was calculated from the mass loss of Kapton® by the following formula.
| |
 | (1) |
where
F is the total AO fluence (atoms per cm
2), Δ
M is the mass loss of Kapton® (g),
ρ is the density of Kapton® (1.42 g cm
−3),
A is the exposure area of Kapton®, and
E is the erosion constant of Kapton® (3 × 10
−24 cm
3 per atom).
Measurements
Fourier transform infrared (FTIR) spectra were obtained by a VERTEX 70 spectrometer with 32 scans, a resolution of 2 cm−1, and a KBr background. The surface morphologies of fibers were examined by FESEM (XL30 ESEM FEG). To analyze the elemental components and valence variations of the fiber surfaces before and after AO exposure, X-ray photoelectron spectra (XPS) were recorded by ESCALAB 250Xi with monochromatic Al Kα X-ray source. To eliminate charge effects, the carbon 1s (284.8 eV) peak was taken as a reference from contaminated hydrocarbon. All the peaks were fitted by XPS software (Avantage) incorporated as described in NIST XPS database (http://srdata.nist.gov/xps/Default.aspx). Mechanical properties were measured by an XQ-1 instrument with ASTM standard (D3379-75, edition 1987) at a drawing rate of 20 mm min−1. As shown in Fig. S2,† the single filament fiber was first fixed on a paper holder with glue. The paper holder was then cut along the dotted line. More than 10 monofilaments per sample were tested. The final value of the sample was characterized with the averaged data.
Results and discussion
Preparation of PI fibers
Pure PI fibers were prepared with the commercially available diamines ODA and s-BPDA. All co-PI fibers were prepared with DAMPO, ODA, and s-BPDA via dry-jet wet spinning process and heat drawing process. The chemical structures of the resulting fibers were characterized by FTIR. FTIR results are shown in Fig. 2. All the PI fibers showed four special peaks at 1771, 1712, 1368 and 736 cm−1 that corresponded to asymmetrical C![[double bond, length as m-dash]](https://www.rsc.org/images/entities/char_e001.gif) O stretching of imide groups, symmetrical CO stretching of imide groups, C–N stretching, and CO bending of the imide ring, respectively. In addition, PAA fiber peaks at 1660 cm−1 for amide-I and 1550 cm−1 for amide-II in the spectra disappeared, indicating that PI fibers were successfully prepared. Moreover, the intensities of PO group peaks at 1465 and 1191 cm−1 increased as DATPPO content increased, indicating that different diamine DATPPO concentrations were successfully incorporated into the polymers.
O stretching of imide groups, symmetrical CO stretching of imide groups, C–N stretching, and CO bending of the imide ring, respectively. In addition, PAA fiber peaks at 1660 cm−1 for amide-I and 1550 cm−1 for amide-II in the spectra disappeared, indicating that PI fibers were successfully prepared. Moreover, the intensities of PO group peaks at 1465 and 1191 cm−1 increased as DATPPO content increased, indicating that different diamine DATPPO concentrations were successfully incorporated into the polymers.
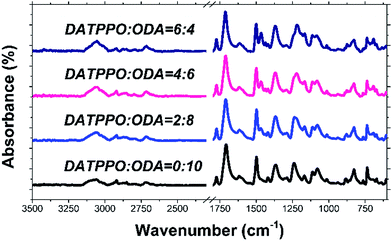 |
| | Fig. 2 FTIR spectra of PI fibers with different DATPPO content. | |
AO exposure results
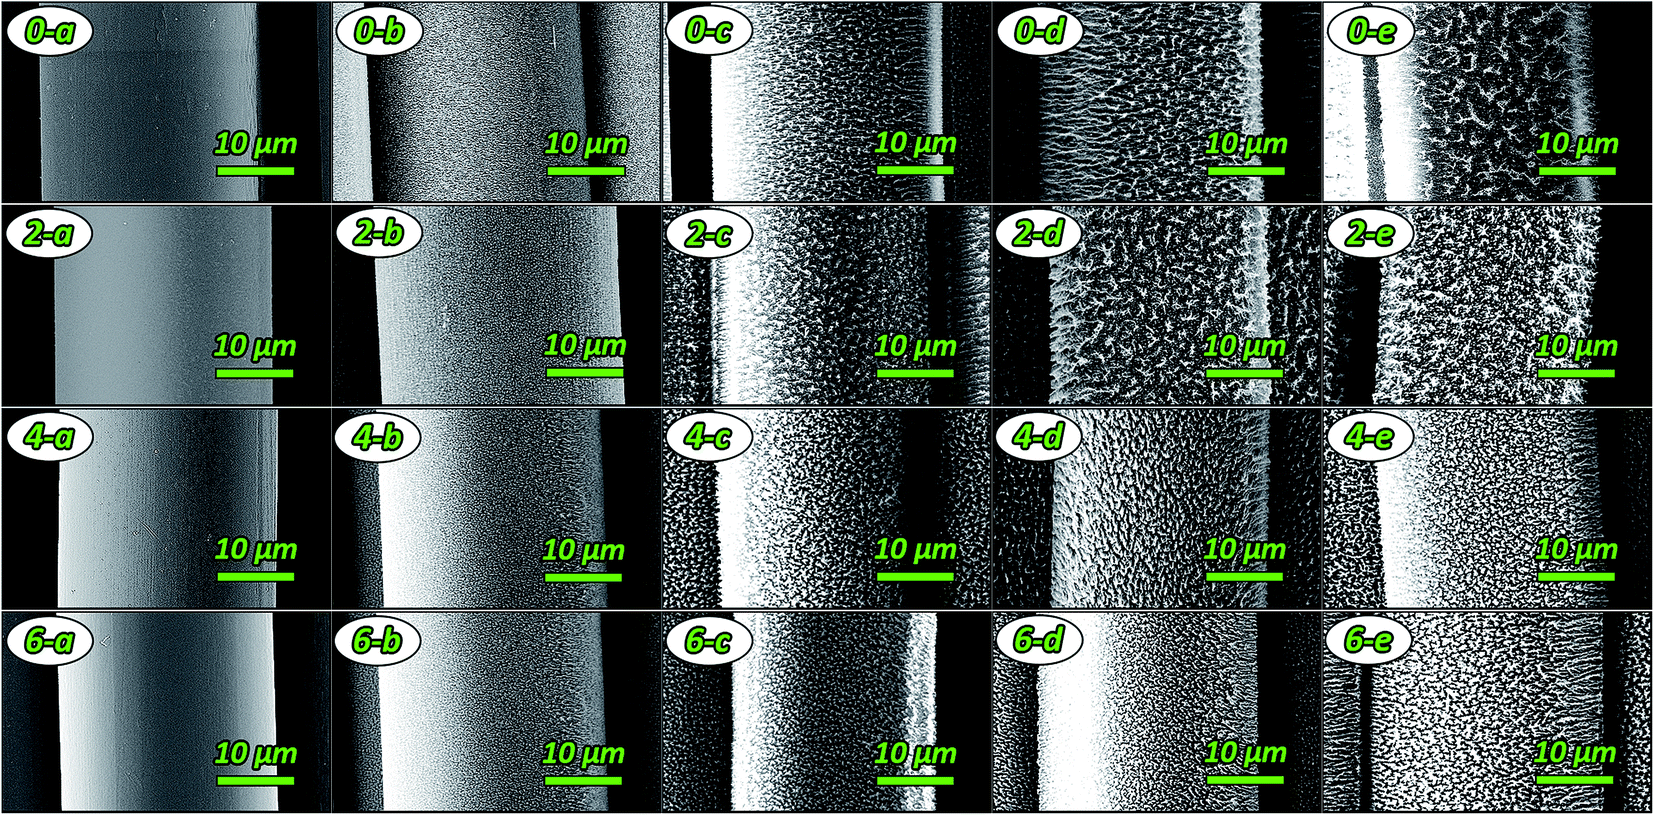
Surface morphologies. Fig. 3 shows that both the pure PI fibers and phosphorus-containing PI fibers had smooth surfaces before AO erosion. Exposure to AO resulted in rough surfaces. The surface roughness increased as AO total fluence increased from 0 to 5.0 × 10²⁰ atoms per cm2. Under low AO fluence (i.e. 8.3 × 10¹⁹ atoms per cm2), the surface roughness of all the fibers was not significantly different. However, the surface of the pure PI fibers had a sparse, carpet-like appearance, whereas those of the phosphorus-containing fibers had a dense, carpet-like appearance under higher AO fluence, i.e. 2.6 × 10²⁰ atoms per cm2 and 5.0 × 10²⁰ atoms per cm2. The surface roughness of the fibers improved significantly under the same AO fluence as the phosphorus content of the fibers increased from 0% to 60%. Furthermore, the diameter of the phosphorus-containing PI fibers remained constant before and after AO erosion, unlike that of pure PI fibers, which exhibited decreased diameters. These results indicated that the phosphorus-containing PI fibers are resistant to AO.
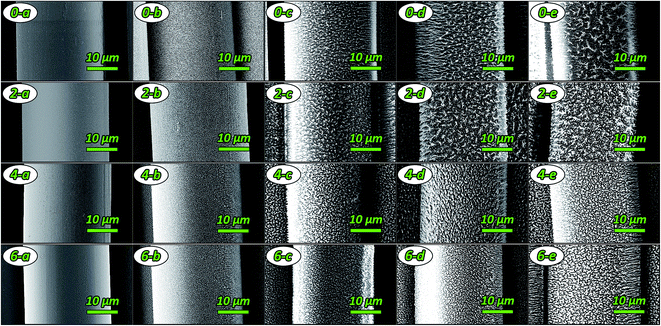 |
| | Fig. 3 The surface morphologies of pure PI fibers and phosphorus-containing PI fibers after exposed to AO beam with fluence at (a) 0, (b) 8.3 × 10¹⁹ atoms per cm2, (c) 2.0 × 10²⁰ atoms per cm2, (d) 2.6 × 10²⁰ atoms per cm2 and (e) 5.0 × 10²⁰ atoms per cm2. | |
Surface element analysis by XPS. The variations in the oxidation states of the fibers' surface chemical compositions before and after AO exposure were investigated by XPS. XPS results are shown in Fig. S3† and Table 2. The O 1s, N 1s, and C 1s peaks were observed in the XPS curves of pure PI fibers and phosphorus-containing PI fibers before AO exposure. After AO exposure, the XPS curve of pure PI fibers did not change, whereas P 2s and P 2p peaks emerged in the XPS curves of phosphorus-containing PI fibers. According to quantitative analysis (Table 2), AO exposure drastically decreased relative carbon concentration and significantly increased oxygen and phosphorus concentrations. Carbon content decreased from 75.49% to 64.67% for PI-0, from 71.92% to 58.63% for PI-2, from 73.90% to 61.61% for PI-4, and from 76.12% to 47.09% for PI-6. Phosphorus content increased from 0.76% to 5.92% for PI-2, from 0.85% to 7.04% for PI-4, and from 1.24% to 10.28% for PI-6. These results indicated that phosphorus-containing matter was deposited on the surface after phosphorus-containing fibers exposing AO. Additionally, carbon elements on the surface of fibers were oxidized by AO and released as volatiles.17–19
Table 2 Results of surface element analysis before and after AO exposure
| Sample element |
Element concentration (atoms%) |
| PI-0 |
PI-2 |
PI-4 |
PI-6 |
| Peaks |
Before AO |
After AO |
Before AO |
After AO |
Before AO |
After AO |
Before AO |
After AO |
| C 1s |
75.49 |
64.67 |
71.92 |
58.63 |
73.90 |
61.61 |
76.12 |
47.09 |
| O 1s |
19.52 |
29.94 |
21.88 |
30.25 |
20.74 |
26.75 |
18.80 |
37.55 |
| N 1s |
4.99 |
5.40 |
5.44 |
5.20 |
4.50 |
4.59 |
3.83 |
5.07 |
| P 2p |
— |
— |
0.76 |
5.92 |
0.85 |
7.04 |
1.24 |
10.28 |
High-resolution XPS spectra of the C (1s), O (1s), N (1s) and P (2p) peaks corresponding to fibers before and after AO exposure were fitted. The results are shown in Fig. S5–S7.† Fig. S4† shows the C 1s spectra of fibers before and after AO exposure. The C 1s spectra were fitted by the C–C species at 284.8 eV binding energies (BEs), the C–N or C–O species at 286.0 eV BEs, and the CO species at 288.3 eV BEs. Duo and co-workers20 reported that the binding energy at 284.8 eV is related to the carbon atoms of benzene rings, the binding energy at 286.0 eV is from C–O–C in ODA or C–N–C in the imide ring, and the binding energy at 288.3 eV is from CO in the imide ring. As listed in Table 3, AO exposure significantly decreased the peak area of all the fibers at 284.8 eV and increased the peak areas at 286.0 and 288.3 eV. Fibers were degraded as the C–C bond in the benzene ring simultaneously formed a C–O bond or a CO bond after AO exposure. In addition, oxygen atoms reacted with carbon atoms to generate CO2.21–23
Table 3 Fitted relative content for C 1s, O 1s, N 1s, P 2p high resolution
| Element peaks |
Before AO exposure |
After AO exposure |
| B. E. (eV) |
Assignments |
Area (%) |
B. E. (eV) |
Assignments |
Area (%) |
| PI-0 |
C 1s |
284.8 |
C–C |
81.2 |
284.7 |
C–C |
71.5 |
| 285.9 |
C–N, C–O |
8.1 |
286.0 |
C–N, C–O |
15.5 |
| 288.3 |
CO |
10.7 |
288.3 |
CO |
13 |
| O 1s |
531.5 |
OC |
83.0 |
531.4 |
OC |
50.1 |
| 533.1 |
O–C |
17.0 |
532.7 |
O–C |
49.9 |
| N 1s |
400.15 |
N–C |
100 |
400.12 |
N–C |
100 |
| PI-2 |
C 1s |
284.7 |
C–C |
82.4 |
284.8 |
C–C |
72.8 |
| 285.8 |
C–N, C–O |
8.6 |
286.1 |
C–N, C–O |
15.5 |
| 288.3 |
CO |
9.0 |
288.5 |
CO |
10.5 |
| O 1s |
531.1 |
OP |
32.1 |
531.3 |
OP |
24.6 |
| 531.6 |
OC |
45.7 |
531.6 |
OC |
24.6 |
| 532.8 |
O–C |
22.2 |
532.9 |
O–C |
50.8 |
| N 1s |
400.1 |
N–C |
100 |
400.3 |
N–C |
89.1 |
| — |
— |
— |
402.2 |
–N |
10.9 |
| P 2p |
132.1 |
P–(C6H5) |
64.3 |
— |
— |
— |
| 133.3 |
OP |
35.7 |
134.2 |
OP |
100 |
| PI-4 |
C 1s |
284.7 |
C–C |
81.8 |
284.8 |
C–C |
73.5 |
| 285.9 |
C–N, C–O |
11.9 |
286.1 |
C–N, C–O |
18.1 |
| 288.4 |
CO |
6.3 |
288.4 |
CO |
8.4 |
| O 1s |
531.0 |
OP |
27.9 |
531.3 |
OP |
13.9 |
| 531.7 |
OC |
48.8 |
531.8 |
OC |
32.3 |
| 533.0 |
O–C |
23.3 |
532.9 |
O–C |
53.8 |
| N 1s |
400.1 |
N–C |
100 |
400.2 |
N–C |
70.5 |
| — |
— |
— |
402.1 |
–N |
29.5 |
| P 2p |
132.1 |
P–(C6H5) |
67.3 |
— |
— |
— |
| 133.1 |
OP |
32.7 |
134.2 |
OP |
100 |
| PI-6 |
C 1s |
284.8 |
C–C |
83.4 |
284.7 |
C–C |
72.1 |
| 286.1 |
C–N, C–O |
10.4 |
286.0 |
C–N, C–O |
18.8 |
| 288.5 |
CO |
6.2 |
288.5 |
CO |
9.1 |
| O 1s |
531.1 |
OP |
21.9 |
531.1 |
OP |
8.7 |
| 531.7 |
OC |
40.3 |
531.5 |
OC |
44.3 |
| 532.9 |
O–C |
37.8 |
532.8 |
O–C |
47.0 |
| N 1s |
400.2 |
N–C |
100 |
400.4 |
N–C |
87.5 |
| — |
— |
— |
402.0 |
–N |
12.5 |
| P 2p |
132.0 |
P–(C6H5) |
45.5 |
— |
— |
— |
| 132.9 |
OP |
54.5 |
134.1 |
OP |
100 |
The O 1s spectra were also fitted with three peaks that represented PO species at 531.1 eV, the CO bond at 532.0 eV, and P–O and C–O bonds at 533.0 eV. As shown in Table 3 and Fig. S5,† after AO exposure, the peak area of the pure PI fibers at 532.0 eV decreased from 83% to 50.1%, whereas the peak area at 533.0 eV increased from 17% to 49.9%. Results for the phosphorus-containing PI fibers showed that all the peak areas at 533.0 eV increased after AO exposure, whereas those at 531.1 eV and 532.0 eV decreased. These results illustrated that CO bonds in imide rings and O–C and P–O bonds were simultaneously formed when fibers suffered an AO attack.
The N 1s core-level spectra consisted of two peak components at 400.2 eV and 402.0 eV, which were associated with the species of N–C bond and –N bond, respectively. The peak area of pure PI fibers at 400.2 eV did not change before and after AO attack (Table 3 and Fig. S6†). However, the peak areas of the phosphorus-containing fibers at 400.2 eV decreased significantly, and a new –N bond peak emerged at 402.0 eV after AO exposure. In fact, the peak associated with the –N bond was formed via the oxidation of the imide ring when phosphorus-containing fibers were attacked by AO.
The P 2p spectra was fitted with two peaks at 132.2 eV (P–Ar) and 133.2 eV (PO) (Fig. S7† and Table 3). The peak of the phosphorus-containing PI fibers at 132.2 eV disappeared and the peak areas at 133.2 eV significantly increased after AO attack. These results illustrated that AO erosion destroyed the bond of P–Ar. Therefore, phosphorus existed in the fibers as PO, i.e. phosphates. Consequently, the passivated phosphate layer can effectively prevent surface erosion by AO, resulting in the dense surface morphologies of fibers.
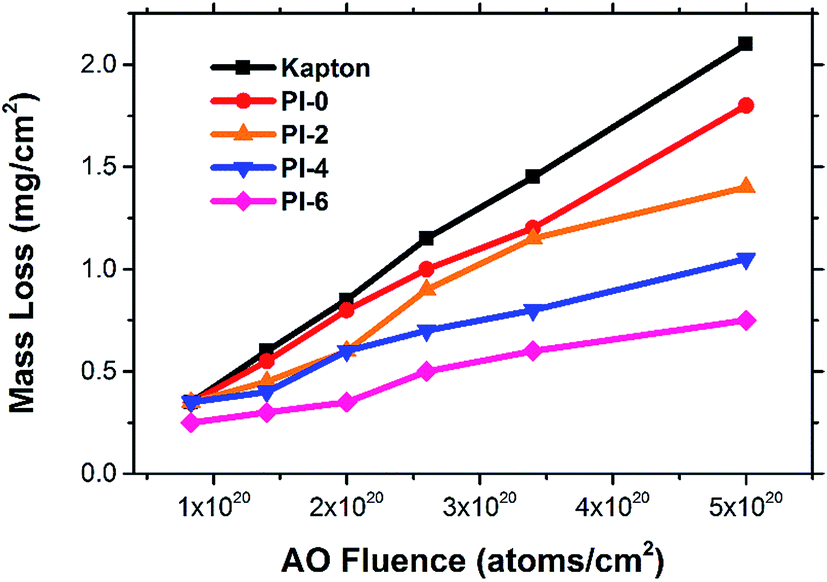
Mass loss. Mass loss was observed when the PI fibers suffered AO erosion. Fig. 4 and Table S1† show that the mass loss of all the PI fibers increased significantly as AO fluence increased. We utilized Kapton® film as a reference for mass loss. Mass loss showed a linear relationship with increased AO fluence. However, both the pure PI fibers and phosphorus-containing PI fibers exhibited nonlinear mass loss in response to AO fluence (Fig. 4). As AO fluence increased from 8.3 × 10¹⁹ to 5.0 × 10²⁰ atoms per cm2, the mass loss of the materials increased from 0.35 to 2.1 mg cm−2 for Kapton® film, from 0.35 to 1.8 mg cm−2 for pure PI fibers, from 0.35 to 1.4 mg cm−2 for PI-2, from 0.35 to 1.05 mg cm−2 for PI-4, and from 0.25 to 0.75 mg cm−2 for PI-6. At lower AO fluence (8.3 × 10¹⁹ atoms per cm2), the mass loss of all the PI fibers, except for PI-6, were the same at 0.35 mg cm−2, whereas the mass loss of PI-6 was 0.25 mg cm−2. Moreover, mass loss increased under higher AO fluence. Mass loss decreased as the phosphorus content of the fibers increased. When the AO fluence was set at 3.4 × 10²⁰ and 5.0 × 10²⁰ atoms per cm2, the mass loss of the fibers decreased from 1.2 to 0.6 mg cm−2 and from 1.80 to 0.75 mg cm−2 as the phosphorus content of the fibers increased from 0% to 60%. These results indicated that the incorporating PPO groups into the polymer backbone and increasing phosphorus content can improve the AO resistance of PI fibers.
 |
| | Fig. 4 Mass loss of PI fibers versus AO fluence. | |
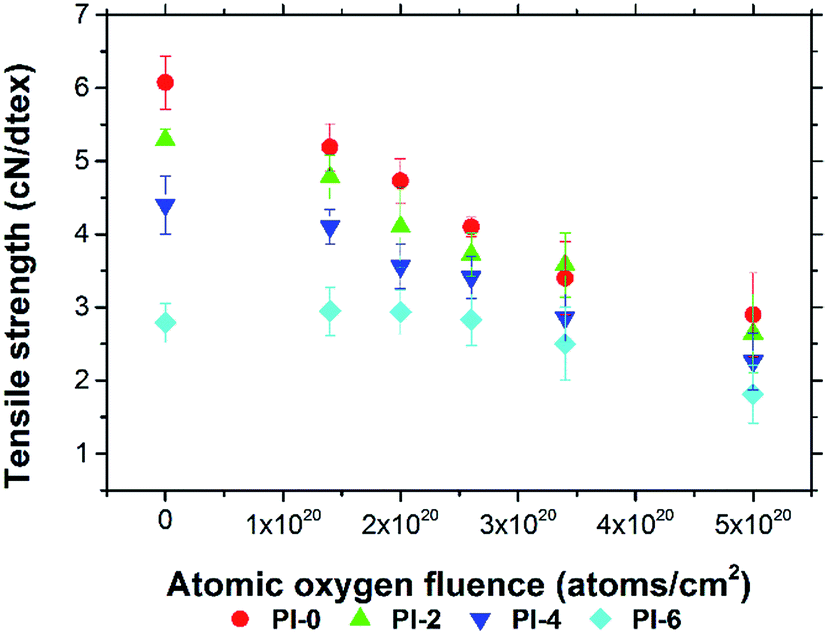
Mechanical properties of fibers. Fig. 5–7 show the changes in tensile strength, Young's modulus, and elongation of the pure PI fibers and phosphorus-containing PI fibers under various levels of AO fluence. The plots show that as AO fluence increased from 0 to 5.0 × 10²⁰ atoms per cm2, the tensile strength of the fibers decreased from 6.07 to 2.90 cN per dtex for PI-0, from 5.29 to 2.64 cN per dtex for PI-2, from 4.40 to 2.26 cN per dtex for PI-4, and from 2.79 to 1.81 cN per dtex. The Young's modulus of the fibers decreased from 98.07 to 58.01 cN per dtex, from 78.49 to 51.26 cN per dtex, from 69.00 to 35.23 cN per dtex, and from 46.67 to 30.82 cN per dtex for PI-0, PI-2, PI-4, and PI-6, respectively. Meanwhile, under the AO fluence of 5.0 × 10²⁰ atoms per cm2, the retention of tensile strength and Young's modulus of the fibers increased from 47.78% to 64.87%, and from 59.15% to 66.04%, as phosphorus content increased from 0% to 60% (Table S2†). However, the elongation of the fibers did not change before and after AO exposure. Before exposure to various AO levels, the elongation values of the fibers were 15.37%, 25.15%, 33.38%, and 36.93%. After AO exposure, the average values of the fibers were 16.39%, 26.45%, 35.67%, and 39.17% for PI-0, PI-2, PI-4, and PI-6, respectively. These results indicated that incorporating phosphorus into PI fibers can improve AO-resistance, and that the retention of tensile strength and Young's modulus of the fibers can increase with increased phosphorus content. Additionally, the tenacity of all the fibers revealed no clear changes before and after AO exposure.
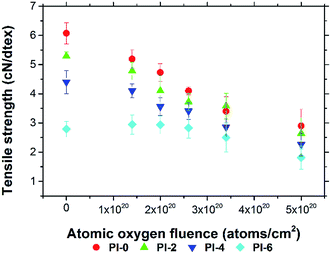 |
| | Fig. 5 Tensile strength of fibers versus AO fluence. | |
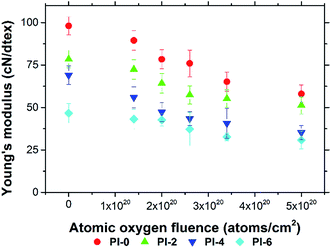 |
| | Fig. 6 Young's modulus of fibers versus AO fluence. | |
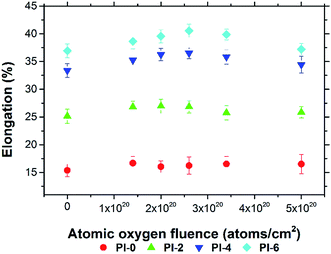 |
| | Fig. 7 Elongation of fibers versus AO fluence. | |
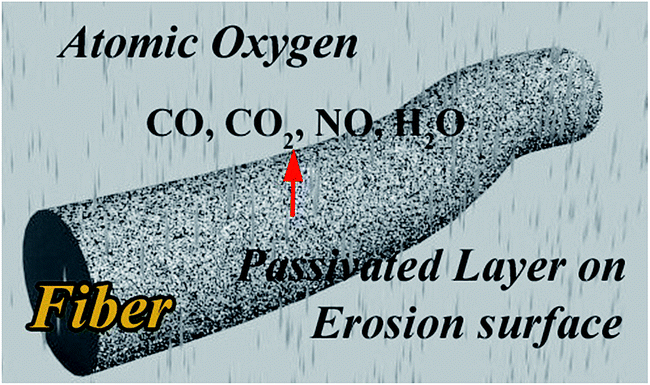
Mechanism of resistant to AO-exposure. Based on the above results, the mass loss of PI fibers decreased with increase of phosphorus content in the same irradiation fluence, when PI fibers exposed AO beams. Fig. 8 shows the proposed mechanism of phosphorus-containing PI fibers resistance to AO. According to the XPS results, the C content decreased, simultaneously, the P and O contents increased dramatically. Moreover, the P 2p peak at 132.2 eV disappeared and the P 2p peak at 133.2 eV increased after AO attack. This is a direct evidence of forming a passivated layer on the surface. The hydrocarbons in the polymers were decomposed by AO, and some volatile products (CO or CO2, NO, and H2O) have been removed from the surface, resulting in mass loss and the rough surface of the fibers. Simultaneously, non-volatile phosphates formed a passivated layer that prevented further AO-induced surface erosion.24–26
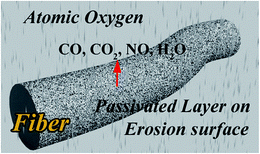 |
| | Fig. 8 Schematic illustration of AO eroding fibers. | |
Conclusions
A series of PI fibers with phosphorus-containing side chains were prepared. The AO-resistant properties of the fibers after exposure to various levels of AO fluences were investigated systematically. After AO exposure, the surface morphologies of the phosphorus-containing PI fibers were denser, carpet-like in appearance compared with those of the pure PI fibers. Fibers with 60% phosphorus content had denser surfaces under higher AO fluences. XPS showed that a passivated layer of phosphates (OP(OR)3) that prevented further AO erosion formed on the surface of phosphorus-containing PI fibers after AO exposure. Mass loss of the fibers occurred after AO exposure. However, as the phosphorus content of PI fibers increased from 0% to 60%, mass loss decreased significantly from 1.80 mg cm−2 to 0.75 mg cm−2 under the highest AO fluence of 5.0 × 10²⁰ atoms per cm2. The mechanical properties of the fibers before and after AO exposure were also investigated. As AO fluence increased, the tensile strength and Young's modulus of the fibers decreased. However, phosphorus-containing PI fibers had lower reductions in measurements. As phosphorus content increased from 0% to 60%, the retention of tensile strength and Young's modulus of the fibers significantly increased from 47.78% to 64.87%, and from 59.15% to 66.04% at the AO fluence of 5.0 × 10²⁰ atoms per cm2. The elongation of the fibers did not change after AO erosion. The results of this study indicate that phosphorus-containing PI fibers have excellent AO-resistant properties, making them crucial materials for use in the LEO environment.
Acknowledgements
This research was supported by National Basic Research Program of China (973 Program, Grant No. 2014CB643604), and Joint Fund for Advanced Aerospace Manufacturing Technology Research, National Natural Science Foundation of China & China Aerospace Science and Technology Corporation (Grant No. U1537213).
References
- K. L. Mittal, Polyimides and other high temperature polymers: synthesis, characterization and applications, CRC Press, 2005 Search PubMed.
- B. Liu, M. Ji, J. Liu, L. Fan and S. Yang, Phenylphosphine oxide containing polyimide matrix resins for atomic oxygen-resistant fiber-reinforced composites, High Perform. Polym., 2013, 25, 907–917 CrossRef.
- Z. Shen, Y. Mu, Y. Ding, Y. Liu and C. Zhao, Study on the mechanical property of polyimide film in space radiation environments, in Selected Proceedings of the Chinese Society for Optical Engineering Conferences held November 2015, International Society for Optics and Photonics, 2015, p. 97960U Search PubMed.
- M. Hasegawa and K. Horie, Photophysics, photochemistry, and optical properties of polyimides, Prog. Polym. Sci., 2001, 26, 259–335 CrossRef CAS.
- M. R. Reddy, Effect of Low-Earth-Orbit Atomic Oxygen on Spacecraft Materials, J. Mater. Sci., 1995, 30, 281–307 CrossRef CAS.
- J. W. Connell, J. J. G. Smith, C. G. Kalil and E. J. Siochi, The effect of low earth orbit atomic oxygen exposure on phenylphosphine oxide-containing poly(arylene ether)s, Polym. Adv. Technol., 1998, 9, 11–19 CrossRef CAS.
- J. W. Connell, The effect of low earth orbit atomic oxygen exposure on phenylphosphine oxide-containing polymers, High Perform. Polym., 2000, 12, 43–52 CrossRef CAS.
- S. L. Koontz, L. J. Leger, J. T. Visentine, D. E. Hunton, J. B. Cross and C. L. Hakes, EOIM-III mass spectrometry and polymer chemistry-STS 46, July-August 1992, J. Spacecr. Rockets, 1995, 32, 483–495 CrossRef CAS.
- F. Awaja, J. B. Moon, M. Gilbert, S. Zhang, C. G. Kim and P. J. Pigram, Surface molecular degradation of selected high performance polymer composites under low earth orbit environmental conditions, Polym. Degrad. Stab., 2011, 96, 1301–1309 CrossRef CAS.
- S. Samwel, Low Earth Orbital Atomic Oxygen Erosion Effect on Spacecraft Materials, Space Research Journal, 2014, 7, 1–13 CrossRef.
- J. A. Dever, in Low earth orbital atomic oxygen and ultraviolet radiation effects on polymers, 1991 Search PubMed.
- S. Packirisamy, D. Schwam and M. H. Litt, Atomic oxygen resistant coatings for low earth orbit space structures, J. Mater. Sci., 1995, 30, 308–320 CrossRef CAS.
- L. J. Leger, J. T. Visentine and J. F. Kuminecz, Low earth orbit atomic oxygen effects on surfaces, in 22nd Aerospace Sciences Meeting, American Institute of Aeronautics and Astronautics, 1984 Search PubMed.
- J. G. Smith, J. W. Connell and P. M. Hergenrother, Oxygen plasma resistant phenylphosphine oxide-containing poly(arylene ether)s, Polymer, 1994, 35, 2834–2839 CrossRef CAS.
- J. G. Smith, C. M. Thompson, K. A. Watson and J. W. Connell, Poly(arylene ether)s containing phenylphosphine oxide groups, High Perform. Polym., 2002, 14, 225–239 CAS.
- G. L. Yong Zhao, F. Liu, X. Dai, Z. Dong and X. Qiu, Synthesis and Properties of Novel Polyimide Fibers Containing Phosphorus Groups in the Side Chain (DATPPO), Chin. J. Polym. Sci., 2016, 35, 1–14 Search PubMed , accepted.
- L. Leger, B. Santosmason, J. Visentine and J. Kuminecz, Review of Low Earth Orbital (LEO) flight experiments, in Proceedings of the NASA Workshop on Atomic Oxygen Effects, United States, 1987, pp. 1–10 Search PubMed.
- M. Edward, in Space Environmental Effects on Spacecraft: LEO Materials Selection Guide, 1995, pp. 1–502 Search PubMed.
- F. Xiao, K. Wang and M. Zhan, Atomic oxygen resistant phosphorus-containing polyimides for LEO environment, J. Mater. Sci., 2012, 47, 4904–4913 CrossRef CAS.
- S. W. Duo, M. S. Li, Y. C. Zhou, J. Y. Tong and G. Sun, Investigation of surface reaction and degradation mechanism of Kapton during atomic oxygen exposure, J. Mater. Sci. Technol., 2003, 19, 535–539 CAS.
- B. Silverman, P. Sanda, P. Ho and A. Rossi, Origin of the carbon 1s-core level
shifts in polyimide model compounds, J. Polym. Sci., Polym. Chem. Ed., 1985, 23, 2857–2863 CrossRef CAS.
- G. Beamson and D. Briggs, The scienta ESCA 300 database, in High Resolution XPS of Organic Polymers, John Wiley & Sons, New York, 1992 Search PubMed.
- E. Grossman, Y. Lifshitz, J. T. Wolan, C. K. Mount and G. B. Hoflund, In Situ Erosion Study of Kapton-laquo; Using Novel Hyperthermal Oxygen Atom Source, J. Spacecr. Rockets, 1999, 36, 75–78 CrossRef CAS.
- R. H. Hansen, J. V. Pascale, T. Debenedi and P. m. Rentzepi, Effect of Atomic Oxygen on Polymers, J. Polym. Sci., Part A: Gen. Pap., 1965, 3, 2205–2214 CrossRef CAS.
- B. Banks, S. Rutledge, J. Brady and J. E. Merrow, NASA/SDIO Space Environmental Effects on Materials Workshop, NASA CP-3035, 1988, pp. 197–239 Search PubMed.
- J. H. Wei, Z. X. Gang, L. Q. Ming, S. urRehman, Z. H. Wei, D. G. Dong and C. C. Hai, Atomic oxygen resistant phosphorus-containing copolyimides derived from bis[4-(3-aminophenoxy)phenyl] phenylphosphine oxide, Polym. Sci., Ser. B, 2014, 56, 788–798 CrossRef CAS.
Footnote |
| † Electronic supplementary information (ESI) available: Mass loss of PI fibers versus AO exposure with difference fluence, retention of tensile strength and Yong's modulus of the fibers after AO exposed at 5.0 × 10²⁰ atoms per cm2, ground-based AO effects simulation facility, (a) vacuum chamber, (b) sample tray, the schematic diagram of tensile testing for PI fiber, XPS survey spectra of fibers with and without AO exposure [a] PI-0, [b] PI-2, [c] PI-4, [d] PI-6, high resolution XPS C 1s, O 1s, N 1s spectra of PI fibers before and after exposed to AO [a] PI-0, [b] PI-2, [c] PI-4, [d] PI-6, and high resolution XPS P 2p spectra of PI fibers before and after exposed to AO [a] PI-2, [b] PI-4, [c] PI-6. See DOI: 10.1039/c6ra26941a |
|
| This journal is © The Royal Society of Chemistry 2017 |
Click here to see how this site uses Cookies. View our privacy policy here. 
 Open Access Article
 This Open Access Article is licensed under a Creative Commons Attribution-Non Commercial 3.0 Unported Licence
 *a
*a