 Open Access Article
Green synthesis, physio-chemical characterization and anti-candidal function of a biocompatible chitosan gold nanocomposite as a promising antifungal therapeutic agent†
S. H. S. Dananjayaa,
R. M. C. Udayangania,
Chulhong Ohb,
Chamilani Nikapitiyacd,
Jehee Leecd and
Mahanama De Zoysa *ad
*ad
aCollege of Veterinary Medicine and Research Institute of Veterinary Medicine, Chungnam National University, Yuseong-gu, Daejeon 34134, Republic of Korea. E-mail: mahanama@cnu.ac.kr; Fax: +82 428218903; Tel: +82 428216795
bJeju International Marine Science Research & Education Center, Korea Institute of Ocean Science & Technology, Jeju Special Self-Governing Province 63349, Republic of Korea
cDepartment of Marine Life Sciences, School of Marine Biomedical Sciences, Jeju National University, Jeju Self-Governing Province 63243, Republic of Korea
dFish Vaccine Research Center, Jeju National University, Jeju Self-Governing Province 63243, Republic of Korea
First published on 30th January 2017
Abstract
A chitosan gold nanocomposite (CAuNC) was green synthesized using chitosan and gold(III) chloride trihydrate without using a reducing agent. The formation and crystalline nature of the gold nanoparticles (AuNPs) in CAuNC were confirmed by UV-visible spectrum and XRD analysis. The average particle size and zeta potential of CAuNC were 308 nm and +37.45 mV, respectively. The CAuNC contains 13.56% (w/w) of Au, and released 8.56 ppb Au ions into potato dextrose broth (PDB). The CAuNC was evaluated for its antifungal activities using Candida albicans as a model organism, and the minimum inhibitory concentration (MIC) and minimum fungicidal concentration (MFC) were recorded as 50 and 75 μg mL−1, respectively. Propidium iodide (PI) uptake and FE-SEM analysis results suggest that CAuNC enhances the permeability and structural changes of C. albicans cells in a concentration dependent manner. Exposure of CAuNC increased the mitochondrial membrane potential, and dysfunctions of mitochondria could induce the reactive oxygen species (ROS) level and increase the oxidative stress. Moreover, the expression of some C. albicans proteins has decreased after CAuNC treatment. The CAuNC was nontoxic to mammalian A549 and HEK293T cells up to 100 μg mL−1 suggesting that it can be applied to in vivo tests. C. albicans infected zebrafish recovered after CAuNC therapy as a topical treatment, suggesting that CAuNC is a potential antifungal agent against candidiasis. This report illustrates the eco-friendly approach of synthesizing biologically active CAuNC as a potent antifungal agent against C. albicans.
1. Introduction
Chitosan is a ubiquitous natural biopolymer, and it has been intensively studied in various industries such as food, pharmaceutical, cosmetic and bioengineering.1–5 Properties of chitosan can be upturned by changing the chemical structure as well as incorporating external nanoparticles (NPs) with its polymer matrix.1 Recently, much attention has been devoted to make hybrid materials of nano-sized metals or metal oxide with chitosan, owing to their unique properties, like photo catalysts5,6 and antimicrobial agents.7 Vast arrays of metal-chitosan composites have been synthesized using copper, silver, platinum and palladium.8 This hybridization could enhance the properties of each single component in composites. The special properties of adopted composites have also been widely investigated. Since, chitosan contains a large number of reactive hydroxyl (–OH) and amino (–NH2) groups, it can act as a natural capping agent during the synthesis of NPs, and is also able to prevent the aggregation of synthesized metal NPs.4,9Chitosan nanocomposites such as chitosan nano hydroxyapatite-fucoidan (in bone tissue engineering) and chitosan gel embedded moxifloxin niosomes (as an antimicrobial hybrid system), are now being widely tested in biomedical fields.10,11 Several authors reported the antimicrobial properties of chitosan nano-silver and chitosan silver oxide composites.12,13 Among various inorganic metal NPs, AuNPs have exhibited specific properties, such as high catalytic efficiency, nontoxicity, chemical stability and easy surface functionalization.14 AuNPs have been extensively used in drug delivery, intracellular gene regulation, bioimaging (as contrast agents), anti-inflammatory and anticancer therapy.15,16 Furthermore, antimicrobial activity of AuNPs has been recently demonstrated against both bacteria and fungi.17 C. albicans is currently considered as the fourth and third-leading causative agent of hospital-acquired bloodstream and urinary tract infections, respectively.18 More importantly, C. albicans causes life-threatening infections in immunocompromised patients who suffer from immune dysfunction.19 Since last century, C. albicans has played an indispensable role in health care-related infections.20,21 Therefore, it is in higher priority to discover nontoxic as well as nonresistant antifungal agents against C. albicans.
Hence, we initiated this study to synthesize the CAuNC using chitosan and gold(III) chloride trihydrate (HAuCl4·3H2O) without adding a reducing agent. The CAuNC was characterized for particle size, zeta potential, UV-Vis absorption, X-ray diffraction (XRD), field emission transmission electron microscopy (FE-TEM), field emission scanning electron microscopy (FE-SEM), inductively coupled plasma-atomic emission spectroscopy (ICP-AES), inductively coupled plasma atomic mass spectrometry (ICP-MS) and thermal gravimetric analysis (TGA). We investigated in vitro and in vivo antifungal efficacy of synthesized CAuNC against pathogenic C. albicans. In order to discover the in vitro antifungal activity of CAuNC, C. albicans was tested under various parameters such as MIC, MFC, cell viability, ROS production, mitochondrial membrane potential and change in cell membrane permeability. In vivo antifungal activity of CAuNC was tested using zebrafish model. Based on available literature, this is the first report of relatively nontoxic chitosan based Au composite with antifungal activity against C. albicans. According to our findings, we conclude that CAuNC has strong anticandidal activity. Therefore, this product will be considered for further investigations as a potential novel antifungal agent against other pathogenic fungi as well.
2. Experimental details
2.1 Synthesis and characterization of CAuNC
Chitosan solution (0.2% w/v) was prepared by dissolving the chitosan flakes having the molecular weight of 375 kDa (Showa, Japan) in 0.01 M acetic acid (Sigma Aldrich, USA) at 65 °C. Then, 4 mL of 10 mM HAuCl4·3H2O (Sigma Aldrich, USA) was added dropwise into the chitosan solution. The mixture was heated at 90 °C for 15 min while stirring. The color of the mixture was changed from colorless to purple, which indicates the formation of AuNPs. The resulting suspension was filtered and washed 3 times using distilled water and, then dried in vacuum oven at 60 °C for 6 h.The optical absorption spectrum of the AuNPs was obtained by UV-Vis spectrometer (Mecasys, Republic of Korea). The morphology and particle size of the AuNPs in the CAuNC were evaluated using FE-TEM (Model Tecnai G2 F30 S-Twin, FEI, USA) operating at 300 keV. The XRD of the chitosan and CAuNC was obtained using powder XRD analysis via Philips PW 1710 diffractometer with Cu Kα radiation (λ = 1.5406 Å) and graphite monochromator, operated at 45 kV; 30 mA and 25 °C. Additionally, FE-SEM coupled with energy dispersive X-ray spectroscopy (FE-SEM, JSM 7000F-EDS, USA) was used to confirm the AuNPs in the composite. The amount of Au in the synthesized CAuNC was determined by ICP-AES (Perkin-Elmer Optima, USA). The thermal stability of CAuNC (4–5 mg) was determined by TGA, which was performed on a Mettler TGA/DSC 1 (Mettler Toledo STARe System, UK) thermal analyzer under nitrogen atmosphere at a heating rate of 5 °C min−1. Particle size distribution and zeta potential of CAuNC were determined by Zetasizer S-90 Malvern instruments (Malvern, UK). ICP-MS analysis was performed to detect the amount of Au ions released from the CAuNC. Briefly, the CAuNC (MIC level concentration) were suspended in the PDB media and incubated overnight at 30 °C for 24 h. Then, the suspension was centrifuged at 18![[thin space (1/6-em)]](https://www.rsc.org/images/entities/char_2009.gif) 000 rpm for 45 min, and 500 μL portion of the supernatant was acidified with 500 μL of ultra-high purity nitric acid. Finally, it was used for elemental analysis by ICP-MS (ICP-MS Agilent 4500, USA).
000 rpm for 45 min, and 500 μL portion of the supernatant was acidified with 500 μL of ultra-high purity nitric acid. Finally, it was used for elemental analysis by ICP-MS (ICP-MS Agilent 4500, USA).
2.2 C. albicans and growth conditions
C. albicans was obtained from the Korean Collection for Type Culture (KCTC 27242). A single colony from fresh potato dextrose agar (PDA) plate was cultured in PDB under aerobic condition at 30 °C for 24 h in a shaking incubator at 180 rpm. The C. albicans cells were centrifuged at 3500 rpm for 10 min to harvest the cells. The harvested cells were washed with phosphate buffered saline (PBS, pH 7.4) followed by re-suspension in PBS (OD600 0.1) to adjust the desired concentration of 106 colony-forming units per milliliter (CFU mL−1), which was calculated using a hemocytometer.2.3 Analysis of in vitro anticandidal activity of CAuNC against C. albicans
In vitro anticandidal activities were assayed to make the growth profile and to determine the MIC and MFC. Briefly, C. albicans cells were inoculated in PDB medium containing different concentrations of CAuNC and 0.25% acetic acid (solvent control). The growth inhibition of C. albicans was studied with the presence of CAuNC (25, 50, 75 and 100 μg mL−1) and nystatin (10 μg mL−1) as a positive control in microtiter plates. Growth level of C. albicans was monitored at different time intervals (0, 1, 2, 3, 4, 5, 6, 7, and 8 h) by measuring the absorbance at 600 nm. After 24 h incubation at 30 °C, the lowest concentration that inhibited the visible growth of the C. albicans was considered as the MIC of CAuNC. The CAuNC treated C. albicans culture samples (100 μL) from the MIC level or above MIC level were plated on PDA plates and incubated for additional 24 h at 30 °C. Minimum concentration which did not possess C. albicans colonies on solid PDA media was considered as the MFC of CAuNC. The number of CFU were calculated according to standard method by counting the colonies on the each plate.2.4 Determination of the viability of C. albicans after CAuNC treatment
Effects of CAuNC on the viability of C. albicans were tested by MTT assay. C. albicans was cultured in PDB for 106 CFU mL−1 and treated with the different concentrations of CAuNC agents (25, 50, 75 and 100 μg mL−1) at 30 °C for 24 h shaking incubator at 180 rpm. Then, culture was centrifuged at 3500 rpm for 10 min and cells were washed with PBS. For the assessment of cell viability, cells were allowed to react with 20 μL of MTT (3-(4,5-dimethyl-2-thiazolyl)-2,5-diphenyl-2H-tetrazolium bromide, Sigma Aldrich, USA) solution for 30 min. Then the samples were resuspended with dimethyl sulfoxide (DMSO, Sigma Aldrich, USA), and cell viability was evaluated by measuring the OD at 570 nm using a microplate reader (Bio-Rad, USA).2.5 Analysis of morphological changes of C. albicans after CAuNC treatment
Samples were prepared to observe the morphological changes of C. albicans upon CAuNC treatment as described by Kumar et al.22 Briefly, FE-SEM analysis was conducted using C. albicans cells (106 CFU mL−1) which were treated with CAuNC (50 and 75 μg mL−1) for 6 h. Treated cells were pelleted, washed using PBS, and pre-fixed with 2.5% glutaraldehyde for 30 min. The pre-fixed cells were again washed by PBS, and serially dehydrated using 30, 50, 70, 80, 90 and 100% ethanol. The fixed cells were dried and coated with platinum using ion sputter (E-1030, Hitachi, Japan). Treated samples were observed by FE-SEM (S-4800, Hitachi, Japan).2.6 Analysis of the effect of CAuNC on membrane permeability of C. albicans
Changes in membrane permeability was investigated by determining the uptake of PI (Sigma Aldrich, USA). PI is a high affinity nuclear stain that penetrates into compromised cell membranes and fluorescence upon binding to nucleic acids.23 Briefly, cell suspensions of the control and CAuNC treated samples (MIC and MFC levels) were centrifuged (5000 rpm for 2 min) and the pellets were resuspended in PBS. The treated cells were incubated with PI (5 μg mL−1) at 30 °C for 15 min in dark. Subsequently, over staining were washed twice with PBS. Finally, one drop of each suspensions was placed on the cover slip and fluorescence images were observed using a Carl Zeiss LSM 5 Live confocal laser scanning microscope (CLSM) scan head integrated with the Axiovert 200 M inverted microscope (Carl Zeiss, Jena, Germany). C. albicans cells were observed through a 40 × 1.3 oil objective. PI was excited with the 543 nm laser line and the emission was recorded through a 585 nm long-pass filter.2.7 Effect of CAuNC on ROS production
Accumulation of ROS was quantified using 2′,7′-dichlorodihydrofluorescein diacetate (H2DCFDA) based flow cytometric analysis (Sigma Aldrich, USA). Briefly, C. albicans culture (106 CFU mL−1 in PDB) with different concentrations of CAuNC (0 to 75 μg mL−1) was kept in a shaking incubator and harvested by centrifugation at 5000 rpm for 2 min. ROS generated cells were stained with H2DCFDA (30 μg mL−1) followed by 30 min incubation at room temperature and harvested by centrifugation at 5000 rpm for 2 min. Cells were washed with ×1 PBS to quantify ROS level by FACSCalibur flow cytometer (Becton Dickinson, USA). In addition, dichloro-fluorescein (DCF) fluorescence was measured using laser scanning confocal microscopy at an excitation wavelength of 488 nm and an emission wavelength of 535 nm.2.8 Effect of CAuNC on mitochondrial membrane potential
The mitochondrial membrane potential was assessed using a fluorescent probe, rhodamine 123 (Rh-123) (Sigma Aldrich, USA) according to the method described by Chen et al.24 Briefly, C. albicans cells at a density of 106 CFU mL−1 in PDB were treated with CAuNC (0, 50 and 75 μg mL−1) for 6 h at 30 °C. After cells were washed and resuspended in PBS, Rh-123 (final concentration, 10 μg mL−1) was added to the cell suspensions in the dark at room temperature for 30 min. The cells were centrifuged at 3500 rpm for 5 min and the pellet was resuspended in 1 mL PBS. The fluorescence of C. albicans cells were measured using laser scanning confocal microscopy (LSM 5 Live, Carl Zeiss, Jena, Germany).2.9 Analysis of CAuNC effect on protein expression by SDS-PAGE
SDS-PAGE was performed to determine the effect of CAuNC on protein expression of C. albicans cells. The culture media with C. albicans cell suspensions (3 × 10⁶ cells per mL) were treated with 50 and 75 μg mL−1 of CAuNC, and incubated for 6 h. Cells were collected by centrifugation (12![[thin space (1/6-em)]](https://www.rsc.org/images/entities/char_2009.gif) 000 rpm at 4 °C for 5 min), and supernatant of each media was discarded. Then, the resulted precipitate was rinsed twice with PBS and resuspended in 1 mL of PBS. Cell samples were sonicated (Sonicsvibra-cell R-VCX750) at 750 W, 20 kHz for 1 min, and centrifuged at 12
000 rpm at 4 °C for 5 min), and supernatant of each media was discarded. Then, the resulted precipitate was rinsed twice with PBS and resuspended in 1 mL of PBS. Cell samples were sonicated (Sonicsvibra-cell R-VCX750) at 750 W, 20 kHz for 1 min, and centrifuged at 12![[thin space (1/6-em)]](https://www.rsc.org/images/entities/char_2009.gif) 000 rpm at 4 °C for 10 min. Protein concentration was quantified using the Nano Drop 2000 (Thermo Scientific, USA), and 12% SDS-PAGE was run according to the method described by Laemmli.25 Finally, band polymorphism was analyzed by Coomassie brilliant blue staining.
000 rpm at 4 °C for 10 min. Protein concentration was quantified using the Nano Drop 2000 (Thermo Scientific, USA), and 12% SDS-PAGE was run according to the method described by Laemmli.25 Finally, band polymorphism was analyzed by Coomassie brilliant blue staining.
2.10 Analysis of CAuNC cytotoxicity on mammalian cells
To determine the cytotoxic level, A549 (human lung adenocarcinoma epithelial, ATCC-185) and HEK293T (human embryonic kidney, ATCC-11268) cells were treated with CAuNC and determined the cell viability. Both types of cells were maintained in high-glucose Dulbecco's modified Eagle's medium (DMEM, Invitrogen, USA) with 1% antibiotic/antimycotic solution (Glibco, USA) and 10% fetal bovine serum (FBS) (Hyclone, USA). Cells were seeded in 96-well flat bottom microtiter plates at a density of 1.5 × 10⁴ cells per well with 100 μL of medium and incubated at 37 °C in 5% CO2 atmosphere. After 12 h of culturing, the medium was aspirated out, and cells were washed with PBS. Each well was treated with different CAuNC concentrations (0–100 μg mL−1), and medium only was used as a control. Ultimately, cell viability was determined after 48 h post treatment using cell counting kit-8 (Dojindo Molecular Technologies, Inc, USA) following the manufacturer's protocol.2.11 In vivo efficacy of CAuNC upon C. albicans infection in zebrafish model
Effectiveness of CAuNC as antifungal agent upon C. albicans infection was tested using the zebrafish model according to the method described previously.26 Briefly, total of 54 zebrafish (average weight: 0.35 g) were divided into three groups (n = 18), consisting each group with 3 replicates. The zebrafish were maintained under standard culturing conditions described previously.27 The fish were anesthetized in system water containing 0.17 g mL−1 of buffered tricaine (Sigma, USA). Control and treatment group fish were injected with 3 μL spores at a dose of 3 × 10⁶ cell per fish by using Hamilton® syringe (10 μL). After the infection, the fish were returned to the recovery tanks immediately, and kept in seperate 4 L tank. After 12 hour post infection (hpi), all the fish in each treatment were anesthetized, and CAuNC (50 μg per fish) was applied at the site of fungal injection, then released back to the aquarium tanks. For the control group PBS (3 μL per fish) was applied. Amphoteracin B (5 μg per fish) was used as positive control. Treatment was carried out in every 12 h, as above until 120 hpi. The cumulative mortality of zebrafish was recorded at 120 hpi. To examine the infection in zebrafish, histological analysis was performed at 72 hpi. For histopathological studies, fish were euthanized using an overdose of tricaine and fixed in 10% neutral buffered formalin for 24 h. The fish were then washed with ×1 PBS for 12 h and transferred to 0.5% EDTA (50 mL per fish) for decalcification for 3 days followed by washing with ×1 PBS for 12 h. Sample processing was done for 12 h (Leica® TP1020 Semi-enclosed Benchtop Tissue Processor, Germany), and after processing the site of infection was separated, embedded in paraffin (Leica® EG1150 Tissue Embedding Center, Germany) sectioned into 4 μm thickness (Leica® RM2125 microtome, Germany). To identify the fungus in the tissue, serial transverse tissue sections were stained with periodic acid-Schiff stain (PAS). The samples were examined using light microscope (Leica® 3000 LED, Germany). The images were captured by LEICA DCF450-C camera.2.12 Statistical analysis
All the data related to the cell viability were illustrated as means ± SD for triplicate reactions. Statistical analysis was performed using unpaired, two-tailed t-test to calculate the P-value using GraphPad program ver. 6 (GraphPad Software, Inc.). The significant difference was defined at P < 0.05.3. Results and discussion
3.1 Synthesis and characterization of CAuNC
The present study was conducted to synthesize CAuNC aiming to develop it as biodegradable and relatively nontoxic antifungal agent against C. albicans. In this synthesis process, we used chitosan as a reducing agent without adding any external chemical reducing source. Therefore, our method could be considered as ‘green synthesis’ approach for producing CAuNC. As suggested by Twu et al., degraded products of chitosan (e.g., glucosamide) may provide electrons to act as a reducing agent.28 The CAuNC was characterized for its physiochemical properties. Initially, formation of CAuNC was confirmed by observing the color change of chitosan–Au solution from colorless to purple (Fig. 1A). UV-Vis spectroscopy analysis was used to confirm the formation AuNPs. UV-Vis spectrophotometry revealed the strong absorption peak at 540 nm (Fig. 1B). Chitosan solution alone did not show any peak in the entire spectral range of 300–700 nm. UV-Vis absorption spectra results showed that characteristic surface plasma resonance (SPR) band in the visible region between 500–600 nm (peak at ∼540 nm). This SPR resulting from the photon confinement to a small particle size, and it enhances all the radiative and non-radiative properties of the NPs.18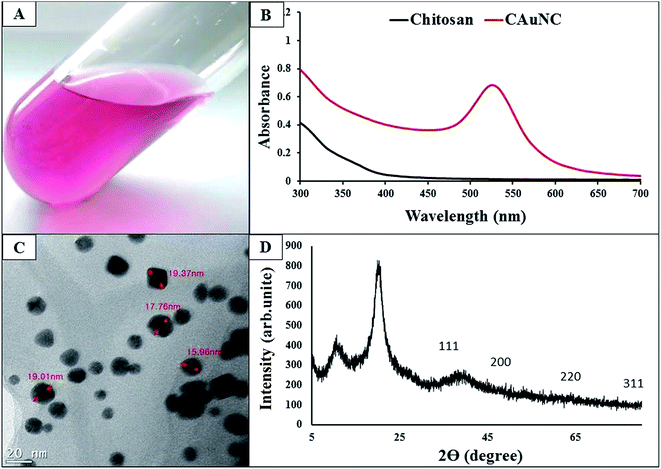 | ||
| Fig. 1 Physio-chemical characteristics of CAuNC. (A) Purple colour CAuNC solution; (B) UV-Vis spectrum of chitosan and CAuNC; (C) FE-TEM image of CAuNC; (D) the XRD profile of the CAuNC. | ||
FE-TEM image of the CAuNC was used to assess the shape, size and the uniformity of the AuNPs. According to Fig. 1C, it was clear that formation of spherical and triangle shaped AuNPs with a diameter ranging from 15–30 nm. Moreover, FE-TEM analysis results confirmed that AuNPs in the CAuNC were highly stable with relatively few aggregates of AuNPs. During the process of AuNPs formation, already synthesized Au nanotriangles behaved as nuclei to make further into anisotropic triangular structures. It was described that the excess free energy per unit area for a particular crystallographic face is the surface energy which determines the crystal growth of NPs.17 A representative XRD profile of the CAuNC which displays the structural information and crystallinity are shown in Fig. 1D. When chitosan reacted with HAuCl4·3H2O, the diffraction peak at 2θ = 38.1°, 44.5°, 64.2° and 77.7° were shown to be assigned to the (1 1 1), (2 0 0), (2 2 0) and (3 1 1) planes of a face centered cubic (fcc) lattice of Au. The XRD pattern of AuNPs (fcc) was consistent with the previous report of AuNPs data.18,19 For comparison, XRD pattern of pure chitosan was examined, and results showed there were only two strong peaks at 2θ = 10.4° and 21.8° (data not shown). The peak at 2θ about 22° is attributed to the allomorphic tend form of chitosan.29
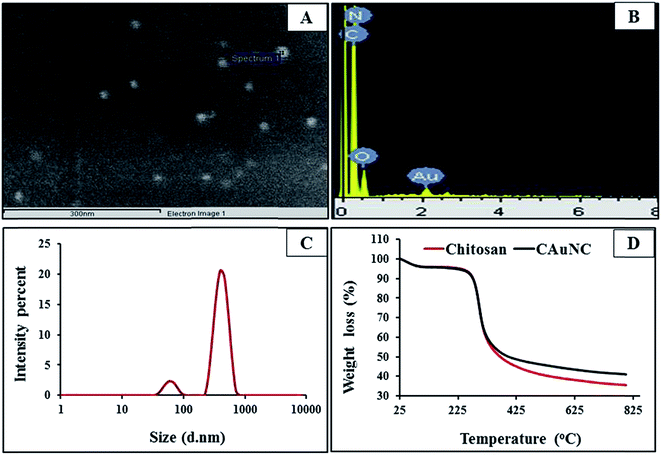
FE-SEM analysis results are given in Fig. 2A and it illustrates that majority of AuNPs were embedded in CAuNC in spherical shape and well dispersed in chitosan matrix. EDX spectrum is displayed in Fig. 2B and it verifies the formation of AuNPs by the transmission of signals at the energy of 2 keV. The size of NPs plays an important role in the determination of antimicrobial activity,30 due to their penetration ability into the eukaryotic cells via active or passive uptake pathways. Passive uptake occurs via diffusion, and facilitated the diffusion via transport proteins. Moreover, for the active uptake, transmembrane carrier protein and endocytic pathways including receptor-mediated phagocytosis are involved.30,31 In this study, particle size distribution results clearly came up with the two specific peaks in AuNPs (Fig. 2C). The first minor peak centered on the diameter of 23 nm attributed to the formation of chitosan-capped AuNPs, and the major peak (at 308 nm) suggests the presence of CAuNC in the solution. The particle size of CAuNC could be vary with the synthesis method, however, similar particle size distribution profile of CAuNC has been reported by Komalam et al.32 The particle size of CAuNC obtained by zetasizer analysis was considerably higher than that of FE-TEM analysis. This variation could be due to the formation of chitosan hydrogel shell in the aqueous solution. Zeta potential is crucial parameters for the nanostructure stability in aqueous solution.33 Meanwhile, zeta potential of ±30 mV is required to create the physically stable nano-suspension, which is stabilized by electrostatic repulsion.32 Zeta potential of CAuNC was +37.45 ± 1.25 mV, which suggested that the prepared CAuNC was moderately stable. Moreover, zeta potential has been suggested as a key factor that contributes to the antifungal effect of chitosan through the interaction with negatively charged microbial surface.34 TGA was used to characterize and compare the thermal properties of chitosan and CAuNC (Fig. 2D). The results showed that slight change of the thermal stability of CAuNC compared to that of pure chitosan, and that could be due to the presence of AuNPs. The thermograms of pure chitosan demonstrate that thermal degradation at two stages. First stage is related to mass loss which was observed up to 125 °C. The second stage was detected at range of 270–470 °C which could be due to final degradation of polymer. The maximum decomposition temperatures of both chitosan and CAuNC were 290–292 °C (Tmax). The residual mass percentage for chitosan and CAuNC at 800 °C was 35.56% and 41.01%, respectively, and the excess residual components indicated the presence of AuNPs in the polymer matrix. In the TGA results, initial mass loss has been described as a consequence of dehydration of saccharide rings, depolymerisation and decomposition of both, acetylated and deacetylation of carbohydrate monomers.1,14 The ICP-AES analysis results confirmed that CAuNC contains 13.56 ± 1.22% of Au. Moreover, ICP-MS detection limits for the Au elements in the PDB media was 8.56 ± 1.36 ppb. The ICP-MS analysis showed trace amounts of Au ions released from the CAuNC. The leached Au ions are expected to have minor influence on the antifungal activity of CAuNC due to their low concentration.
3.2 Effects of CAuNC on growth and cell viability of C. albicans
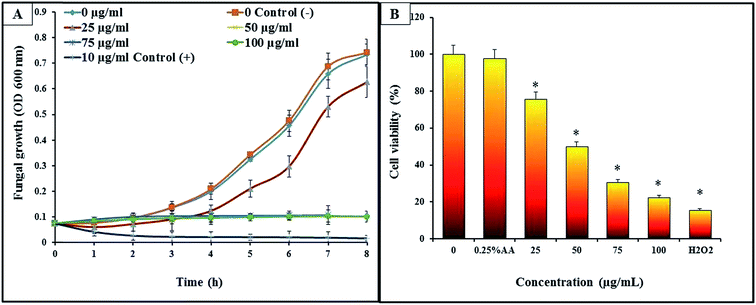
Growth inhibition of C. albicans was studied to understand the antifungal effects of CAuNC. All the tested concentrations of CAuNC showed the varying levels of inhibitory effect against C. albicans (Fig. 3A). MIC and MFC of CAuNC against C. albicans were determined via turbidimetric assay and spread plate technique. Results revealed that MIC was 50 μg mL−1 after 24 h of incubation at 30 °C and MFC was 75 μg mL−1. C. albicans growth patterns of treated samples below MIC concentrations were slightly lower than the control. In contrast, cells treated above the MIC levels (75 and 100 μg mL−1) have resulted the complete inhibition of C. albicans. Similarly, the complete growth inhibition of C. albicans was shown with nystatin (10 μg mL−1) as a positive control. Limited number of studies have been conducted to evaluate the anticandidal activities of AuNPs and chitosan based composites. As examples, low molecular weight-chitosan has resulted higher MIC90 (3 mg mL−1) compared to CNPs (0.25 mg mL−1) against C. albicans.35 Furthermore, Jebali et al., has reported that triangular shaped AuNPs conjugated with peptide ligand has MIC90 ranged from 39 to 64 μg mL−1 against C. albicans.36 Furthermore, the AuNPs conjugate-methylene blue had 31.2 and 62.5 μg mL−1 MIC and MFC, respectively.18 According to the Kulatunga et al., MIC value of chitosan silver nano composite (CAgNC) against C. albicans was 25 μg mL−1.37 However, there is no available data for comparing the MIC and MFC of our CAuNC with C. albicans. The amino acid of C. albicans can be conjugated with triangular AuNPs by thiol–gold interaction.36,38 This interaction is useful to inactivate the activity of sap enzyme which is a key virulent factor of C. albicans.38C. albicans exposed to CAuNC demonstrated a clear growth inhibitory effect by showing the reduction of cell viability by MTT assay. The cell viability of the C. albicans significantly decreased (P < 0.05) with CAuNC in a concentration dependent manner (Fig. 3B). Meanwhile, highest and lowest cell viability in CAuNC treated C. albicans were observed in control and 100 μg mL−1 treated groups, respectively. At the MIC concentration (50 μg mL−1), cell viability was calculated as 48%, whereas it was decreased up to 19% at 100 μg mL−1. The cell viability for positive control was 16% at the 30 mM H2O2.
3.3 Effects of CAuNC on morphological and structural changes of C. albicans
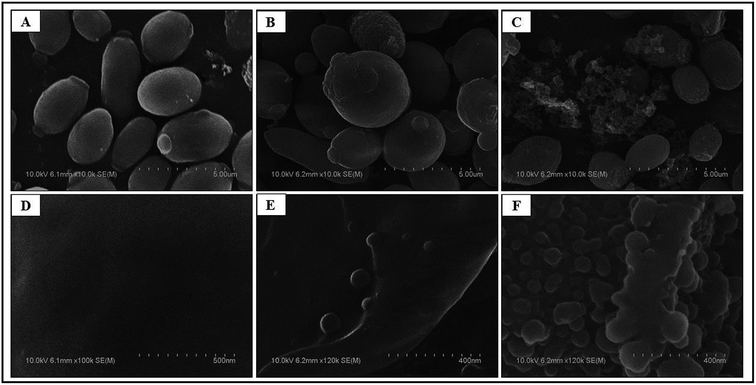
To understand the effects of CAuNC on C. albicans cell damage and alterations, FE-SEM analysis was conducted. Ultra-structural analysis results clearly indicated the formal morphological shape in un-treated C. albicans cells (Fig. 4A). However, CAuNC treated C. albicans cells clearly demonstrated the morphological deformities (Fig. 4B and C).There were clear cell membrane damage and formation of cellular debris after CAuNC treatment at MIC (50 μg mL−1) and MFC (75 μg mL−1) levels (Fig. 4B and C). To compare the effects of CAuNC on C. albicans cell surface, the characteristics morphology of treated and untreated C. albicans were observed under higher magnification (×100–120k). As expected untreated C. albicans cells displayed a smooth cell surface (Fig. 4D), while swelling and severe cell wall alterations were clearly shown at the MIC level (Fig. 4E). Moreover, CAuNC treated cells at MFC (75 μg mL−1) displayed fully disrupted cell walls and cellular debris from cells (Fig. 4F). Similar morphological changes of C. albicans cells have been shown by CAgNC treatment at the MIC and MFC level.37 It has been reported that yeast cells inherently adopt for survival by structural changing and strengthen of the cell walls.39,40
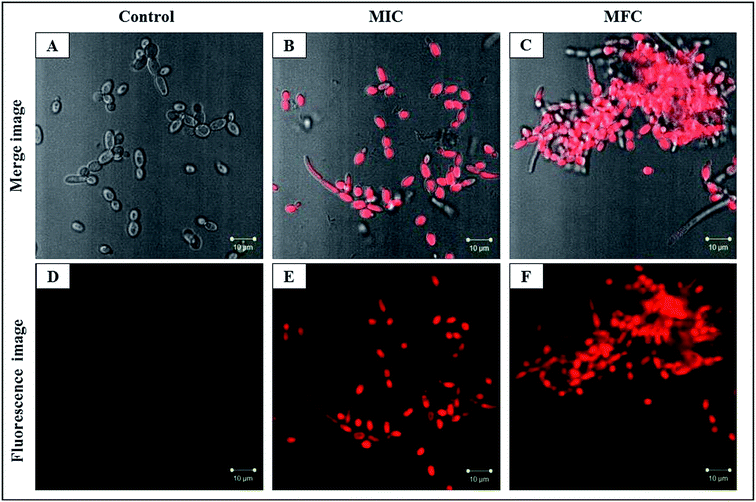
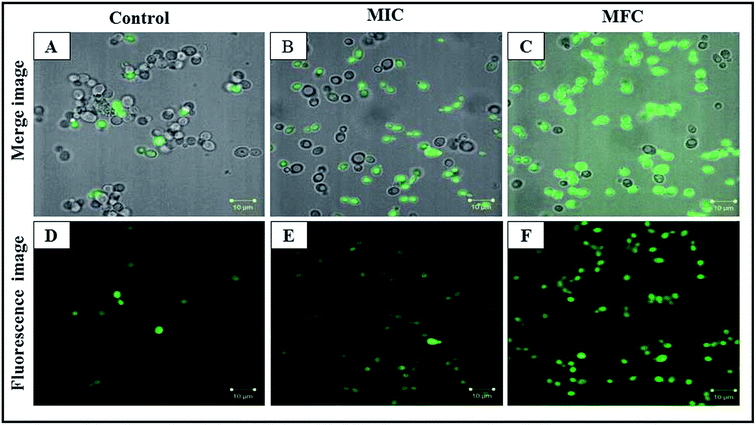
The PI uptake is associated with the cell membrane damage which indicates the alteration of cell membrane potential. PI is blocked by the intact membrane of viable cells and penetrates only into dead or damaged C. albicans cells and stain the nucleus showing the red fluorescence.41 PI stained by C. albicans cells showed the concentration dependent mortality with CAuNC treatment. The control cells had the least number of PI stained C. albicans cells which indicates the least number of cell death (Fig. 5A and D). On the other hand, the most of C. albicans cells showed higher red florescence at MIC (Fig. 5B and E). Moreover, at the MFC level almost all cells exhibited higher red fluorescence (Fig. 5C and F). Additionally, CAuNC treated cells at MFC and MIC levels induced the formation of characteristic pseudo-hyphae suggesting C. albicans cells are under a certain level of stress as reported by Dantas et al.42 Similar pseudo-hyphae formation was observed in our FE-SEM analysis (Fig. S1†). It was discussed that poly cationic chitosan binds with negatively charged C. albicans cell walls and help to the displacement of the K+ on the cell surface and losing of ionic balance.43 The efflux of positively charged K+ results in hyperpolarization of the plasma membrane, and in this study, it was confirmed by the PI uptake results.
3.4 Effects of CAuNC on intracellular ROS production
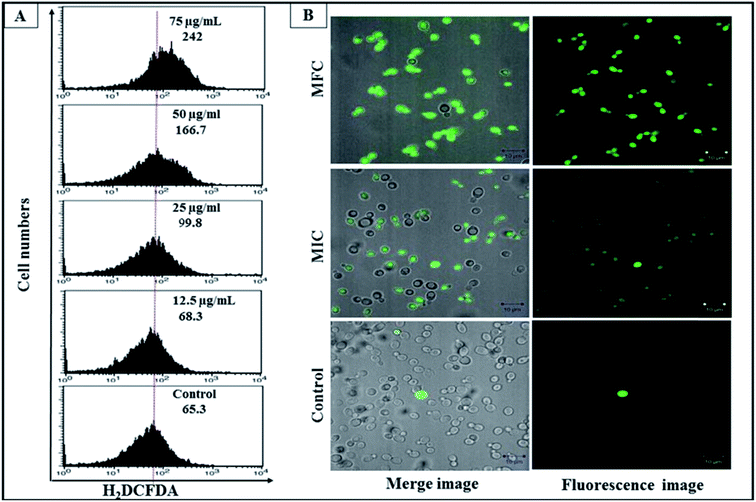
To understand the endogenous ROS production in C. albicans with CAuNC, H2DCF-DA staining was conducted. H2DCF-DA is an indicator of ROS, which is non-fluorescent until the acetate groups are removed by oxidation.44 The formation of ROS such as superoxide anion (O2−), hydroxyl radical (˙OH), hydrogen peroxide (H2O2), singlet oxygen (1O2) can lead to oxidative stress.45,46 The ROS level was increased in a concentration dependent manner when C. albicans treated with 12.5, 25, 50 and 75 μg mL−1 of CAuNP (Fig. 6A). Furthermore, C. albicans treated with 50 μg mL−1 (MIC) and 75 μg mL−1 (MFC) of CAuNC have shown the increased ROS fold by 2.5 and 3.7, respectively compared to un-treated cells. Among the CAuNC treated C. albicans cells, 55% of the cells showed DCF fluorescence at 50 μg mL−1 (MIC) level and more than 96% of the cells showed DCF fluorescence at 75 μg mL−1 (MFC) level (Fig. 6B). Comparison of ROS production in C. albicans cells with CAuNC has been not reported previously. However, previously we have shown that higher ROS production of C. albicans cells with the treatment of low molecular weight chitosan and CAgNC.47 Oxidative stress can activate the degradation of structural component, cellular membranes, and inactivate their basic functions via, increasing the membrane permeability and exposing the cellular contents into the outside. Rosseti et al., have demonstrated the similar phenomenon, suggesting that ROS can promote damage to DNA, proteins and cell membranes, leading to cell death.483.5 Effects of CAuNC on mitochondrial membrane potentials
Our results demonstrated that, in parallel to ROS production, the mitochondrial membrane potential was increased after CAuNC treatment. Rh-123 is a cationic and lipophilic dye that permeates the negatively charged mitochondria.49 In this study, Rh-123 was used to examine the effect of CAuNC on mitochondrial membrane potentials of C. albicans cell. The different concentrations of CAuNC (MIC and MFC) exposure for 6 h showed significantly higher fluorescence intensity of C. albicans cells than the control (Fig. 7). Cells have mitochondrial potential across their inner membranes, as a result of an electrochemical gradient maintained through the electron transport chain.50 Similar result against C. albicans has been reported with the essential oil, which is extracted from Anethum graveolens seeds.243.6 Analysis of CAuNC effect on protein expression of C. albicans by SDS-PAGE
To investigate the effects of CAuNC on protein expression in C. albicans, soluble protein fractions were compared with treated (MIC and MFC level) and untreated samples. Compared to the untreated sample, CAuNC treated cells showed low levels of some C. albicans proteins (Fig. S2†). This revealed decreased protein expression in CAuNC (50 and 75 μg mL−1) treated C. albicans cells, and suggesting that CAuNC could effect on protein expression. However, this lower amount of total protein in CAuNC treated C. albicans cells could be due to loss of soluble protein as a result of membrane permeability and disrupting cell membranes. Also, most anionic proteins may not come to the soluble fraction of the protein. Since, chitosan component of the CAuNC is a cationic polyelectrolyte which interacts with proteins and form complexes which is insoluble in the medium.51 It has been described that antimicrobial activity of chitosan occurs due to its polycationic nature that can cause damage to the fungal cells and enter the nuclei of bacteria or fungi.52 Then, it inhibits or slows down the synthesis of messenger RNA (mRNA) and protein by binding with microbial DNA.53 Based on our results, we propose that CAuNC may also regulate the inhibition of fungal genes or protein expression in C. albicans by similar mechanism, which needs to be studied in future.3.7 Cytotoxicity of CAuNC on mammalian cells
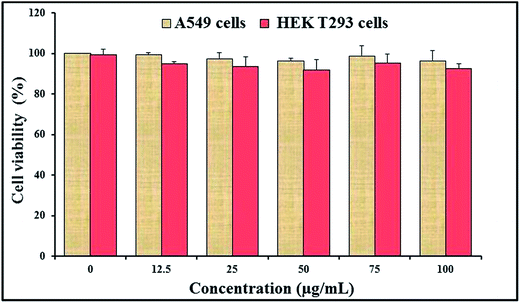
For the application of CAuNC as an antifungal agent or any other therapeutic application, toxicity assessment is essential. Therefore, the toxicity level of CAuNC was investigated using mammalian cells. Cytotoxicity assay was carried out to assess the effect of CAuNC on viability of two mammalian cell types (A549 and HEK293T cells) after 48 h incubation with CAuNC. Fig. 8 presents the data for A549 and HEK293T cells showing that there was no significant differences (P < 0.05) in cell viability up to 100 μg mL−1 of CAuNC compared to respective controls. However, further studies related to toxicity with different cells are needed; since A549 cells show specific cellular features, such as high level of glutathione and high heme oxygenase-1 (HO-1) gene expression which contribute to the cell responses for the oxidative stress.543.8 Efficacy of CAuNC therapy on C. albicans cell infection in zebrafish model
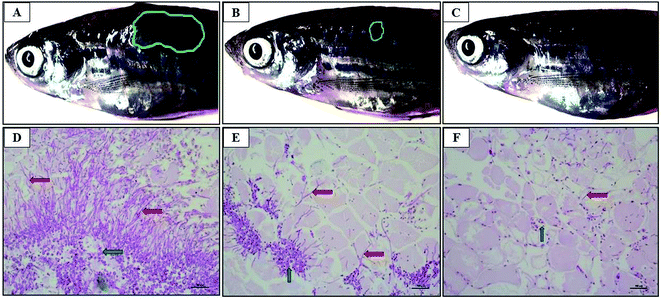
The zebra fish is a valuable tool for studying the pathogenicity of the opportunistic fungal pathogen.26 C. albicans cells were injected into the dorsal muscle of adult zebrafish to study the effectiveness of CAuNC therapy under in vivo conditions. The cumulative survival rate at day 5 post treatment was 22% and 74% in control and CAuNC treated groups, respectively. The highest survival rate (94%) was reported in amphoteracin B (5 μg per fish) treated group. Clear and superficial fungal mycelia were appeared around the injected site (reddish wound) of untreated fish at day 3 (Fig. 9A). There were no prominent mycelia in the CAuNC treated fish, however, it had small inflammatory area (Fig. 9B). Moreover, mycelia growth was completely disappeared in amphoteracin B treated fish (Fig. 9C). The histopathological analysis was conducted to compare the level of colonization and invaded fish tissues after the PAS staining. Extended growth of yeast-hypae was noticed in the C. albicans infected fish (Fig. 9D) compared to CAuNC treated fish (Fig. 9E) at 72 h post treatment (hpt). The antifungal drugs (amphoteracin B) treated fish tissue showed very limited growth of yeast-hyphae at 72 hpt (Fig. 9F). The results in this study demonstrate the strong effect of amphoteracin B as an antifungal drug. Moreover, histological observations of the infected sites were similar with the zebrafish and mouse model as described in the previous reports.20,26,554. Conclusion
Chitosan could be used as an efficient material for the rapid and green synthesis of AuNPs. In this study, CAuNC was synthesized by reduction method without adding a chemical reducing agent. The MIC and MFC values of the synthesized CAuNC were 50 and 75 μg mL−1. Results obtained from ROS analysis revealed that the higher ROS level may cause to higher plasma membrane damage of C. albicans. Based on these results, CAuNC could be used as an anticandidal dispersion system to control pathogenic C. albicans. In vivo results revealed that C. albicans could invade the muscle tissue of the fish at tested concentration; it has been proved that CAuNC treatment in constant time intervals could inhibit fungal growth and increase the survival rate of zebrafish. However, further studies are needed to explain individual role of composite materials. The exact mechanisms of the antimicrobial activities of CAuNC are still unknown. Therefore, future research will be focused on further understanding of the mode of action of CAuNC with C. albicans.Acknowledgements
This work was supported by a National Research Foundation of Korea (NRF) grant funded by the Korea government (MSIP) (2014R1A2A1A11054585), research fund of Chungnam National University and part of the project titled ‘Fish Vaccine Research Center’, funded by the Ministry of Oceans and Fisheries, Korea. We greatly appreciate Eun Young SUH from Center for Research Facilities, Chungnam National University for technical assistance.References
- P. M. Rahman, K. Muraleedaran and V. M. A. Mujeeb, Int. J. Biol. Macromol., 2015, 77, 266–272 CrossRef PubMed.
- R. Jia, Y. Duan, Q. Fang, X. Wang and J. Huang, Food Chem., 2016, 196, 381–387 CrossRef CAS PubMed.
- E. F. Fernandez, B. S. Carballal, W. M. Weber and F. M. Goycoolea, Int. J. Pharm., 2016, 502, 1–9 CrossRef PubMed.
- Y. C. Cheng, C. C. Yu, T. Y. Lo and Y. C. Liu, Mater. Res. Bull., 2012, 47, 1107–1112 CrossRef CAS.
- A. R. Nesic, A. Onjia, S. B. Ostojic, D. M. Micic, S. J. Velickovic and D. G. Antonovic, Mater. Lett., 2016, 167, 47–49 CrossRef CAS.
- R. Jiang, H. Zhu, X. Li and L. Xiao, Chem. Eng. J., 2009, 152, 537–542 CrossRef CAS.
- X. Li, S. M. Robinson, A. Gupta, K. Saha, Z. Jiang, D. F. Moyano, A. Sahar, M. A. Riley and V. M. Rotello, ACS Nano, 2014, 8, 10682–10686 CrossRef CAS PubMed.
- H. Huang, Q. Yuan and X. Yang, J. Colloid Interface Sci., 2005, 282, 26–31 CrossRef CAS PubMed.
- S. Kumar, V. Deepak, M. Kumari and P. K. Dutta, Int. J. Biol. Macromol., 2016, 84, 349–353 CrossRef CAS PubMed.
- B. Lowe, J. Venkatesan, S. Anil, M. S. Shim and S. K. Kim, Int. J. Biol. Macromol., 2016, 93, 1479–1487 CrossRef CAS PubMed.
- S. Sohrabi, A. Haeri, A. Mahboubi, A. Mortazavi and S. Dadashzadeh, Int. J. Biol. Macromol., 2016, 85, 625–633 CrossRef CAS PubMed.
- A. Nithya, H. L. Jeeva Kumari, K. Rokesh, K. Ruckmani, K. Jeganathan and K. Jothivenkatachalam, J. Photochem. Photobiol., B, 2015, 153, 412–422 CrossRef CAS PubMed.
- L. S. Wang, C. Y. Wang, C. H. Yang, C. L. Hsieh, S. Y. Chen, C. Y. Shen, J. J. Wang and K. S. Huang, Int. J. Nanomed., 2015, 10, 2685–2696 CAS.
- A. Regiel-Futyra, M. Kus-Liśkiewicz, V. Sebastian, S. Irusta, M. Arruebo, G. Stochel and A. Kyziol, ACS Appl. Mater. Interfaces, 2015, 7, 1087–1099 CAS.
- D. Kim, Y. Y. Jeong and S. Jon, ACS Nano, 2010, 4, 3689–3696 CrossRef CAS PubMed.
- A. Li Volsi, D. Jimenez de Aberasturi, M. Henriksen-Lacey, G. Giammona, M. Licciardi and L. M. Liz-Marzán, J. Mater. Chem. B., 2016, 4, 1150–1155 RSC.
- M. R. Bindhu and M. Umadevi, Mater. Lett., 2014, 120, 122–125 CrossRef CAS.
- S. Khan, F. Alam, A. Azam and A. U. Khan, Int. J. Nanomed., 2012, 7, 3245–3257 CrossRef CAS PubMed.
- S. El-Kirat-Chatel and Y. F. Dufrene, Nanoscale Horiz., 2016, 1, 69–74 RSC.
- M. A. Sherwani, S. Tufail, A. A. Khan and M. Owais, PLoS One, 2015, 10, e0131684 Search PubMed.
- R. Soman, D. Raghav, S. Sujatha, K. Rathinasamy and C. Arunkumar, RSC Adv., 2015, 5, 61103–61117 RSC.
- R. S. Kumar, S. H. S. Dananjaya, M. De Zoysa and M. Yang, RSC Adv., 2016, 6, 108468–108476 RSC.
- R. F. Li, X. H. Yan, Y. B. Lu, Y. L. Lu, H. R. Zhang, S. H. Chen, S. Liu and Z. F. Lu, Exp. Ther. Med., 2015, 23, 1768–1776 Search PubMed.
- Y. Chen, H. Zeng, J. Tian, X. Ban, B. Ma and Y. Wang, J. Med. Microbiol., 2013, 62, 1175–1183 CrossRef PubMed.
- U. K. Laemmli, Nature, 1970, 227, 680–685 CrossRef CAS PubMed.
- C. C. Chao, P. C. Hsu, C. F. Jen, I. H. Chen, C. H. Wang, H. C. Chan, P. W. Tsai, K. C. Tung, C. H. Wang, C. Y. Lan and Y. J. Chuang, Infect. Immun., 2010, 78, 2512–2521 CrossRef CAS PubMed.
- M. Westerfield, The zebrafish book, A guide for the laboratory use of zebrafish (Danio rerio), University of Oregon Press, Eugene, 4th edn, 2000 Search PubMed.
- Y. K. Twu, Y. W. Chen and C. M. Shih, Powder Technol., 2008, 185, 251–257 CrossRef CAS.
- L. Qi and Z. Xu, Colloids Surf., A, 2004, 251, 183–190 CrossRef CAS.
- D. Sharma, J. Rajput, B. S. Kaith, M. Kaur and S. Sharma, Thin Solid Films, 2010, 519, 1224–1229 CrossRef CAS.
- N. voon Moos, P. Bowen and V. I. slaveykova, Environ. Sci.: Nano, 2014, 1, 214–232 RSC.
- A. Komalam, L. G. Muraleegharan, S. Subburaj, S. Suseela, A. Babu and S. George, Int. Nano Lett., 2012, 2, 26 CrossRef.
- S. Kashyap, S. Mishra and S. K. Behera, J. Nanopart., 2014, 640281 Search PubMed.
- J. Chen, F. Wang, Q. Liu and J. Du, Chem. Commun., 2014, 50, 14482–14493 RSC.
- L. Y. Ing, N. M. Zin, A. Sarwar and H. Katas, Int. J. Biol. Macromol., 2012, 632698 Search PubMed.
- A. Jebali, F. H. E. Hajjar, S. Hekmatimoghaddam, B. Kazemi, J. M. De La Fuente and M. Rashidi, Biochem. Pharmacol., 2014, 90, 349–355 CrossRef CAS PubMed.
- D. C. M. Kulatunga, S. H. S. Dananjaya, G. I. Godahewa, J. Lee and M. De Zoysa, Med. Mycol., 2016, 55, 213–222 CrossRef PubMed.
- F. H. E. Hajjar, A. Jebali and S. Hekmatimoghaddam, Nanomed. J., 2015, 2, 54–59 CAS.
- L. A. Walker, M. D. Lenardon, K. Preechasuth, C. A. Munro and N. A. R. Gow, J. Cell Sci., 2013, 126, 2668–2677 CrossRef CAS PubMed.
- J. P. Ouedraogo, S. Hagen, A. Spielvogel, S. Engelhardt and V. Meyer, J. Biol. Chem., 2011, 286, 13859–13868 CrossRef CAS PubMed.
- M. Kwolek-Mireka and R. Zadrag-Tecza, FEMS Yeast Res., 2014, 14, 1068–1079 Search PubMed.
- A. D. S. Dantas, A. Day, M. Ikeh, I. Kos, B. Achan and J. Quinn, Biomolecules, 2015, 5, 142–165 CrossRef CAS PubMed.
- A. Pena, N. S. Sanchez and M. Calahorra, BioMed Res. Int., 2013, 527549 Search PubMed.
- L. Liu, Y. F. Shen, G. L. Liu, F. Ling, X. Y. Liu, K. Hu, X. Le Yang and G. X. Wang, FEMS Microbiol. Lett., 2015, 362, 196 CrossRef PubMed.
- I. Rosenthal and E. Ben-Hur, Int. J. Radiat. Biol., 1995, 67, 85–91 CrossRef CAS PubMed.
- T. J. Dougherty, C. J. Gomer, B. W. Henderson, G. Jori, D. Kessel, M. Korbelik, J. Moan and Q. Peng, J. Natl. Cancer Inst., 1998, 90, 889–905 CrossRef CAS PubMed.
- S. H. S. Dananjaya, D. C. M. Kulatunga, G. I. Godahewa, J. Lee and M. D. Zoysa, RSC Adv., 2016, 6, 33455–33461 RSC.
- I. B. Rosseti, L. R. Chagas and M. S. Costa, Lasers in Medical Science, 2014, 29, 1059–1064 CrossRef PubMed.
- I. S. Hwang, J. Lee, J. H. Hwang, K. J. Kim and D. G. Lee, FEBS J., 2012, 279, 1327–1338 CrossRef CAS PubMed.
- G. Simbula, P. A. Glascott Jr, S. Akita, J. B. Hoek and J. L. Farber, Am. J. Physiol., 1997, 273, 479–488 Search PubMed.
- A. Zubareva, A. Ilyina, A. Prokhorov, D. Kurek, M. Efremov, V. Varlamov, S. Senel, P. Ignatyev and Е. Svirshchevskaya, Molecules, 2013, 18, 7848–7864 CrossRef CAS PubMed.
- L. A. Hadwiger, Plant Sci., 2013, 208, 42–49 CrossRef CAS PubMed.
- A. A. Tayel, S. Moussa, W. F. el-Tras, D. Knittel, K. Opwis and E. Schollmeyer, Int. J. Biol. Macromol., 2010, 47, 454–457 CrossRef CAS PubMed.
- G. Speit and I. Bonzheim, Mutagenesis, 2003, 18, 545–548 CrossRef CAS PubMed.
- N. V. Solis and S. G. Filler, Nat. Protoc., 2012, 7, 637–642 CrossRef CAS PubMed.
Footnote |
| † Electronic supplementary information (ESI) available. See DOI: 10.1039/c6ra26915j |
| This journal is © The Royal Society of Chemistry 2017 |

