 Open Access Article
Creative Commons Attribution 3.0 Unported Licence
Correlations between the physical properties and chemical bonds of extruded corn starch enriched with whey protein concentrate
Chen Yua,
Junfei Liua,
Xiaozhi Tang*a,
Xinchun Shen a and
Shaowei Liub
aCollege of Food Science and Engineering/Collaborative Innovation Center for Modern Grain Circulation, Safety/Key Laboratory of Grains and Oils Quality Control and Processing, Nanjing University of Finance and Economics, Nanjing 210023, China. E-mail: warmtxz@njue.edu.cn; Fax: +86-25-85870277; Tel: +86-25-85870277
bDepartment of Food Science and Engineering, East China University of Science and Technology, 200237, China
First published on 20th February 2017
Abstract
The effects of extrusion temperature and whey protein concentrate (WPC) addition on the physical properties of extruded corn starch were studied. The correlations between the physical properties of the extrudates and the internal chemical bonds in the protein were analyzed using the statistical method of Pearson. Increasing the temperature from 130 °C to 150 °C resulted in lower specific mechanical energy (SME); expansion ratio (ER); water solubility index (WSI); protein solubility in phosphate buffer, 2-mercaptoethanol and sodium dodecyl sulfate (Pb + 2-Me + SDS); and a higher hardness of the extrudates. On the other hand, increasing the level of WPC (0–40%) resulted in a lower SME, WSI, content of sulfhydryl (SH) groups, degree of gelatinization (GD), protein solubility in Pb + 2-Me + SDS, and a darker color of the extrudates. The ER at 130 °C first increased from 8.80 to 14.04 and then decreased to 6.86 with the increasing WPC content from 0 to 40%, whereas the trend of hardness was the opposite. Correlation analysis revealed that the content of SH groups was significantly related to ER, SME, WAI, WSI, GD, and color, which may be a good indicator for the quality of whey protein-fortified extrusion-expanded products.
1. Introduction
Whey protein concentrate (WPC) was extracted from whey, a by-product in the milk or dairy industry, via special techniques such as diafiltration, ultrafiltration, electrodialysis, and ion-exchange technologies.1 WPC can be given to the children to aid the development of the body, making it an effective ingredient in weaning foods as it contains similar amino acid sequences as breast milk.2 Recent studies have shown that WPC is also beneficial in maintaining intestinal integrity5 and is also beneficial in treating many diseases such as urogenital cancers3 and Crohn's Disease.4 To further exploit the application of WPC in functional foods, the relevant nutritional, biological, and functional properties of WPC were reported.6Over the past few decades, extrusion processing of starch has been well commercialized, especially in the category of snack foods.7,8 There are many studies on enhancing the protein component of the expanded snack products since extruded starch-based products have a markedly low protein content.9–11 However, the texture and sensorial properties are also altered by protein addition. WPC is a superior protein available in the food industry. Therefore, extrusion-expanded products based on starch and WPC have been developed. Yadav et al.12 incorporated WPC into pearl millet during extrusion and found that lower expansion ratio and higher bulk density, hardness, and breaking force were associated with the WPC addition between 0% and 7.5%. Similar results were also reported by Allen et al.13 and Devi et al.,14 who added higher amounts of whey protein (12–40%) to corn flour or sorghum and corn flour blends. However, Onwulata et al.15 investigated the influence of various WPC levels (0–50%) on the physical properties of snack foods by extruding corn meal, rice, or potato flour. They pointed out that extrudates with good characteristics could be produced with up to 25% WPC, which indicates that the products with better properties could be extruded under certain processing conditions. This is similar to the observations reported by Kirjoranta et al.16 and Cheng et al.17
Although many studies have been conducted to reveal the effects of varying levels of WPC on the physical properties of the extrudates, studies on the relationship between changes of the chemical bonds in the protein, extrusion processing parameters, and extrudate physical properties still need to be conducted. Therefore, the objectives of this current study were to investigate the effect of extrusion temperature and WPC addition on the physical properties of corn starch-based extrudates and to reveal the correlations between the internal chemical bonds in the protein and the physical properties of the extrudates using the Pearson correlation coefficient.
2. Materials and methods
2.1 Materials
Regular corn starch was purchased from Zhucheng XingMao Development Co. Ltd (Shandong, China). WPC (composition: 83.4% of crude protein, 2.38% of crude lipids, and 1.12% of ash, d.b.) was obtained from Fonterra Co-operative Group (Auckland, New Zealand). Non-interfering protein concentration determination reagent kit was purchased from Sangon Biotech (Shanghai, China). Urea, EDTA, sodium dodecyl sulfate (SDS), DTNB (5,5′-dithiobis-(2-nitrobenzoic acid)), 2-mercaptoethanol (2-Me), and other chemicals were of analytical grade.2.2 Preparation of the corn starch–WPC blends
Blends of corn starch and WPC were mixed using a SINMAG blender (Wuxi, China) containing 0, 10, 20, 30, and 40% WPC by weight. The blends were then tempered to 18% moisture content and kept overnight.2.3 Extrusion process
The mixtures were extruded using a Brabender DSE-20 twin-screw extruder (Duisburg, Germany). The extruder consisted of five independent zones with controlled temperature in the barrel, a screw diameter of 20 mm, an L/D ratio of 30![[thin space (1/6-em)]](https://www.rsc.org/images/entities/char_2009.gif) :
:![[thin space (1/6-em)]](https://www.rsc.org/images/entities/char_2009.gif) 1, and a die diameter of 4 mm. The screw speed and feeder speed were kept constant. The extrusion temperature was varied in the last three zones, which were set as 70/100/130/130/130 °C and 70/100/150/150/150 °C.
1, and a die diameter of 4 mm. The screw speed and feeder speed were kept constant. The extrusion temperature was varied in the last three zones, which were set as 70/100/130/130/130 °C and 70/100/150/150/150 °C.
The extruded samples were dried at 40 °C for 24 h. Then, some were used for determining the degree of expansion and peak force, and the others were ground to a powder, which was passed through an 80 mesh screen for further analysis.
2.4 Specific mechanical energy (SME)
The SME, mechanical energy input per unit mass of extrudate, was calculated as follows:
 | (1) |
2.5 Expansion ratio (ER)
The ER was computed using the following equation:
 | (2) |
2.6 Color
The color was measured as a series of L*, a*, and b* values by a colorimeter (Konica Minolta, Japan). Each assay was repeated 10 times, and the average value was used. The color difference (ΔE) was defined as the difference between the color of the samples and the standard white porcelain color, which was calculated using the following equation:
 | (3) |
2.7 Peak force (PF)
PF data for the extrudates was obtained using a TA-XT2i texture analyzer (Stable Microsystems, England) equipped with a P/35 probe. Samples were placed on the testing platform with a test speed of 0.5 mm s−1 and a deformation degree of 60%. Ten measurements were carried out for each treatment.2.8 Water absorption (WAI) and water solubility (WSI) indices
The WAI and WSI of the extrudates were determined following the centrifuge method.18 Samples with a mass of 2 g were placed into centrifuge tubes with 25 mL distilled water, and then the suspensions were held in a water bath at 30 °C for 30 min followed by centrifugation at 4200 rpm for 15 min. The supernatant was dried at 105 °C until the weight was constant. The WAI and WSI were defined as follows:
 | (4) |
 | (5) |
2.9 Degree of gelatinization (GD)
The degree of gelatinization (GD) was measured using a method of Birch with slight modifications.19 A 40 mg sample was dispersed in a 40 mL 0.06 N KOH and gently agitated for 20 min, and then the suspensions were centrifuged for 10 min at 4000 rpm. A 1 mL supernatant, 1 mL 0.06 N HCl, and 8 mL distilled water were added to a special container and were then mixed with 0.1 mL 1% KI–I2. The absorbance of the test group was obtained at 600 nm against a reagent blank without the sample. KOH (0.06 N) and HCl (0.06 N) were replaced by 0.5 N KOH and 0.5 N HCl in the control group. The average of three measurements was taken and the GD was computed using the following equation:
 | (6) |
2.10 Disulfide-sulfhydryl analysis
The contents of sulfhydryl (SH) group and disulfide (SS) bond were determined according to the method reported by Anderson.20 Determination of the total sulfhydryl group content (TSH) was carried out as follows: 30 mg sample was suspended in 1 mL buffer A (composition: 8 M urea, 2 mM EDTA, 1% SDS, and 0.2 M Tris–HCl (pH = 8.0)), then the suspension was vortexed for 30 s, and was stirred for 1 h at room temperature. After this, buffer B (composition: 10 M DTNB and 0.2 M Tris–HCl (pH = 8.0)) was added to the suspension, which was stirred for another 1 h, and centrifuged for 10 min at 5000 rpm. The supernatant (200 μL) was added to a 96-well plate and then the absorbance was obtained at 412 nm.Determination of the free sulfhydryl group content (FSH) was carried out as follows: 30 mg sample was suspended in 1 mL of buffer C (composition: 8 M urea, 3 mM EDTA, 1% SDS, 0.1 M Na2SO3, and 0.2 M Tris–HCl (pH = 9.5)), then the suspension was vortexed for 30 s and stirred for 1 h in a dark environment, and centrifuged for 10 min at 5000 rpm. The supernatant (0.1 mL) was diluted with buffer D (composition: 8 M urea, 3 mM EDTA, 1% SDS, 0.1 M Na2SO3, and 0.2 M Tris–HCl (pH = 8.0)), and the absorbance was obtained at 412 nm.
The content of sulfhydryl groups was calculated as follows:
 | (7) |
The content of disulfide bonds was calculated as follows:
 | (8) |
2.11 Protein solubility (PS)
PS represents the percentage rates for protein in the extrudates dissolved in different buffer solutions to the total protein in the extrudate. Extruded samples were extracted with sequential extraction procedures using the following buffers:21,22 (1) pH = 7.0 phosphate buffer solution (Pb), (2) 2% 2-ME in Pb solution (Pb + 2-ME), (3) 1% SDS in Pb solution (Pb + SDS), and (4) 2% 2-ME + 1% SDS in Pb solution (Pb + 2-Me + SDS). The extruded sample (0.50 g) was extracted with 20 mL of the abovementioned extractant. After continuously stirring for 2 h, the suspension was centrifuged at 4000 rpm. The solubilized protein in the supernatant was detected by a non-interfering protein concentration determination reagent kit. Triplicate tests were carried out for each sample and the average value was used.2.12 Statistical analysis
All the data were analyzed using SPSS 17.0 (Chicago, IL). Analysis of significance and correlations was performed using the method of Pearson.3. Results and discussion
3.1 Correlation coefficients
The correlations between the physical properties of the extrudates and the changes of the internal chemical bonds in the protein are summarized in Table 1.| SME | ER | Color | PF | WAI | WSI | GD | SH | SS | Pb | Pb + 2-Me | Pb + SDS | Pb + 2-Me + SDS | |
|---|---|---|---|---|---|---|---|---|---|---|---|---|---|
| a Note: ***α significant level of =0.01, **α significant level of =0.05, *α significant level of =0.1. Pb, Pb + 2-Me, Pb + SDS and Pb + 2-Me + SDS mean PS in different buffers. | |||||||||||||
| SME | 1 | 0.139 | −0.920** | 0.035 | 0.48 | 0.740* | 0.934** | 0.758* | −0.222 | 0.18 | 0.111 | −0.216 | 0.847** |
| ER | 1 | −0.424 | −0.903** | 0.759* | 0.667* | 0.112 | 0.742* | 0.065 | 0.244 | 0.085 | −0.44 | 0.853** | |
| Color | 1 | 0.172 | −0.725* | −0.796** | −0.916** | −0.882** | 0.188 | −0.108 | −0.161 | 0.433 | −0.861** | ||
| PF | 1 | −0.523 | −0.539 | 0.153 | −0.435 | −0.28 | −0.456 | 0.047 | 0.221 | −0.777* | |||
| WAI | 1 | 0.634* | 0.486 | 0.734* | 0.228 | −0.016 | 0.378 | −0.373 | 0.618 | ||||
| WSI | 1 | 0.653* | 0.718* | 0.044 | 0.42 | −0.118 | −0.564 | 0.927** | |||||
| GD | 1 | 0.910** | −0.602 | −0.4 | 0.48 | −0.499 | 0.404 | ||||||
| SH | 1 | −0.404 | −0.24 | 0.369 | −0.619 | 0.626 | |||||||
| SS | 1 | 0.437 | −0.103 | 0.205 | −0.049 | ||||||||
| Pb | 1 | −0.802* | −0.106 | 0.56 | |||||||||
| Pb + 2-Me | 1 | 0.08 | −0.351 | ||||||||||
| Pb + SDS | 1 | −0.453 | |||||||||||
| Pb + 2-Me + SDS | 1 | ||||||||||||
3.2 Specific mechanical energy
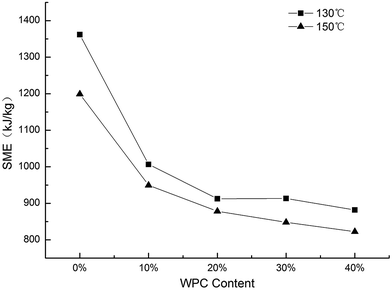
SME is defined as the mechanical energy transferred from the extruder to the material, and it depends on the torque, screw speed of the extruder, and output of the production.18 As shown in Fig. 1, the SME at 150 °C is lower than that at 130 °C, which is due to the decreased melt viscosity on increasing the processing temperature. A lower SME with a higher WPC level has been reported in previous studies,15,23 and this was attributed to the lower starch content and lower degree of gelatinization due to water competition between the WPC and corn starch in the blends. Beyond a WPC level of 20%, the SME did not show a significant downward trend probably because of the viscosity contribution from the heat-induced gelation of whey protein.3.3 Expansion ratio
The expansion ratio, an important index valuing the quality of ready-to-eat extruded snack products, affects the structure and textural characteristic of the extrudates. The overall trend of the ER value was that the ER first increased and then decreased with the increasing WPC content (Fig. 2). At lower levels of WPC, proper crosslinking reactions between WPC and starch enhanced the extensional properties of the extruded melts, which had a positive effect on expansion.24 In addition, low levels of WPC helped strengthen the bubble cell wall and resist shrinkage after the die.25 As the WPC level further increased above 20%, the ER decreased probably because of a lower starch content and aggregation of proteins, which disrupted the integrity of the corn starch matrix. Seker26 also reported that protein–starch reactions could decrease the free expansion of amylopectin chains and inhibit the release of water vapor during extrusion, thus limiting the expansion and increasing the density. Heat treatment of WP changes its structure from the native, compact folded to a denatured, unfolded structure.27 Therefore, the number of sites for cross-linking among the proteins and starches increased with an increase in the protein concentration, which would subsequently affect the continuity of the starch matrix.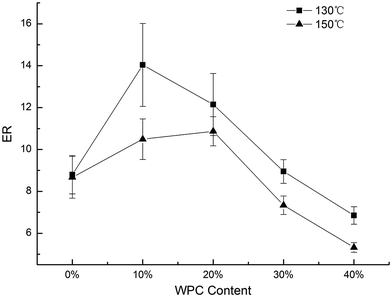 | ||
| Fig. 2 Effect of WPC addition and extrusion temperature on ER of the extrudates, error bars indicate standard deviation. | ||
Processing temperature is also an important factor. It was observed that the ER at 130 °C was higher than that at 150 °C. The higher temperature decreased the melt viscosity before exiting the die. At the same time, it might be beneficial towards the aggregation of proteins when the WPC was incorporated.
3.4 Color
Color is a significant attribute of the extruded products due to the acceptance by consumers. The colors, which was measured by L*, a*, and b* values, are summarized in Table 2.| Extrusion temperature (°C) | WPC content (%) | L* | a* | b* | ΔE |
|---|---|---|---|---|---|
| 150 | 0 | 93.66 | −0.66 | 11.70 | 10.46 |
| 10 | 81.89 | 5.38 | 25.34 | 28.45 | |
| 20 | 76.46 | 8.60 | 29.72 | 35.68 | |
| 30 | 71.06 | 11.64 | 32.61 | 41.89 | |
| 40 | 68.36 | 12.79 | 33.26 | 44.39 | |
| 130 | 0 | 92.34 | −0.37 | 12.43 | 11.61 |
| 10 | 87.44 | 2.17 | 20.19 | 20.81 | |
| 20 | 81.15 | 6.29 | 28.35 | 31.52 | |
| 30 | 76.49 | 9.41 | 31.28 | 37.09 | |
| 40 | 72.16 | 11.78 | 33.38 | 41.83 |
L* values represent the lightness of the extrudate by a level of 0–100. Redness of the extrudate is donated by the a* values. The b* values suggest the yellowness of the extrudate. The results indicated that the L* of the extrudates decreased and a*, b*, and ΔE increased with the increasing WPC content. From the data obtained, it was observed that the color was influenced by varying the levels of WPC, which was mainly attributed to the reactions between the residues of sugar by the degradation of corn starch or lactose and the amino acids in WPC. These reactions during the extrusion process usually include Maillard, Caramelization, and others.28 Changes of color were not only related to the WPC content, but were also influenced by the processing temperature. It is shown in Table 2 that ΔE at 150 °C was higher than that at 130 °C at the same level of WPC. A higher temperature accelerated the reactions, such as Maillard and Caramelization, resulting in a darker color at 150 °C.
3.5 Hardness
A peak force (PF) is an important index to measure the textural property of expansion, which decides the hardness of the products. Fig. 3 shows the data for PF vs. WPC and the extrusion temperature. The overall trend of PF was that the PF value first decreased and then increased with the incorporation of WPC from 0 to 40%. The PF at 150 °C was higher than that at 130 °C due to a lower expansion ratio. The lowest PF (52.93 N) was observed when 10% WPC was added and was extruded at 150 °C.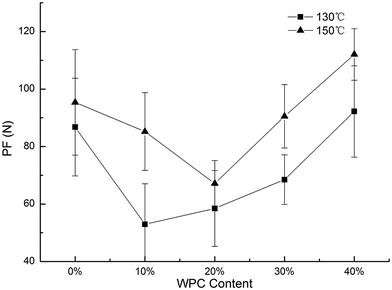 | ||
| Fig. 3 Effect of WPC addition and extrusion temperature on PF of the extrudates, error bars indicate standard deviation. | ||
It is known that the microstructure of the expanded products, such as the bubble size, the distribution of bubbles, and the bubble cell wall, affects the hardness of the extrudates.29 PF was inversely related to ER, which was statistically supported by the correlation value of r = −0.903, as shown in Table 1. Higher expansion means more bubbles and a thinner cell wall, which may increase the brittleness and decrease the PF.
3.6 Water absorption and water solubility index
WAI was influenced by both extrusion temperature and WPC content. In general, WAI decreased with the increasing levels of WPC (Fig. 4a). However, it did not exhibit a dramatic downward trend between 0% and 20%. WAI reflects the ability of starch to absorb water and is an indirect measure of the amount of intact and fully gelatinized starch granules. The lower WAI with the increasing WPC content was probably due to a reduced starch content, which meant less starch was available for gelatinization during extrusion and subsequently absorbed water. In addition, the interactions between the starch and WPC decreased the amount of hydrophilic groups, which may also reduce the WAI. The WAI at 150 °C was higher than that at 130 °C between 0% and 20% WPC; however, beyond 20%, the trend was the opposite. At a high temperature and a low WPC level, more starch was available to be gelatinized and subsequently absorbed more amount of water. Beyond 20% WPC, the amount of insoluble aggregates increased due to the cross-linking reactions with the increasing temperature. WAI had a positive correlation with the ER (r = 0.759). A low WAI meant a lower amount of completely gelatinized starch granules, which decreased the melt viscosity and ER of the extrudates.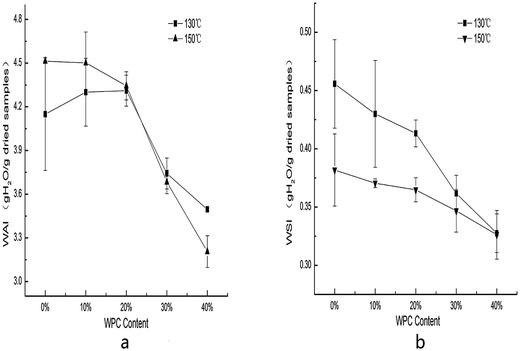 | ||
| Fig. 4 Effect of WPC addition and extrusion temperature on WAI (a) and WSI (b) of the extrudates, error bars indicate standard deviation. | ||
WSI is closely related to the degradation of starch30 and it decreased with the increasing WPC level (Fig. 4b), indicating that WPC addition inhibited starch degradation due to a lower starch to protein ratio and cross-linking reactions between starch and WPC. Similar observations have been reported by Matthey and Hanna,28 who considered the interactions between starch and WPC had a disadvantage for the degradation of starch. At the same WPC level, WSI at 130 °C was higher than that at 150 °C. The data in Table 1 shows that WSI and SME had a markedly positive correlation (r = 0.74). A lower temperature led to a higher SME, indicating that starch–WPC blends suffered more mechanical shears in the extruder and increased the degree of starch degradation. WSI had a negative correlation with WAI (r = −0.634), which has also been observed by many other authors.31,32 ER and WSI had a positive correlation (r = 0.667). The insoluble aggregates formed by the cross-linking reactions between the protein and starch molecules disrupted the continuity of the starch matrix and led to lower ER.
3.7 Degree of gelatinization (GD)
As shown in Fig. 5, increasing the levels of WPC resulted in a reduction in the GD. GD is significantly affected by the processing parameters such as moisture content and temperature.33 With the addition of WPC, WPC would compete for water with starch, subsequently decreasing the GD of starch. GD had the same trend as SME, which was statistically supported by the Pearson's correlation value of r = 0.934. A lower SME indicated less mechanical energy input, pointing to incomplete gelatinization of starch. The GD at 130 °C was higher than that at 150 °C with the initial addition of WPC from 0% to 10%. However beyond 10%, an opposite trend was observed. At low levels of WPC, SME played an important role in the gelatinization of starch. With the further increase of WPC content, SME significantly decreased, thus the processing temperature became the dominant factor.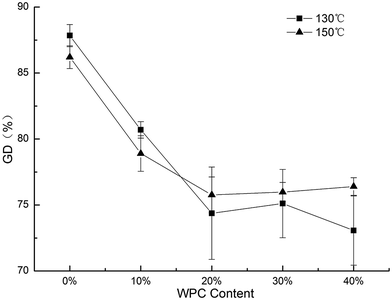 | ||
| Fig. 5 Effect of WPC addition and extrusion temperature on GD of the extrudates, error bars indicate standard deviation. | ||
3.8 Disulfide bond and sulfhydryl group
The contents of SH group and SS bond in the extrudates were lower than those in the raw materials, which is in agreement with the results reported by Anderson.20 The increasing levels of WPC resulted in a decrease in the SH groups (Fig. 6a), which was probably because of the cross-linking reactions and the oxidation of sulfhydryl groups during extrusion. When WPC was between 10 to 20%, the SH group content at 130 °C was higher than that at 150 °C. However, when WPC was more than 20%, the trend was inversed. SH group content had a positive correlation with SME (r = 0.75). A higher SME induced more mechanical energy transferred to starch–WPC blends, which was beneficial for the denaturation of protein and thus decreased the content of SH group. That's also probably why the content of SH group at 130 °C was higher than that at 150 °C at low levels of WPC. There is a markedly positive correlation between content of SH group and ER (r = 0.742), meaning denaturation and cross-linking reactions of whey protein had detrimental effects on starch expansion. Aggregation of proteins interfered with the formation of a continuous starch matrix, thus decreasing the ER. Color and SH group content had a markedly negative correlation (r = −0.882). The unfolded proteins provided more reaction sites with the reducing sugar, which made the color darker with the increasing WPC proportion. The SH group content had close correlations with WAI (r = 0.734) and WSI (r = 0.718). A lower SH group content indicated more cross-linking reactions amongst protein and starch molecules, resulting in more insoluble substances, which had lower water absorption and solubility. GD also had a significantly positive correlation with the content of SH groups (r = 0.91). SH group content decreased, suggesting that the tertiary structure of whey protein was unfolded and there was more competition for water between starch and WPC.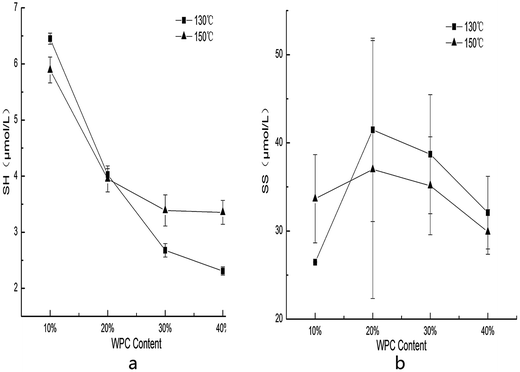 | ||
| Fig. 6 Effect of WPC addition and extrusion temperature on the sulfhydryl group (a) and disulfide bond (b) contents of the extrudates, error bars indicate standard deviation. | ||
SS bond content did not show a specific trend with the increasing WPC levels (Fig. 6b). This finding is different from that in the previous studies reported by Li34 and Synowiecki,35 who found that the content of SS increased when the content of SH decreased. They considered that SS and SH can transmute into each other via a redox reaction. However, some authors pointed out that high shear, low moisture, and short retention time in the extruder may lead to the opposite phenomenon.19,36 There are different types of chemical bonds, such as hydrogen bonds, hydrophobic interactions, SS, etc., that maintain the protein structure. During the processing, SS bonds might be replaced by hydrogen bonds or other non-disulfide covalent bonds at a low SME.37
3.9 Protein solubility (PS)
The percentages of protein solubilized in different solutions from the extruded samples are shown in Table 3. In Pb, the protein solubility varied from 0.479 to 1.69%, indicating a very small amount of soluble protein in the extruded samples. Among all the extruded samples, the increasing temperature decreased the protein solubility in Pb. In Pb + 2-Me and Pb + SDS, there were no specific trends observed for protein solubility. In Pb + 2-Me + SDS, the protein solubility significantly decreased with the increasing levels of WPC and the increasing temperature further decreased the solubility of the protein.| Processing temperature (°C) | WPC content (%) | Extraction rate (%) | |||
|---|---|---|---|---|---|
| Pb | Pb + 2-Me | Pb + SDS | Pb + 2-Me + SDS | ||
| 130 | 10 | 1.02 | 1.93 | 1.09 | 72.8 |
| 20 | 1.69 | 1.58 | 1.14 | 65.2 | |
| 30 | 1.21 | 1.97 | 1.90 | 30.6 | |
| 40 | 1.07 | 1.74 | 1.73 | 27.2 | |
| 150 | 10 | 0.482 | 2.29 | 1.40 | 37.8 |
| 20 | 0.479 | 2.23 | 1.49 | 19.3 | |
| 30 | 0.949 | 2.06 | 1.15 | 15.1 | |
| 40 | 0.629 | 1.84 | 1.41 | 11.2 | |
According to Fang et al.,38 Pb alone only dissolves protein molecules in their native states. 2-Me breaks disulfide bonds, whereas SDS is generally known as an agent for disrupting the non-covalent interactions such as hydrophobic and ionic interactions. At low levels of WPC (10%) at 130 °C, the extraction rate in Pb + 2-Me + SDS was 72.8%, indicating that the non-covalent bonds and disulfide bonds interaction effects were the main chemical bonds in the protein of the extrudates. However, with the increasing WPC content from 10 to 40%, PS in Pb + 2-Me + SDS decreased from 72.8 to 27.2%, meaning the chemical bonds in the protein changed. Aggregation of proteins through the non-disulfide covalent bonds and hydrogen bonds (interactions between proteins and starch molecules) played significantly important roles in maintaining the structure of the protein after extrusion. Similar results have been previously reported by Mei,39 who indicated the aggregation of proteins through non-disulfide covalent bonds while extruding the wheat flour. On increasing the temperature from 130 to 150 °C, the PS in Pb + 2-Me + SDS further decreased to 11.2%, showing that the non-covalent bonds and disulfide bonds interaction effect was not anymore the dominant chemical bond in the protein of the extrudate.
The PS in Pb + 2-Me + SDS was influenced by SME (r = 0.847), meaning a higher mechanical shear strength induced protein aggregation based on the interactive effects of non-covalent bonds and disulfide bonds probably because more hydrophobic groups were exposed with higher SME. This may be the reason why a lower PS in Pb + 2-Me + SDS was obtained at higher levels of WPC or higher temperatures. There were also positive correlations between PS and ER (r = 0.853) and PS and WSI (r = 0.927). A lower PS in Pb + 2-Me + SDS may reflect higher amounts of aggregated protein with non-disulfide covalent bonds or hydrogen bonds between the protein and starch molecules with the increasing WPC content and extrusion temperature, which increased the size of the starch molecules and disrupted the integrity of the corn starch matrix, thus leading to a lower ER and WSI. PS and PF had a markedly negative correlation (r = −0.777). A lower PS indicated more interactions between WPC and corn starch, which increased the melt viscosity and led to a thicker cell wall, resulting in a higher PF.
4. Conclusion
In this study, the relationship between the changes of the chemical bonds in proteins, the extrusion temperature, and the extrudate physical properties were investigated. SME, ER, WSI, PS in Pb, and PS in Pb + 2-Me + SDS decreased and PF increased with the increasing processing temperature from 130 to 150 °C. When WPC proportion was between 20 and 40%, the increasing temperature resulted in a higher GD and SH group content and a lower WAI and SS bond content. WPC addition was another important factor. Increasing the levels of WPC resulted in a lower SME, WSI, SH group content, GD, PS in Pb + 2-Me + SDS, and a darker color of the extrudates. Correlation analysis revealed that the SH group content was positively related to ER, SME, WAI, WSI, and GD (r > 0.718), whereas was negatively related to the color (r = −0.882). At the same time, there were significant correlations between PS in Pb + 2-Me + SDS and SME, ER, color, WSI, and PF. Thus, changes of the chemical bonds in the protein had a significant effect on the apparent physical properties of the extrudates and SH group content, which may be a good indicator for the quality of whey protein-fortified extrusion-expanded products.Acknowledgements
We would like to thank Key University Science Research Project of Jiangsu Province for funding this project (Grant No. 12KJA550002). The project was also funded by the Priority Academic Program Development of Jiangsu Higher Education Institutions (PAPDF). The authors thank for the support received from 2013 Jiangsu university outstanding science and technology innovation team.References
- C. V. Morr and E. Y. Ha, Crit. Rev. Food Sci. Nutr., 1993, 33, 431–476 CrossRef CAS PubMed
.
- E. Forsum, J. Trop. Pediatr. Environ. Child Health, 1973, 19, 333–338 Search PubMed
.
- G. Bounous, Anticancer Res., 2000, 20, 4785–4792 CAS
.
- J. Benjamin, G. Makharia, V. Ahuja, K. D. A. Rajan, M. Kalaivani, S. D. Gupta and Y. K. Joshi, Dig. Dis. Sci., 2012, 57, 1000–1012 CrossRef CAS PubMed
.
- K. Xiao, L. Jiao, S. Cao, Z. Song and C. H. X. Han, Br. J. Nutr., 2016, 1, 1–10 CrossRef PubMed
.
- F. Arrutia, R. Rubio and F. A. Riera, J. Food Eng., 2016, 184, 1–9 CAS
.
- S. Yagci and F. Gogus, J. Food Eng., 2008, 86, 122–132 CrossRef CAS
.
- L. M. Duizer, O. H. Campanella and G. R. G. Barnes, J. Texture Stud., 1998, 29, 397–411 CrossRef
.
- Y. K. Chang, J. M. Hashimoto, R. Acioli-Moura, H. E. Martinez-Flores and F. Martinez-Bustos, Acta Aliment., 2001, 30, 189–203 CAS
.
- J. I. Enrione, P. C. Díaz, S. B. Matiacevich and S. E. Hill, J. Food Res., 2012, 1, 224–232 CrossRef
.
- N. C. Zamora, Arch. Latinoam. Nutr., 2003, 53, 293–298 CAS
.
- D. N. Yadav, T. Anand, P. Navnidhi and A. K. Singh, Int. J. Food Sci. Technol., 2014, 49, 840–846 CrossRef CAS
.
- K. E. Allen, C. E. Carpenter and M. K. Walsh, Int. J. Food Sci. Technol., 2007, 42, 953–960 CrossRef CAS
.
- N. L. Devi, S. Shobha, X. Tang, S. A. Shaur, H. Dogan and S. Alavi, Int. J. Food Prop., 2011, 16, 263–276 CrossRef
.
- C. I. Onwulata, P. W. Smith, R. P. Konstance and V. H. Holsinger, Food Res. Int., 2001, 34, 679–687 CrossRef
.
- S. Kirjoranta, K. Solala, J. Suuronen, P. Penttilä, M. Peura, R. Serimaa, M. Tenkanen and K. Jouppila, Int. J. Food Sci. Technol., 2012, 47, 1165–1175 CrossRef CAS
.
- E. M. Cheng, S. Alavi, T. Pearson and R. Agbisit, J. Texture Stud., 2007, 38, 473–498 CrossRef
.
- N. J. E. D. Mesa, S. Alavi, N. Singh, Y. C. Shi, H. Dogan and Y. Sang, J. Food Eng., 2009, 90, 262–270 CrossRef
.
- G. G. Birch and R. J. Priestley, Starch - Stärke, 1973, 25, 98–100 CrossRef CAS
.
- A. K. Anderson and N. Pkw, Cereal Chem., 2000, 77, 354–359 CrossRef CAS
.
- R. Alonso, E. Orúe, X. A. J. Zabalza, G. Grant and F. Marzo, J. Sci. Food Agric., 2000, 80, 397–403 CrossRef CAS
.
- S. Lin, H. E. Huff and F. Hsieh, J. Food Sci., 2000, 65, 264–269 CrossRef CAS
.
- G. D. Valle, L. Quillien and J. Gueguen, J. Sci. Food Agric., 1994, 64, 509–517 CrossRef
.
- A. Arhaliass, J. Legrand, P. Vauchel, F. Fodilpacha, T. Lamer and J. M. Bouvier, Food Bioprocess Technol., 2009, 2, 186–193 CrossRef
.
- C. I. Onwulata, R. P. Konstance, P. W. Smith and V. H. Holsinger, J. Food Sci., 1998, 63, 814–818 CrossRef CAS
.
- M. Seker, J. Sci. Food Agric., 2005, 85, 1161–1165 CrossRef CAS
.
- S. Kishigami, Cereal Chem., 2001, 78, 25–43 Search PubMed
.
- F. P. Matthey and M. A. Hanna, Lebensmittel-Wissenschaft und-Technologie, 1997, 30, 359–366 CrossRef CAS
.
- A. Altan, K. L. Mccarthy and M. Maskan, J. Food Eng., 2008, 84, 231–242 CrossRef
.
- H. S. Gujral, N. Singh and B. Singh, Food Chem., 2001, 74, 303–308 CrossRef CAS
.
- M. Brnčić, T. Bosiljkov, M. Ukrainczyk, B. Tripalo, S. R. Brnčić, S. Karlović, D. Karlović, D. Ježek and D. V. Topić, Food Bioprocess Technol., 2011, 4, 1296–1306 CrossRef
.
- L. J. Zhu, R. Shukri, N. J. D. Mesa-Stonestreet, S. Alavi, H. Dogan and Y. C. Shi, J. Food Eng., 2010, 100, 232–238 CrossRef CAS
.
- S. Lin, F. Hsieh and H. E. Huff, Lebensmittel-Wissenschaft und-Technologie, 1997, 30, 754–761 CrossRef CAS
.
- S. Q. Li, H. Q. Zhang, Z. T. Jin and F. H. Hsieh, Int. J. Food Sci. Technol., 2005, 40, 731–741 CrossRef CAS
.
- J. Synowiecki and F. Shahidi, J. Agric. Food Chem., 1991, 39, 2006–2009 CrossRef CAS
.
- B. K. Koh, M. V. Karwe and K. M. Schaich, Cereal Chem., 1996, 73, 115–122 CAS
.
- H. Chanvrier, C. N. Pillin, G. Vandeputte, A. Haiduc, V. Leloup and J. C. Gumy, Food Struct., 2015, 6, 29–40 CrossRef
.
- Y. Fang, B. Zhang, Y. Wei and S. Li, J. Food Eng., 2013, 115, 220–225 CrossRef CAS
.
- M. Li and T. C. Lee, J. Agric. Food Chem., 1996, 44, 763–768 CrossRef CAS
.
| This journal is © The Royal Society of Chemistry 2017 |

