 Open Access Article
Fenton-like degradation of 2,4-dichlorophenol using calcium peroxide particles: performance and mechanisms
Hefei Wangab,
Yongsheng Zhaoab,
Yan Suc,
Tianyi Liab,
Meng Yaoa and
Chuanyu Qin *ab
*ab
aCollege of Environment and Resources, Jilin University, Changchun 130021, China. E-mail: qincyu@jlu.edu.cn; Tel: +86 43188502608
bKey Laboratory of Groundwater Resources and Environment, Ministry of Education, Jilin University, Changchun 130021, China
cShenyang Academy of Environmental Sciences, Shenyang 110167, China
First published on 16th January 2017
Abstract
The degradation process of 2,4-dichlorophenol (2,4-DCP) in aqueous solution by a Fenton-like system using calcium peroxide (CaO2) particles as a source of solid H2O2 was investigated. EDTA was added to the system to chelate iron and promote the Fenton-like reaction. The results show that 2,4-DCP can be readily degraded in a CaO2/EDTA-chelated Fe(II) system. Compared with an H2O2/EDTA-chelated Fe(II) system, 2,4-DCP degradation showed a moderate reaction rate owing to the slow dissolution process of the CaO2 particle. Complicated degradation kinetics were observed and the possible reason was revealed. The initial amount of EDTA chelated iron lost during the Fenton-like reaction was in the range 20–30%. The effects of different reaction parameters, such as initial pH, CaO2 dosage and amount of EDTA–chelated iron, on 2,4-DCP degradation were studied. According to the identification of dominant reactive species and degradation intermediates, a possible theoretical degradation pathway of 2,4-DCP was proposed.
1 Introduction
The Fenton-like process, which was developed from traditional Fenton technology, provides a promising alternative for the oxidative treatment of contaminated soil and groundwater. Conventional Fenton's reagent involves the catalyzed decomposition of hydrogen peroxide (H2O2) by Fe(II) to form a suite of highly active species, including the hydroxyl radical (HO˙), perhydroxyl radicals ( ), superoxide radical anions (
 ), and hydroperoxide anions (HO2−) (reaction (1)–(8)).1–6 Among them, HO˙ generated via reaction (1) is the main species. It has a high oxidation potential (2.76 V) and can react indiscriminately with most organic contaminants at near diffusion-limited rates.1
| H2O2 + Fe(II) → HO˙ + OH− + Fe(III) | (1) |
 | (2) |
 | (3) |
| Fe(II) + HO˙ → Fe(III) + OH− | (4) |
 | (5) |
 | (6) |
| HO˙ + HO˙ → H2O2 | (7) |
| HO˙ + organics → products + CO2 + H2O | (8) |
However, the conventional Fenton process, which is used primarily for treating waters and wastewaters, is not feasible for in situ soil or groundwater remediation. This is because the conventional Fenton's reaction is usually conducted by gradually adding dilute H2O2 to a solution of excess Fe(II) in conditions where the optimal pH is below 3. Fenton's reagent is usually modified for in situ chemical oxidation (ISCO) using a one-time addition of higher concentration of H2O2 and varying the type of catalyst (i.e. Fe(II), Fe(III), iron chelates, or iron minerals).7,8 A high concentration of liquid H2O2 is typically injected in the subsurface for the supply of H2O2 in the modified Fenton system (MF, or Fenton-like system). However, the H2O2 utilization efficiency is very low because of the instability of H2O2 in the subsurface.9 It has been reported that liquid H2O2 can only persist from a few minutes to several hours after injected into the subsurface. Disproportionation (reaction (9)) constitutes the major loss of H2O2 at neutral pH.10,11 It consumes H2O2 without producing HO˙ and releases O2 gas, which clogs pores around the injection wells and promotes contaminant volatilization.12,13 Therefore, means for slow and controlled release of the H2O2 into the subsurface are highly desirable.
| 2H2O2 → H2O + O2 | (9) |
By far, one of the most useful solid forms of peroxide for environmental applications is calcium peroxide (CaO2).14,15 Previously, CaO2 was mostly used as an oxygen release compound (ORC), which could slowly decompose to release oxygen when in contact with water (reaction (10)).16–18 Recent studies showed that CaO2 can be a more effective source of H2O2 than liquid H2O2 in MF-ISCO.19,20 In fact, CaO2 can dissolve in water to form H2O2 via eqn (11) at a large pH range, liberating a maximum of 0.47 g H2O2 per g CaO2.21 According to the available literature, the yield of H2O2 from CaO2 decreased, while production of O2 was elevated with the increase of pH and temperature.19,22 And about 70–80% of CaO2 was transformed to H2O2 at moderate pH and temperature. Moreover, H2O2 released from CaO2 is auto-regulated by the rate of CaO2 dissolution, reducing disproportionation of H2O2 to O2 since not all the H2O2 is available at once as it is with liquid H2O2.
| CaO2 + H2O → Ca(OH)2↓ + 1/2O2↑ | (10) |
| CaO2 + 2H2O → Ca(OH)2↓ + H2O2 | (11) |
The excellent properties of CaO2 to release H2O2 at a controlled rate attracted more and more researchers to apply CaO2 in MF-ISCO.23,24 Ndjou'ou and Cassidy25 applied a commercially available CaO2-based oxidant to treat soils contaminated with total petroleum hydrocarbons (TPH) and found that CaO2 removed 96% of TPH. Bogan et al.20 reported that CaO2 performed better than liquid H2O2 for removing polycyclic aromatic hydrocarbons (PAHs) from soil. Xiang Zhang et al.26 used CaO2 activated with ferrous ions to treat trichloroethylene (TCE) with 100% removal efficiency. Northup and Cassidy19 investigated CaO2 dissolution to yield H2O2 at various pH conditions and the degradation performance of perchlorethylene (PCE) in the modified Fenton system.
Although the preliminary experimental results look promising, the relationship between 2,4-DCP removal efficiency and the main influencing factors in a CaO2-based MF system, particularly CaO2 dosage, chelate-Fe(II) content, and solution pH, need to be further studied. In addition, the mechanisms of CaO2-based MF oxidation and the degradation route of chlorinated aromatic hydrocarbons are still not thoroughly elucidated. In this research, 2,4-dichlorophenol (2,4-DCP) was used as the representative target contaminant of chlorinated aromatic hydrocarbons. The aim of this experiment is first to explore a practical system, which can degrade 2,4-DCP with high removal efficiency, and find out the effect of main experimental parameters on 2,4-DCP removal. Second, molecular probe tests and scavenger tests were conducted to identify the reactive oxygen species responsible for 2,4-DCP degradation. Third, the mineralization of 2,4-DCP was monitored, the main intermediate products were analyzed and the 2,4-DCP degradation pathway was proposed.
2 Materials and methods
2.1 Materials
Analytical grade calcium peroxide (75% CaO2, 25% Ca(OH)2) and 2,4-dichlorophenol (2,4-DCP 99.0%) were purchased from Aladdin Reagent Co. Ltd. (Shanghai, China). Chromatographic grade methyl alcohol (CH3OH, 99.9%) was purchased from TEDIA High Purity Solvent Co. Ltd. (Fairfield, America). Acetonitrile (C2H3N, 99.9%) was purchased from Thermo Fisher Scientific Co. Ltd. (Shanghai, China). Carbon tetrachloride (CT, 99.5%) was purchased from Tianjin Aoran Chemical Research Institute (Tianjin, China). Monosodium phosphate dihydrate (NaH2PO4·2H2O, 99.0%) and disodium phosphate dodecahydrate (Na2HPO4·12H2O, 99%), anhydrous disodium ethylenediaminetetraacetate (C10H14O8N2Na2, EDTA, 99%), sodium formate (NaCHO2, 99.5%), sodium acetate (NaC2H3O2, 99.0%), acetic acid (C2H4O3, 99.5%), sodium oxalate (Na2C2O4, 99.8%), ammonium acetate (C2H7O2N, 99%), tert-butyl alcohol ((CH3)3OH, TBA, 98.0%), hydrogen peroxide (H2O2, 30%) and ferrous sulfate heptahydrate (FeSO4·7H2O, 99.0%) were purchased from the Sinopharm Chemical Reagent Co. Ltd. (Beijing, China). Ammonium molybdate (((NH4)6Mo7O24), 99.0%), trichloromethane (CHCl3, 99.0%), nitrobenzene (NB, 99.0%), sodium hydroxide (NaOH, 96%) and methanol (CH3OH, 99.9%) were purchased from Beijing Chemical Works (Beijing, China). Ultrapure water from a Milli-Q water process (Classic DI, ELGA, Marlow, UK) was used for preparing aqueous solutions.2.2 Preparation
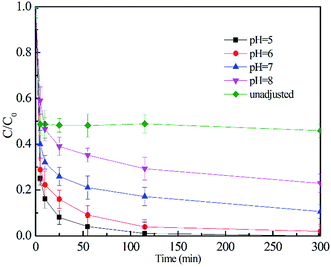
The buffer solutions used in this study were prepared with NaH2PO4·2H2O and Na2HPO4·12H2O in de-ionized water. Buffer solutions with three different pH values (6.0, 7.0 and 8.0) were chosen to evaluate the effect of pH on the degradation performance. The buffer strength of the solutions was 0.05 mol L−1. Preliminary testing verified that each buffer solution was able to maintain the desired pH with the dose of CaO2 and other reagents used. A stock solution of 2,4-DCP was prepared by allowing the pure non-aqueous phase liquid 2,4-DCP to equilibrate with buffer solutions of desired pH value under gentle stirring and then diluted to the desired concentration. In the studies, each reactor also received EDTA chelated Fe(II) to catalyze the MF reaction. The initial concentration of 2,4-DCP was kept at 100 mg L−1 (0.61 mM). In all experiments except for the effect of CaO2 dosage and the amount of EDTA–Fe(II) on the degradation performance, the initial molar ratio of CaO2/EDTA–Fe(II)/2,4-DCP was set as 16/4/1.2.3 Procedure
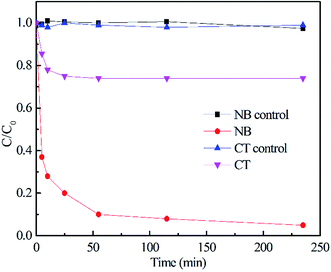
All experiments were conducted in a 250 mL jacketed cylindrical glass reactor with a constant temperature of 22 °C ± 0.5 °C using a thermostat circulating water bath. A magnetic stirrer was used to ensure the uniformity of contaminants. After the chemicals participating in the reaction, except for CaO2 (for instance, 2,4-DCP, EDTA chelated ferrite, etc.), were dissolved in the reactor and the reaction was started by adding the desired CaO2 dosage. Samples were withdrawn at desired time intervals and immediately quenched with methyl alcohol before the analysis of 2,4-DCP. In order to identify the reactive oxygen species generated during the reaction, probe tests were conducted in accordance with the 2,4-DCP degradation procedure and 2,4-DCP was replaced by NB (HO˙ probe),27,28 or CT ( probe).29,30 Furthermore, to evaluate the contribution of the reactive oxygen species to 2,4-DCP degradation, TBA (HO˙ scavenger)28 and CHCl3 (
 scavenger),29 as radical scavengers, had been applied in the experiments to observe 2,4-DCP degradation changes. Phosphate buffer solutions at three pH values (6.0, 7.0 and 8.0) were chosen to observe the effect of pH on the degradation performance and in other experiments, the pH of solution was maintained at 7.0. All experiments were conducted in duplicate and the mean values were reported. The standard deviations in all experiments were in the range of 0.012–0.050.
2.4 Analyses
The concentrations of 2,4-DCP and NB were measured by means of an Agilent 1100 high performance liquid chromatograph (HPLC) with a C18 reversed-phase column (5 μm, 4.6 mm × 150 mm) and a diode array detector (DAD). To determinate the concentration of 2,4-DCP, the mobile phase was methanol/water (70![[thin space (1/6-em)]](https://www.rsc.org/images/entities/char_2009.gif) :
:![[thin space (1/6-em)]](https://www.rsc.org/images/entities/char_2009.gif) 30, v/v) with a flow rate of 1.0 mL min−1. The UV detector was set at 225 nm. To measure aqueous samples containing NB, the mobile phase was acetonitrile/acetate buffer solution (65
30, v/v) with a flow rate of 1.0 mL min−1. The UV detector was set at 225 nm. To measure aqueous samples containing NB, the mobile phase was acetonitrile/acetate buffer solution (65![[thin space (1/6-em)]](https://www.rsc.org/images/entities/char_2009.gif) :
:![[thin space (1/6-em)]](https://www.rsc.org/images/entities/char_2009.gif) 35, v/v) with a flow rate of 1.0 mL min−1. The UV detector was set at 262 nm. The degradation intermediates were identified using a Waters ultra performance liquid chromatography (UPLC) with an Acquity UPLC C18 column (1.7 μm, 2.1 × 100 mm) and Quattro Premier™ XE mass spectrometer. The mobile phase was methanol/water (70
35, v/v) with a flow rate of 1.0 mL min−1. The UV detector was set at 262 nm. The degradation intermediates were identified using a Waters ultra performance liquid chromatography (UPLC) with an Acquity UPLC C18 column (1.7 μm, 2.1 × 100 mm) and Quattro Premier™ XE mass spectrometer. The mobile phase was methanol/water (70![[thin space (1/6-em)]](https://www.rsc.org/images/entities/char_2009.gif) :
:![[thin space (1/6-em)]](https://www.rsc.org/images/entities/char_2009.gif) 30, v/v) with a flow rate of 0.25 mL min−1. The desolvation gas was N2 and the gas temperature was 400 °C. The ion source temperature was set at 110 °C. CT in the solution was first extracted with hexane (1 mL) for 3 min using a vortex stirrer and kept standing for 5 min for separation. Extracts containing CT were then measured by means of an Agilent 6890A gas chromatograph with an autosampler (Agilent 7693), a DB-VRX column (1.4 μm, 0.25 mm × 60 m) and an electron capture detector (ECD). The temperatures of the injector, column and ECD detector were set at 240 °C, 80 °C and 260 °C, respectively.
30, v/v) with a flow rate of 0.25 mL min−1. The desolvation gas was N2 and the gas temperature was 400 °C. The ion source temperature was set at 110 °C. CT in the solution was first extracted with hexane (1 mL) for 3 min using a vortex stirrer and kept standing for 5 min for separation. Extracts containing CT were then measured by means of an Agilent 6890A gas chromatograph with an autosampler (Agilent 7693), a DB-VRX column (1.4 μm, 0.25 mm × 60 m) and an electron capture detector (ECD). The temperatures of the injector, column and ECD detector were set at 240 °C, 80 °C and 260 °C, respectively.
Total organic carbon (TOC) was measured by a total organic carbon analyzer (TOC-L, Shimadzu, Japan). The H2O2 concentration in aqueous phase was determined using a spectrophotometer (Evolution, Thermo, United States) at a wavelength of 340 nm after the color was developed by ammonium molybdate. The solution pH was analyzed using a yellow spring instrument (YSI-100, America) pH-meter. To determine the concentration of chloride ions (Cl−), carboxylic acids and EDTA, an ion chromatograph (ICS-2100, Dionex, Germany) equipped with a Dionex RFICTM IonPac® AS 19 analytical column (4 mm × 250 mm) was used throughout the experiment. The eluent was 3.5 mM KOH with a flow rate of 1.0 mL min−1.
3 Experimental results and discussion
3.1 The performance of 2,4-DCP degradation in a Fenton-like system
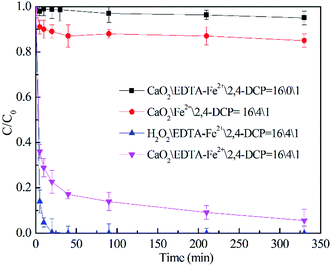
The degradation of 2,4-DCP along time under different experimental conditions was evaluated as shown in Fig. 1.The experiments were carried out with a fixed 2,4-DCP concentration at different CaO2 (or H2O2)/EDTA–Fe(II)/2,4-DCP molar ratios. The pH value was maintained at 7.0 with phosphate buffer and the temperature was kept at 22 °C. It was observed that within 450 min of reaction time, less than 5% removal of 2,4-DCP was obtained with a molar ratio of 16/0/1. In the H2O2/EDTA–Fe(II)/2,4-DCP system, 2,4-DCP was removed completely within only 20 min and as the degradation reaction progressed, a large amount of micro-bubbles were generated in the solution. It means that a large amount of H2O2 decomposed to O2 during this violent degradation reaction and this problem would be magnified when H2O2 is applied to actual site remediation according to previous studies.10,11
Remarkable degradation of 2,4-DCP was also achieved in the CaO2/EDTA–Fe(II) system. However, the degradation rate was relatively moderate compared with that of the conventional H2O2/EDTA–Fe(II) system. In the CaO2/EDTA–Fe(II) system, the removal efficiency of 2,4-DCP reached 83.0% within 30 minutes, and then the degradation rate (slope of the degradation curves) slowed down gradually. It indicates that remarkable degradation of 2,4-DCP was also achieved in the CaO2/EDTA–Fe(II) system with a relatively moderate degradation rate compared with that of the conventional H2O2/EDTA–Fe(II) system. According to the literature and our previous studies,19,22 CaO2 can slowly release H2O2 after being dissolved in water. It can thus be reasonably deduced that EDTA–Fe(II) reacted quickly with H2O2 released by CaO2 and the reaction facilitated the CaO2 dissolution simultaneously, generating a large amount of reactive oxygen species. Along with the generation of H2O2, Ca(OH)2 can also be formed through reaction (11), but phosphate buffer solution was able to maintain the desired pH. In addition, only a small amount of bubbles, which were considered as O2, were generated in the CaO2/EDTA–Fe(II) system. It is concluded that CaO2, compared with H2O2, can dramatically prolong the contaminant removal reaction time by releasing H2O2 at a controlled rate and enhance the utilization efficiency of peroxide by reducing the O2 yield, which is not responsible for the MF reaction. The abovementioned results demonstrated that it was much more feasible to use CaO2 as a long-term source of H2O2 to promote MF-ISCO.
To investigate the activity of EDTA–Fe(II) in the degradation of 2,4-DCP, a control experiment was conducted with the molar ratio of CaO2/Fe(II)/2,4-DCP, consistent with that of other systems. It can be observed that only 13% of 2,4-DCP was removed without the addition of EDTA, whereas 95% of 2,4-DCP was removed in the system of CaO2/EDTA–Fe(II)/2,4-DCP. Total iron testing (not shown) showed that only little soluble iron remained in the system at the end of experiments. By contrast, about 70% of initial iron was detected in the CaO2/EDTA–Fe(II)/2,4-DCP system. The low degrading efficiency in the CaO2/Fe(II)/2,4-DCP system is probably ascribed to the sharp decrease of the concentration of soluble iron. Two reasons can account for the diminution of Fe(II) catalytic activity. On one hand, phosphate used to buffer pH can combine most of the Fe(II) in solution to form sediment as soon as Fe(II) is added into the solution. On the other hand, the other part of Fe(II) involved in Fenton degradation was oxidized to Fe(III) immediately by HO˙ and then converted to a precipitate of Fe(OH)3 completely within the first 5 min. Once iron was converted to a precipitate, it could no longer participate in the radical propagation cycle. It can be concluded that chelation of EDTA can effectively maintain the catalytic activity of Fe(II) in Fenton chemistry based on CaO2 at moderate pH.
3.2 Decay of EDTA–Fe(II) in a Fenton-like system
To better understand the role of EDTA chelated Fe(II) in the 2,4-DCP degradation process, the decay mechanisms of EDTA and iron ions were also investigated. As observed in Fig. 2, similar to the degradation process of 2,4-DCP, the concentration of EDTA shows a prominent decrease during the reaction time. This is because HO˙ generated in the MF system have a great oxidizing power and can degrade both 2,4-DCP and EDTA indiscriminately to form carboxylic acids of small molecules or CO2. Previous studies also showed the degradation of EDTA in the MF system.31,32 In addition to this, the identification results of deposits in the bottom of the reactor showed the presence of EDTA, which indicates that a small amount of EDTA initially dissolved in the solution precipitated out during the reaction time.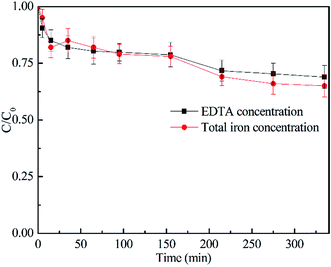 | ||
| Fig. 2 Decay of EDTA–Fe(II) in the degradation process of 2,4-DCP. (The molar ratio of CaO2/EDTA–Fe(II)/2,4-DCP was kept at 16/4/1.) | ||
It can also be observed that the variation of iron ion concentration was in accordance with EDTA, which is because the dissociated iron ions with the decay of the chelating agent will soon react with OH− to form sediment and precipitate out from the solution. Although concentrations of both EDTA and iron ions were reduced by 20–30% at the end of the experiments, the concentration left in the MF system was still enough for catalytic reaction during the following experiment.
3.3 Effects of reaction parameters on 2,4-DCP removal performance
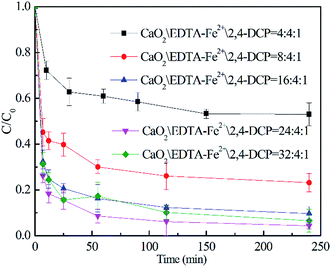 | ||
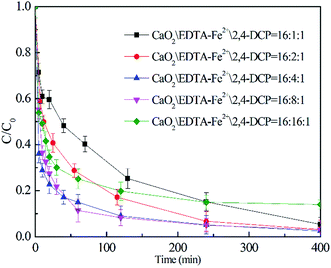
| Fig. 3 Effect of CaO2 dosage on 2,4-DCP degradation ([2,4-DCP]0 = 0.61 mM and the initial concentration of EDTA–Fe(II) was 2.45 mM). | ||
Therefore, the initial molar ratio of CaO2/2,4-DCP was chosen as 16/1 ([CaO2]0 = 10 mM) for the investigation discussed below.
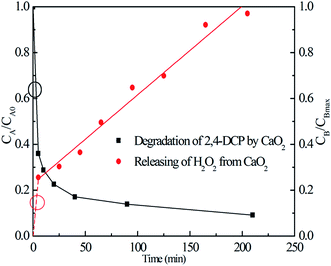
Then, we conducted a series of experiments with the addition of an equivalent amount of CaO2 and with no addition of 2,4-DCP to water to find out the relationship between the 2,4-DCP degradation process and release of H2O2 from CaO2 decomposition. Fig. 6 shows the H2O2 releasing process from CaO2 dissolution (see the red line) and the 2,4-DCP degradation performance (see the black line) by an equivalent amount of CaO2. In Fig. 6, CA/CA0 on the left vertical axis represents the relative concentration of 2,4-DCP, whereas CB/CBmax on the right is the H2O2 productivity. The results show that without the addition of 2,4-DCP, H2O2 can be generated gradually from CaO2 dissolution at a certain rate, regardless of the decreasing CaO2 content in solution (see the solid red line). It needs to be noted that a significant amount of H2O2 was produced instantaneously once CaO2 was added to the solution to initiate the experiment. Therefore, the H2O2 releasing process from CaO2 dissolution can be fitted approximately by a line disjointed to the zero point. Consequently, in the initial stage of the degradation reaction, the H2O2 concentration was relatively high to react with EDTA–Fe(II) and form HO˙, which can degrade 2,4-DCP at a higher rate. With the reaction going on, H2O2, which was released from CaO2 at a certain slow rate, was relatively “insufficient” for the following degradation process. Accordingly, the 2,4-DCP degradation in the Ca2O2/EDTA–Fe(II) system showed a moderate reaction rate because of the dissolution process of CaO2 particles.
3.4 Identification of predominant reactive oxygen species
 . CT, which is a highly oxidized compound, was used for identifying
  because of its high reactivity with reductants (k = 1.6 × 10¹⁰ M−1 s−1), but extremely low reactivity with hydroxyl radicals (kHO˙ < 2 × 10⁶ M−1 s−1).29
The generation of HO˙ in a CaO2-based Fenton system, measured by NB loss, is shown in Fig. 7. The NB removal efficiency was above 95% in 240 min of reaction time, proving that HO˙ was generated in the system. The presence of HO˙ demonstrated the ability of CaO2 to replace H2O2 to participate in the modified Fenton system. The removal efficiency of CT can reach 24% within 240 min of reaction time in the modified Fenton system, indicating the presence of  in the system. Previous studies28 have shown that
  is likely a transforming species in the modified Fenton's process and is probably formed in the processes represented by eqn (5) and (12):
 | (12) |
 (
( = 3 × 10¹⁰ M−1 s−1).29,31 Based on these properties, TBA was used to scavenge HO˙, whereas chloroform was selected as the
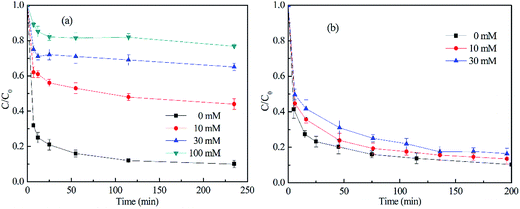
  scavenger. As shown in Fig. 8(a), the 2,4-DCP removal efficiency in 60 min of reaction time reached 83.8% in the absence of the scavenger. As TBA was added to the system from 0 mM to 30 mM and 100 mM, the 2,4-DCP removal efficiencies within 60 min decreased to 47.0% and 18.5%, respectively. The removal efficiency decreased dramatically with scavenging of HO˙. This demonstrates that HO˙ is the dominant reactive oxygen species responsible for 2,4-DCP degradation in the system.
The result of the  scavenging test with chloroform is shown in Fig. 8(b). As seen from it, the removal efficiency of 2,4-DCP within 200 min of reaction time was decreased from 90.2% to 84.5% and 82.3%, respectively, in the presence of chloroform from 0 to 3 mM, 10 mM, and 30 mM. It means that the degradation performance of 2,4-DCP shows a minor decrease with the scavenging of some
  . It can be deduced that
  was generated in the system, but its role of promoting the degradation of 2,4-DCP is limited. It is potentially because the
  was generated in the reaction steps, which were not essential to the degradation. The result agrees well with former studies.31
3.5 Degradation intermediates and reaction mechanism
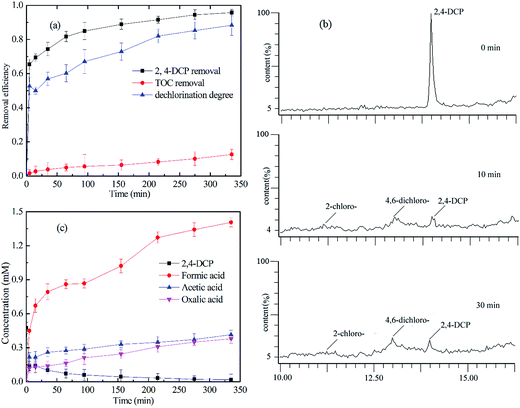
As chloride substituents on the benzene ring are responsible for the toxicity of aromatic compounds, the fate of chloride substituents must be given much more concern. As observed from Fig. 9(a), the initial concentration of 2,4-DCP was 77.4 mg L−1 and removal efficiency was 95.7%. The calculated dechlorination degree of 2,4-DCP reached 90%, showing that most of the chlorine on the aromatic ring was released and formed chloride ions. The mineralization degree of 2,4-DCP in this MF system was determined to investigate the oxidation efficiency of 2,4-DCP (as depicted in Fig. 9(a)). The initial concentration of EDTA was 711.2 mg L−1 and the initial concentration of TOC (including 2,4-DCP and EDTA) in the system was measured as 374.9 mg L−1. The final TOC at 300 min was tested as 327.7 mg L−1. Therefore, the calculated mineralization of 2,4-DCP in the oxidant system is 12.6%. This suggests that some of the intermediates derived from 2,4-DCP decomposition, such as carboxylic acids, remained in the solution.Through UPLC-MS/MS and IC analyses, the main intermediates were 2-chlorohydroquinone, 4,6-dichlororesorcinol, acetic acid, formic acid and oxalic acid (shown in Fig. 9(b) and (c)). The concentration of 2,4-DCP decreased quickly in the solution during the first 30 min and then decreased slowly till complete removal within 300 min. 2-Chlorohydroquinone and 6-dichlororesorcinol were generated quickly after the degradation reaction was initiated and began to disappear within 30 min. The acetic acid and formic acid were formed quickly during the first 30 min and then were generated slowly during the remaining reaction time. It should be noted that the total concentration of carboxylic acid was relatively high compared to that of the direct products from 2,4-DCP, which is ascribed to the degradation of a small amount of EDTA (shown in Fig. 2). Previous researchers have reported the degradation intermediates of monochlorophenol and phenol, but they were not detected in our system.39,40
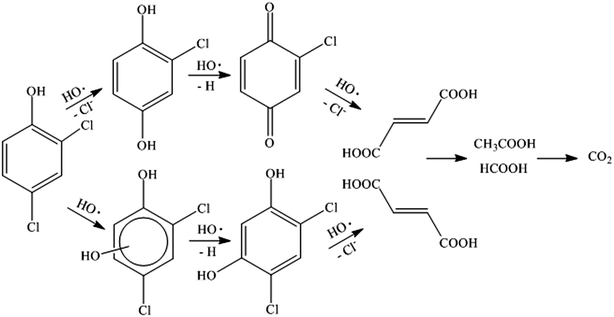
According to the results and the information reported in the literature,41–44 the degradation pathway was proposed and shown in Fig. 10. The chlorine atom located in the para-position on the aromatic ring of 2,4-DCP was apparently the preferred location for radical attack because of steric effects. Hence, 2,4-DCP was substituted by HO˙ and degraded to 2-chlorohydroquinone. This 2-chlorohydroquinone was subsequently dehydrogenated to give 2-chloro-1,4-benzoquinone with further attack of HO˙. Moreover, the mechanism also allows an electrophilic HO˙ group to be added onto the aromatic ring of the 2,4-DCP, forming hydroxylation intermediates such as 4,6-dichlororesorcinol. Further oxidation of chlorobenzoquinone and 4,6-dichlororesorcinol leads to dechlorination, followed by ring cleavage and formation of maleic and fumaric acids. These two acids were subsequently oxidized and transformed into acetic acid and formic acid remaining in solution eventually.
4 Conclusion
A CaO2-based modified Fenton system suitable for remediating contaminated groundwater was developed. Since H2O2 released from CaO2 is auto-regulated by the rate of CaO2 dissolution, this system can not only remove 2,4-DCP from aqueous solution with a moderate reaction rate, but also shows a high utilization efficiency of H2O2 by inhibiting disproportionation of H2O2 to form O2. Addition of EDTA can effectively maintain the dissolution of iron at neutral pH, thus increasing the degradation performance. However, some EDTA will be lost due to oxidation or precipitation. A type of complicated kinetics of 2,4-DCP degradation was observed in the CaO2-based modified Fenton system. EDTA–Fe(II) content, CaO2 dosage and pH value could clearly affect the degradation performance. According to the aromatic intermediates, carboxylic acids and chloride ions determined by UPLC-MS and IC, a possible degradation pathway based on HO˙ mechanism was proposed.Conflict of interest
The authors declare no competing financial interest.Acknowledgements
This study was financially supported by the National Natural Science Foundation of China (41572213). We are also thankful for the support provided by the Key Project of National Natural Science Foundation of China (41530636).References
- C. Walling, Fenton's reagent revisited, Acc. Chem. Res., 1975, 8, 125–131 CrossRef CAS.
- A. Romero, A. Santos and F. Vicente, J. Hazard. Mater., 2008, 162, 785–790 CrossRef PubMed.
- C. Walling and A. Goosen, J. Am. Chem. Soc., 1973, 95, 2987–2991 CrossRef CAS.
- B. H. Bielski, D. E. Cabelli, R. L. Arudi and A. B. Ross, J. Phys. Chem. Ref. Data, 1985, 14, 1041–1100 CrossRef CAS.
- A. S. Stasinakis, Global NEST J., 2008, 10, 376–385 Search PubMed.
- E. Chamarro, A. Marco and S. Esplugas, Water Res., 2001, 35, 1047–1051 CrossRef CAS PubMed.
- R. J. Watts, Biorem. J., 1992, 2, 413–425 Search PubMed.
- R. J. Watts and S. E. Dilly, J. Hazard. Mater., 1996, 51, 209–224 CrossRef CAS.
- R. J. Watts and A. L. Teel, J. Environ. Eng., 2005, 131, 612–622 CrossRef CAS.
- B. Francesco, E. Bernd, M. C. M. Gribnau and E. J. Baerends, Chemistry, 2003, 9, 3436–3444 CrossRef PubMed.
- R. J. Watts, M. K. Foget, S. H. Kong and A. L. Teel, J. Hazard. Mater., 1999, 69, 229–243 CrossRef CAS PubMed.
- P. Xu, G. Achari, M. Mahmoud and R. Joshi, Pract. Period. Hazard., Toxic, Radioact. Waste Manage., 2006, 10, 19–27 CrossRef CAS.
- G. Chen, G. E. Hoag, P. Chedda, F. Nadim, B. A. Woody and G. M. Dobbs, J. Hazard. Mater., 2001, 87, 171–186 CrossRef CAS PubMed.
- M. P. Granados, G. M. Salido, A. González and J. A. Pariente, Biochem. Cell Biol., 2006, 84, 39–48 CrossRef CAS PubMed.
- T. Schmidtke, D. White and C. Woolard, J. Hazard. Mater., 1999, 64, 157–165 CrossRef CAS PubMed.
- S. J. Liu, B. Jiang, G. Q. Huang and X. G. Li, Water Res., 2006, 40, 3401–3408 CrossRef CAS PubMed.
- D. P. Cassidy and R. L. Irvine, J. Hazard. Mater., 1999, 69, 25–39 CrossRef CAS PubMed.
- A. C. Air and C. Water, in US Environmental Protection Agency, Washington DC., 1999 Search PubMed.
- A. Northup and D. Cassidy, J. Hazard. Mater., 2008, 152, 1164–1170 CrossRef CAS PubMed.
- B. W. Bogan, V. Trbovic and J. R. Paterek, Chemosphere, 2003, 50, 15–21 CrossRef CAS PubMed.
- I. I. Vol'nov and A. W. Petrocelli, Peroxides, superoxides, and ozonides of alkali and alkaline earth metals, Plenum Press, New York, 1966 Search PubMed.
- H. F. Wang, Y. S. Zhao, T. Y. Li, Z. Chen, Y. Wang and C. Y. Qin, Chem. Eng. J., 2016, 303, 450–457 CrossRef CAS.
- M. Arienzo, Chemosphere, 2000, 40, 331–337 CrossRef CAS PubMed.
- A. Goi and M. Trapido, J. Adv. Oxid. Technol., 2010, 13, 50–58 CAS.
- A. C. Ndjou'ou and D. Cassidy, Chemosphere, 2006, 65, 1610–1615 CrossRef PubMed.
- X. Zhang, X. Gu, S. Lu, Z. Miao, M. Xu, X. Fu, Z. Qiu and Q. Sui, J. Hazard. Mater., 2015, 284, 253–260 CrossRef CAS PubMed.
- G. V. Buxton, C. L. Greenstock, W. P. Helman and A. B. Ross, J. Phys. Chem. Ref. Data, 1988, 17, 513–886 CrossRef CAS.
- C. Liang and H. W. Su, Ind. Eng. Chem. Res., 2009, 48, 5558–5562 CrossRef CAS.
- A. L. Teel and R. J. Watts, J. Hazard. Mater., 2002, 94, 179–189 CrossRef CAS PubMed.
- M. Xu, X. Gu, S. Lu, Z. Qiu and Q. Sui, Ind. Eng. Chem. Res., 2014, 53, 1056–1063 CrossRef CAS.
- N. Wang, L. Zhu, M. Lei, Y. She, M. Cao and H. Tang, ACS Catal., 2011, 1, 1193–1202 CrossRef CAS.
- X. Fu, X. Gu, S. Lu, M. Xu, Z. Miao and X. Zhang, et al., Chem. Eng. J., 2016, 285, 180–188 CrossRef CAS.
- E. Neyens and J. Baeyens, J. Hazard. Mater., 2003, 98, 33–50 CrossRef CAS PubMed.
- S. Fukuchi, R. Nishimoto, M. Fukushima and Q. Zhu, Appl. Catal., B, 2014, 147, 411–419 CrossRef CAS.
- M. Luo, D. Bowden and P. Brimblecombe, Appl. Catal., B, 2009, 85, 201–206 CrossRef CAS.
- T. R. Gordon and A. L. Marsh, Catal. Lett., 2009, 132, 349–354 CrossRef CAS.
- Z. Tao, Y. Li, J. Jing, F. S. Wong and X. Lu, Sep. Purif. Technol., 2008, 62, 551–558 CrossRef.
- L. Xu and J. Wang, Appl. Catal., B, 2012, 123, 117–126 CrossRef.
- H. Wang and J. Wang, Appl. Catal., B, 2009, 89, 111–117 CrossRef CAS.
- H. Wang and J. Wang, Electrochim. Acta, 2008, 53, 6402–6409 CrossRef CAS.
- W. Chu, C. Y. Kwan, K. H. Chan and S. K. Kam, J. Hazard. Mater., 2005, 121, 119–126 CrossRef CAS PubMed.
- E. Brillas, J. C. Calpe and J. Casado, Water Res., 2000, 34, 2253–2262 CrossRef CAS.
- C. Badellino, C. A. Rodrigues and R. Bertazzoli, J. Hazard. Mater., 2006, 137, 856–864 CrossRef CAS PubMed.
- C. Chen, P. Lei, H. Ji, W. Ma, J. Zhao, H. Hidaka and N. Serpone, Environ. Sci. Technol., 2004, 38, 329–337 CrossRef CAS PubMed.
| This journal is © The Royal Society of Chemistry 2017 |

