 Open Access Article
Creative Commons Attribution 3.0 Unported Licence
Impact of the synthesis parameters on the solid state properties and the CO oxidation performance of ceria nanoparticles
Maria Lykakia,
Eleni Pachatouridouab,
Eleni Iliopouloub,
Sónia A. C. Carabineiro c and
Michalis Konsolakis
 *a
*a
aSchool of Production Engineering and Management, Technical University of Crete, GR-73100 Chania, Crete, Greece. E-mail: mkonsol@science.tuc.gr; Web: http://www.tuc.gr/konsolakis.html Tel: +30 28210 37682
bChemical Process & Energy Resources Institute (CPERI), Centre for Research & Technology Hellas (CERTH), 6th km. Charilaou–Thermi Rd., P.O. Box 60361, GR-57001, Thessaloniki, Greece
cLaboratório de Catálise e Materiais (LCM), Laboratório Associado LSRE-LCM, Faculdade de Engenharia, Universidade do Porto, 4200-465 Porto, Portugal
First published on 18th January 2017
Abstract
Ceria-based materials have received considerable attention in catalysis field due to their unique physicochemical characteristics. Compared to bulk ceria, nanosized ceria received particular interest, due to its high surface to volume ratio, improved reducibility and optimal morphological features. Hence, the fine-tuning of ceria properties by means of advanced synthesis routes is of particular importance. In this regard, the present work aims at investigating the impact of synthesis parameters on the solid state properties of CeO2 materials. Four different time- and cost-effective preparation methods were followed, i.e. thermal decomposition, co-precipitation and hydrothermal method of low and high NaOH concentration, employing in all cases Ce(NO3)3·6H2O as cerium precursor. A complementary characterization study, involving N2 adsorption at −196 °C (BET method), X-ray diffraction (XRD), X-ray photoelectron spectroscopy (XPS), H2 temperature-programmed reduction (H2-TPR) and scanning/transmission electron microscopy (SEM/TEM), was carried out to gain insight into the impact of synthesis route on the textural, structural, morphological and redox properties. The results revealed the superiority of the hydrothermal method towards the development of ceria nanoparticles of high specific surface area (>90 m2 g−1), well-defined geometry (nanorods) and improved redox properties. CO oxidation was employed as a probe reaction to gain insight into the structure–activity correlation. Ceria nanorods prepared by hydrothermal method of high NaOH concentration demonstrated the optimum CO oxidation performance. A direct quantitative correlation between the catalytic activity and the abundance of easily reduced, loosely bound oxygen species, was revealed. Hence, this particular reactivity descriptor can potentially be used for the rational design of ceria-based materials.
Introduction
Cerium oxide (CeO2) or ceria has lately received considerable attention as catalyst or supporting carrier in numerous catalytic processes,1–3 involving among others the oxidation of CO, the reduction of NOx, water–gas shift reaction, reforming reactions and soot combustion, as well as in further applications like optics,4 biotechnology5 and so on. The wide application range of ceria-based materials is largely due to the unique properties of ceria, like high thermal stability, high oxygen storage capacity (OSC) and oxygen mobility.1–3,6–8 The facile switch between the two oxidation states (Ce3+/Ce4+) accompanied by the formation of surface defects, such as oxygen vacancies, is considered responsible for its enhanced redox properties.1–3,9–12Moreover, in the nanoscale, materials exhibit important features due to their quantum size effects. The surface area is substantially increased by decreasing particle size to the nanometer scale. These nanomaterials show abundance in defect sites such as oxygen vacancies and have more surface atoms than their bulk counterparts.1–3,13–16
Numerous methods have been employed for the synthesis of nano-sized ceria particles, such as hydrothermal,17,18 sonochemical,19 reverse micelles20 etc., while precipitation method is considered as one of the most widely employed methods due to its simplicity and low cost.
The preparation method affects enormously the morphological and surface characteristics of CeO2, leading to various geometries, such as nanorods, nanocubes, nanowires, etc.21,22 In addition, the variation of several parameters during the synthesis procedure (i.e., temperature and base concentration) can lead not only to different ceria morphologies with high shape purity, but also to structures with tunable surface areas and defect concentrations.23–26
For instance, Liu et al.27 synthesized CeO2 samples by precipitation, hydrothermal and citrate sol–gel methods. CeO2 prepared with hydrothermal method showed larger surface area, average pore diameter and pore volume.Makinose et al.28 fabricated ceria nanoparticles (NPs) with controlled crystal orientations via an oleate-modified hydtrothermal method; by altering the molar ratio of oleate to cerium ions in the reaction solution different ceria facetes were obtained.
CO oxidation reaction has been widely employed as a probe reaction to gain insight into the structure–activity correlations.6,10,12,21,26,29–31 It is generally believed that CO oxidation over ceria proceeds via a Mars-van Krevelen mechanism which involves the removal of surface lattice oxygen by CO and the consequent annihilation of oxygen vacancies by gas phase oxygen.30 Besides the importance of surface oxygen defects, the morphology and the crystallite size are also believed to affect the catalytic efficiency.21,26,29–31 Piumetti et al.21 have found that among a series of hydrothermally prepared ceria samples, ceria-nanocubes demonstrated the best CO oxidation performance. In a similar manner, the enhanced CO oxidation activity of ceria nanocubes, in comparison to conventional morphologies was verified by Vilé et al.31, and attributed to the different oxygen vacancy chemistry of exposed facets.
Theoretical32,33 and experimental30,31,34 studies have shown that anionic vacancies energy formation is strongly dependent on exposed facets, following the order {111} > {100} > {110}. Hence, particular attention has been devoted on the synthesis of ceria with a high number of active crystal planes. In this regard, Piumetti et al.35 showed that ceria nanocubes exhibited the best catalytic performance for the soot combustion due to the abundance of highly reactive {100} and {110} surfaces. Aneggi et al.34 also showed, by comparing ceria samples of similar surface area, that a higher soot oxidation activity can be obtained for nanocubes and nanorods as compared to polycrystalline samples.
Despite the numerous studies in the field there is still a lack of understanding in relation to the impact of surface (e.g., oxygen defects, exposed facets, surface area) and bulk (e.g., crystallite size) properties on the catalytic activity. The present work aims at comparatively explore the impact of various widely employed synthesis methods, i.e. precipitation, thermal decomposition and hydrothermal, on the solid state properties of ceria samples. Particular emphasis is given on the synthesis parameters in order the preparation methods to be cost-effective and not time-consuming. Various characterization techniques (BET, XRD, H2-TPR, SEM/TEM and XPS) were used in order to assess the impact of each preparation method on the structural, morphological and redox properties. Moreover, CO oxidation reaction was employed as probe reaction to gain insight into structure–activity correlation. Interestingly, a linear quantitative correlation between the CO oxidation activity and the amount of surface-capping oxygen of ceria is revealed. No particular correlation was found between the textural/structural characteristics and the catalytic performance.
Experimental
Materials synthesis
All of the chemicals used in this work were of analytical reagent grade. Ce(NO3)3·6H2O (purity ≥99.0%, Fluka) was used as precursor for the preparation of ceria materials. NH3 (25% v/v, EMSURE), NaOH (purity ≥98%, Sigma-Aldrich) and ethanol (purity 99.8%, ACROS) were also employed during synthesis procedure.Different nanostructured ceria composites were synthesized by various methods, namely: thermal decomposition, precipitation method, and hydrothermal method. For the preparation of ceria by thermal decomposition (CeO2-D) the Ce(NO3)3·6H2O precursor was heated at 500 °C for 2 h under air flow. Ceria by precipitation (CeO2-P) was prepared as follows: Ce(NO3)3·6H2O was initially dissolved in double deionized water (0.50 M) until complete dissolution of the precursor compound. Ammonia solution (25% v/v) was then added at room temperature to the continuously stirred solution until pH reached the value of 9–10, and kept stable for 3 h. The resulting solution was filtered under vacuum and a gel was formed. The precipitate was dried overnight at 110 °C for 12 h and calcined at 500 °C for 2 h under air flow (heating ramp 5 °C min−1).
Two ceria samples were prepared by the hydrothermal method employing low (CeO2-HL) and high (CeO2-HH) NaOH concentration. For the synthesis of CeO2-HL, 0.45 mol NaOH was initially dissolved in 75 mL of double deionized water. Then, 175 mL of aqueous solution containing 23 mmol Ce(NO3)3·6H2O (0.13 M) was added in the above solution under vigorous stirring until the formation of a milky slurry. The mixture was left for additional stirring for 1 h. The final slurry was then transferred into a 1 L Teflon bottle and aged at 90 °C for 24 h. Afterwards, the bottle was cooled to room temperature before the solid products were recovered by centrifugation. The materials were washed thoroughly with double deionized water until pH 7 to remove any co-precipitated salts and then washed with ethanol to avoid hard agglomeration in the nanoparticles. The precipitate was dried overnight at 90 °C for 12 h, followed by calcination at 500 °C for 2 h under air flow (heating ramp 5 °C min−1). To obtain the CeO2-HH sample, the same procedure was followed as above with only one variation: 2.75 mol NaOH instead of 0.45 mol was utilized.
Materials characterization
The textural characteristics of the as prepared catalysts were determined by the N2 adsorption–desorption isotherms at −196 °C (Nova 2200e Quantachrome flow apparatus). Specific surface areas (m2 g−1) were obtained according to the Brunauer–Emmett–Teller (BET) method at relative pressures in the 0.05–0.30 range. The specific pore volume (cm3 g−1) was calculated based on the highest relative pressure, whereas the average pore size diameter (dp, nm) was determined by the Barrett–Joyner–Halenda (BJH) method. Prior to measurements the samples were degassed at 250 °C for 5 h under vacuum.The crystalline structure of ceria sample was determined by powder X-ray diffraction (XRD) on a Siemens D 500 diffractometer operated at 40 kV and 30 mA with Cu Kα radiation (λ = 0.154 nm). Diffractograms were recorded in the 2–80° 2θ range and at a scanning rate of 0.02° s−1. The Scherrer eqn (1) was employed to determine the primary particle size of a given crystal phase based on the most intense diffraction peak of CeO2 patterns (2θ: 28.5° and 47.6°).
 | (1) |
Temperature Programmed Reduction (H2-TPR) experiments were carried out in a fully automated AMI-200 Catalyst Characterization Instrument (Altamira Instruments) under H2 atmosphere, to acquire information on the reducibility of the samples. In a typical TPR experiment, ∼50 mg of sample was placed in a U-shaped quartz tube, located inside an electrical furnace, and heated up to 1100 °C at 10 °C min−1 under He flow of 29 cm3 min−1 and H2 flow of 1.5 cm3 min−1. The H2 consumption was calculated by the integrated area of TPR peaks, calibrated against a known amount of CuO standard sample.37,38
Morphological characterization was carried out by scanning electron microscopy (SEM), using a FEI Quanta 400 FEG ESEM (15 keV) electron microscope. The sample powders were mounted on double sided adhesive tape and observed at different magnifications under two different detection modes: secondary and backscattered electrons. Energy-dispersive X-ray spectroscopy (EDS) confirmed the nature of the components.
Transmission electron microscopy (TEM) analyses were performed on a Leo 906 E apparatus, at 100 kV. Samples were prepared by ultrasonic dispersion in ethanol and placed on a copper grid for analysis.
X-ray photoelectron spectroscopy (XPS) analyses were performed on a VG Scientific ESCALAB 200A spectrometer using Al Kα radiation (1486.6 eV). The charge effect was corrected taking the C 1s peak as a reference (binding energy of 285 eV). CASAXPS software was used for data analysis.
Catalytic activity studies
Catalytic tests for CO oxidation were carried out in a quartz fixed-bed reactor (9 mm i.d.). The catalyst (400 mg) and a layer of quartz wool were filled in the reactor. The total flow rate of the feed gas (2000 ppm CO and 1 vol% O2 in He) was 500 cm3 min−1, corresponding to a Gas Hour Space Velocity (GHSV) of 39![[thin space (1/6-em)]](https://www.rsc.org/images/entities/char_2009.gif) 000 h−1. Catalytic evaluation measurements were carried out by increasing the temperature by 25-degree steps up to 500 °C. The reactant CO was analyzed by using an online CO analyzer (Horiba VIA-510). The CO conversion (XCO, %) was calculated by the following equation:
000 h−1. Catalytic evaluation measurements were carried out by increasing the temperature by 25-degree steps up to 500 °C. The reactant CO was analyzed by using an online CO analyzer (Horiba VIA-510). The CO conversion (XCO, %) was calculated by the following equation:
 | (2) |
Kinetic measurements were also carried out under differential conditions (at temperatures lower than ca. 300 °C) to gain insight into the intrinsic activity of ceria samples. The specific reaction rate of CO consumption (rCO, nmol m−2 s−1) was calculated using the eqn (3), whereas the Arrhenius plot was used to determine the activation energy (Ea, kJ mol−1) and the pre-exponential factor (A, nmol m−2 s−1).
 | (3) |
Results and discussion
Textural and structural characterization (BET, XRD)
The main textural properties of ceria materials (BET surface area, total pore volume, average pore size diameter) are presented in Table 1. The average grain size, DBET, was also calculated using the following eqn (4), on the assumption of the particle sphericity.
 | (4) |
| Sample | BET surface area (m2 g−1) | Pore volume (cm3 g−1) | Average pore size (nm) | Average grain size, DBETa (nm) | Average crystallite diameter, DXRDb (nm) | ψ (DBET/DXRD) |
|---|---|---|---|---|---|---|
| a Calculated applying eqn (4).b Calculated applying Scherrer eqn (1). | ||||||
| CeO2-P | 53.2 | 0.087 | 6.6 | 15.6 | 15.2 | 1.03 |
| CeO2-D | 87.2 | 0.25 | 11.6 | 9.5 | 9.3 | 1.02 |
| CeO2-HH | 91.8 | 0.71 | 30.9 | 9.1 | 13.2 | 0.69 |
| CeO2-HL | 109.4 | 1.04 | 38.1 | 7.6 | 9.5 | 0.80 |
It is evident that the ceria samples prepared by the hydrothermal method exhibit the optimum textural characteristics followed by thermal decomposition and precipitation. In particular, the sample prepared by the hydrothermal method of low NaOH concentration (CeO2-HL) possesses the highest BET area (109.4 m2 g−1), followed by CeO2-HH (91.8 m2 g−1), CeO2-D (87.2 m2 g−1) and CeO2-P (53.2 m2 g−1). These findings clearly revealed the pronounced impact of hydrothermal synthesis on the textural characteristics, as will be further discussed in the sequence.
The results of BET surface area as a function of average grain size (nm) for the different ceria samples are depicted in Fig. 1. It is evident that the BET surface area is inverse function of average grain size, implying that the surface area of ceria samples increase with decreasing grain size.40
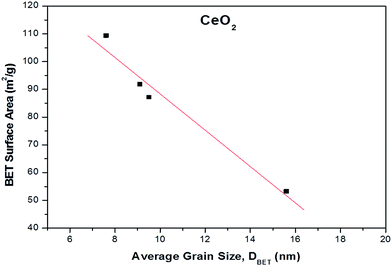 | ||
| Fig. 1 BET surface area (m2 g−1) as a function of average grain size (nm) for the different CeO2 samples. | ||
To gain insight into the agglomeration extent of the primary crystallites, the factor ψ = DBET/DXRD was also calculated (Table 1).41 Ceria samples prepared by precipitation and thermal decomposition (CeO2-P and CeO2-D, respectively) exhibit a similar ψ value of ca. 1.0, implying no degree of aggregation. However, the crystallite size is larger than DBET for CeO2-HH and CeO2-HL, resulting in ψ values lower than 1.0 (0.69 and 0.80, respectively). The latter indicates non-spherical particles with a small degree of aggregation.42 Therefore, the assumption of the particle sphericity for the calculation of DBET may not apply to the samples prepared by the hydrothermal method. This finding is in accordance with the TEM analysis (vide infra), which indicates the formation of NPs of specific shape (e.g., nanorods) in CeO2 samples prepared by the hydrothermal method.
Fig. 2a shows the pore size distribution (PSD) of as-prepared samples. A maxima at pore diameters higher than 3 nm is obtained in all cases, implying the presence of mesopores.43 The CeO2-HL sample possesses the highest average pore size (38.1 nm), followed by CeO2-HH (30.9 nm), CeO2-D (11.6 nm) and CeO2-P (6.6 nm). The highest pore volume is observed at 8.14, 3.52, 7.70 and 25.9 nm for CeO2-D, CeO2-P, CeO2-HL and CeO2-HH, respectively. Moreover, the hydrothermally prepared samples display a broader PSD as compared to CeO2-D and CeO2-P samples.
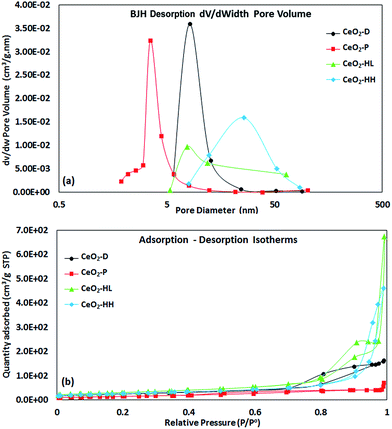 | ||
| Fig. 2 BJH desorption pore size distribution (a) and adsorption–desorption isotherms (b) of as-prepared CeO2 samples. | ||
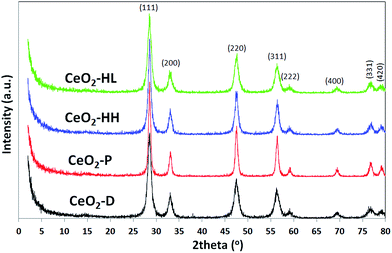
The XRD patterns of the ceria samples are presented in Fig. 3. All samples exhibit similar patterns. The main peaks can be indexed to (111), (200), (220), (311), (222), (400), (331) and (420) planes of a face-centered cubic fluorite structure of ceria (Fm3m symmetry, no. 225).44 It is obvious that the samples CeO2-HL and CeO2-D have broader peaks than the other two samples, indicating a smaller crystallite size, DXRD16 (Table 1).
Redox properties (H2-TPR)
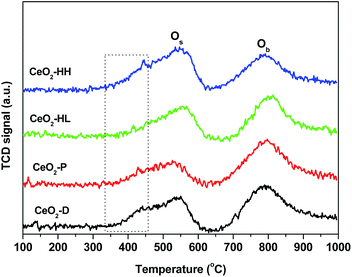
TPR experiments were also carried out to investigate the impact of the preparation method on the redox properties of ceria samples. Fig. 4 presents the reduction profiles of the CeO2 samples, which consist of two broad peaks centred at ca. 550 °C and 800 °C. They have been ascribed to the reduction of surface oxygen (Os) and bulk oxygen (Ob) of ceria, respectively.16,31,34,38,45 The H2 consumption which corresponds to surface oxygen and bulk oxygen reduction is presented in Table 2. Notably, the ratio of Os/Ob is affected by the preparation method, being higher for the samples prepared by the hydrothermal method. In particular, the following order, in terms of Os/Ob ratio, is obtained: CeO2-P (0.56) < CeO2-D (0.72) < CeO2-HL (0.94) < CeO2-HH (1.13).| Sample | H2 consumption (mmol H2 per g) | Os/Ob ratio | ||
|---|---|---|---|---|
| Os peak | Ob peak | Total | ||
| CeO2-P | 0.39 | 0.69 | 1.08 | 0.56 |
| CeO2-D | 0.50 | 0.69 | 1.19 | 0.72 |
| CeO2-HL | 0.48 | 0.51 | 0.99 | 0.94 |
| CeO2-HH | 0.59 | 0.52 | 1.11 | 1.13 |
A closer inspection of the reduction profiles shows that the low temperature feature, attributed to surface oxygen reduction, consists of a main reduction peak at ca. 550 °C and a shoulder at ca. 440 °C, the latter being more evident for CeO2-HH and CeO2-D samples. However, the temperature of maximum H2 consumption (Tmax) is strongly dependent on exposed facets, being lower on {100} and {110} surfaces;34,46 this probably indicates a higher contribution of these particular facets on CeO2-HH and CeO2-D samples. The latter is in agreement with the TEM analysis (Fig. 7), which implies the formation of nanorods over ceria-HH sample and in a lesser extent over CeO2-D. In a similar manner, a decrease in the Tmax by more than 100 °C has been observed with nanoshaped (nanocubes/nanorods) compared to polycrystalline conventional ceria.34 Moreover, it should be noted that the size of CeO2 NPs strongly affects the surface reduction, being facilitated at smaller sizes.38 In view of the above aspects, the variation of surface-to-bulk oxygen, both in quantitative and qualitative terms (Fig. 4, Table 2), can be attributed to the different exposed facets as well as to the different size of ceria NPs.
The present findings unambiguously revealed the pronounced impact of hydrothermal synthesis on the reduction of surface-capping oxygen of ceria. The sample prepared by the hydrothermal method of high NaOH concentration (CeO2-HH) shows the highest Os/Ob ratio, which is related to its improved reducibility and high oxygen mobility.47
Surface analysis (XPS)
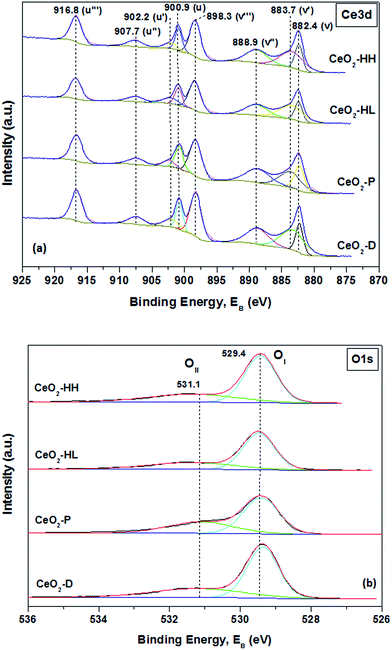
Information about the different elements existing on the surface and their oxidation state are next obtained by X-ray photoelectron spectroscopy. High resolution spectra of Ce 3d and O 1s photoelectrons were obtained (Fig. 5a and b). The Ce 3d spectra are analyzed into eight components which correspond to four pairs of spin–orbit doublets (Fig. 5a).The Ce 3d3/2 and Ce 3d5/2 spin–orbit components are labelled as u and v, respectively. The peaks labelled as v (882.4 eV), v′′ (888.9 eV) and v′′′ (898.3 eV) correspond to 3d5/2 level of Ce4+, while the peaks labelled as u (900.9 eV), u′′ (907.7 eV) and u′′′ (916.8 eV) are assigned to 3d3/2 level of Ce4+.46 The v and v′′ peaks are assigned to a mixing of Ce 3d94f2 O 2p4 and Ce 3d94f1 O 2p5 of Ce4+ states and the v′′′ peak corresponds to the Ce 3d94f0 O 2p6 of Ce4+ final state.48 The peaks tagged as v′ (883.7 eV) and u′ (902.2 eV) correspond to one of the two possible electron configurations of the final state of Ce3+ species. The ratio of the area for Ce3+ peaks to the whole peak area in Ce 3d region can lead to the relative amount of Ce3+.49 Table 3 shows that all samples have a similar amount of Ce3+, which varies between 24.3 and 26.5%. These findings are in accordance with relative literature studies,21,25 where it was found that very similar Ce 3d spectra profiles can be obtained between ceria samples of different morphology, despite the quite different amount of defect sites in the subsurface/bulk of ceria. In any case, no definitive conclusions in relation to the contribution of Ce3+ on the different reducibility of the present samples can be revealed. In complete agreement, it was found that the concentration of Ce3+ species is almost the same among ceria NPs of different particle size, despite their extremely different redox characteristics.38
| Sample | OI (%) | OII (%) | OI/OII | Ce3+ (%) |
|---|---|---|---|---|
| CeO2-P | 63.1 | 36.9 | 1.71 | 26.5 |
| CeO2-D | 66.4 | 33.6 | 1.97 | 26.4 |
| CeO2-HL | 67.1 | 32.9 | 2.04 | 25.3 |
| CeO2-HH | 68.1 | 31.9 | 2.13 | 24.3 |
The corresponding O 1s spectra are illustrated in Fig. 5b. Curve-fitting reveals the presence of two peaks. The low binding energy peaks centred at 529.4 eV (OI) are assigned to lattice oxygen while the peaks at 531.1 eV (OII) are attributed to surface adsorbed oxygen species, hydroxyl/carbonate groups and oxygen vacancies.49–52 The relative population of OI and OII along with their ratio (OI/OII) are included in Table 3. The CeO2-HH sample exhibits the highest ratio (2.13), followed by CeO2-HL (2.04), CeO2-D (1.97) and CeO2-P (1.71). Similar results in relation to the abundance of oxygen lattice (OI) species on hydrothermally prepared ceria polymorphs have been recently reported.53
These findings in conjunction to the TPR results (vide supra) clearly demonstrated that CeO2-HH sample have the highest population of loosely bound oxygen species, offering an improved reducibility and oxygen mobility. The latter is expected to notably affect the redox type mechanism involved in CO oxidation (vide infra).
Morphological characterization (SEM/TEM)
The SEM images of the ceria samples prepared by different methods are depicted in Fig. 6. Apparently, the samples exhibit different morphologies. CeO2-D (Fig. 6a and b) shows different structures: large smooth flat surfaces along with smaller agglomerated particles (Fig. 6a). In some areas, the flat surfaces show some cracks, which resemble “star” forms (Fig. 6b). Nevertheless, EDS (not shown) performed in the different zones marked as Z1 and Z2 in Fig. 6a, showed that the composition is similar in all regions, including in Fig. 6b, that is, cerium oxide. CeO2-P is shown in Fig. 6c and d and again different areas are seen, namely more “solid rocks” together with fragmented material. The sample prepared by the hydrothermal method employing high concentration of NaOH (Fig. 6g and h) implies the existence of a rod-like morphology whereas the hydrothermally prepared sample of low NaOH concentration (Fig. 6e and f) exhibits slight agglomeration of the NPs.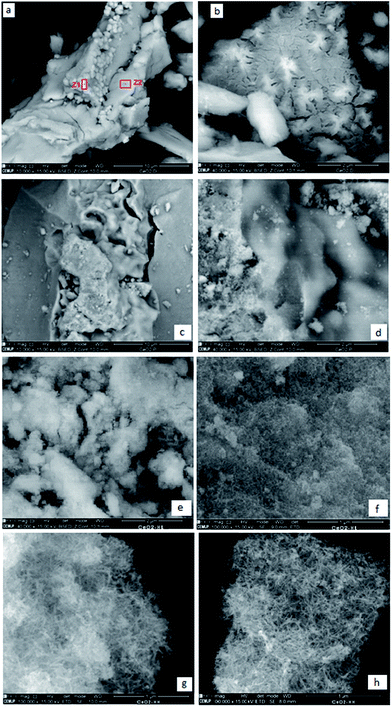 | ||
| Fig. 6 SEM images of the samples: (a) and (b) CeO2-D, (c) and (d) CeO2-P, (e) and (f) CeO2-HL, (g) and (h) CeO2-HH. | ||
To clearly gain insight into the impact of preparation procedure on the morphological characteristics of ceria NPs, transmission electron microscopy (TEM) studies were also carried out. Fig. 7 depicts representative images of the ceria samples. CeO2-D (Fig. 7a and b) shows some needle like features with sizes up to 150 nm, and some smaller particles. CeO2-P is shown in Fig. 7c and d and some spherical/polyhedral forms can be visualized ranging from 10–50 nm. The hydrothermally prepared sample of low NaOH concentration (Fig. 7e and f) exhibits mostly nanopolyhedra of irregular shapes, along with some nanorods. The sample prepared by the hydrothermal method employing high concentration of NaOH (Fig. 7g and h) shows the existence of a rod-like morphology, confirming the SEM results. The rods length varies from 25–200 nm.
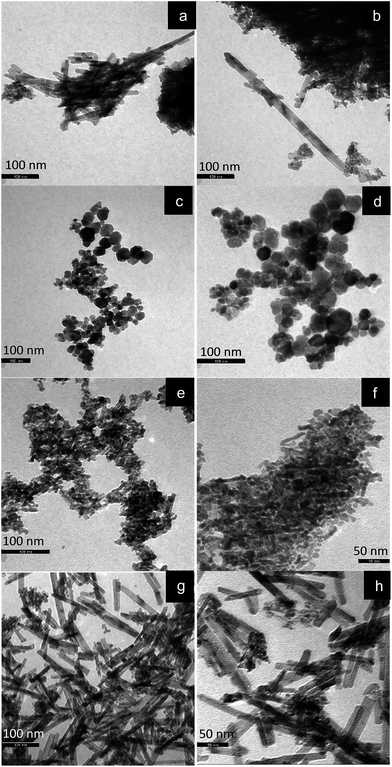 | ||
| Fig. 7 TEM images of the samples: (a) and (b) CeO2-D, (c) and (d) CeO2-P, (e) and (f) CeO2-HL, (g) and (h) CeO2-HH. | ||
Catalytic evaluation studies
The CO oxidation reaction was employed as a model reaction to gain insight into the extent of which the different synthesis method, and in turn the different physicochemical characteristics (surface area, crystallite size, reducibility, surface oxygen, exposed facets), can affect the catalytic performance. Fig. 8a depicts the CO conversion as a function of temperature of the as-synthesized ceria samples. For comparison purposes, a commercial CeO2 sample (Fluka) was employed as reference material. The superiority of the as-prepared samples as compared to the commercial one is evident. Moreover, the sample prepared by the hydrothermal method of high NaOH concentration (CeO2-HH) demonstrated the optimum performance. In particular, the following oxidation performance, in terms of half-conversion temperature (T50), was obtained: CeO2-HH (320 °C) < CeO2-HL (350 °C) < CeO2-D (360 °C) < CeO2-P (370 °C) < CeO2-comm (460 °C).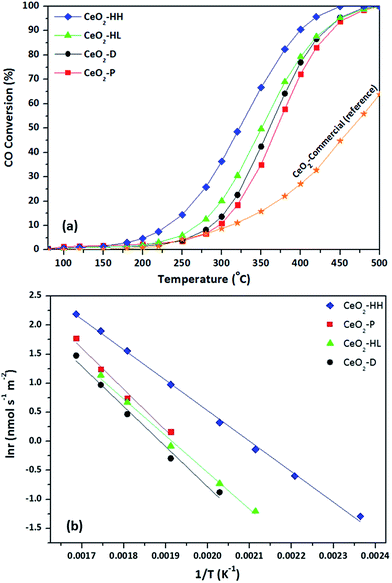 | ||
| Fig. 8 CO conversion as a function of temperature (a) and the corresponding Arrhenius plots (b) for CeO2 samples. | ||
The impact of synthesis procedure on the intrinsic reactivity can be more accurately obtained by the Arrhenius plots, in the kinetic regime (Fig. 8b). To take into account the differences in the BET surface area, the surface-normalized reaction rate (nmol m−2 s−1) instead of CO conversion was employed. Table 4 summarizes the apparent activation energies (Ea) and the corresponding pre-exponential factors (A) for the ceria samples. The significant effect of synthesis method on the CO oxidation activity on the whole temperature range investigated is evident. The superiority of CeO2-HH is again obvious, showing a specific reaction rate of about one order of magnitude higher, compared to other samples. Moreover, the calculated Ea for the CeO2-HH sample is 43.7 kJ mol−1, which is the lowest amongst the samples. In specific, the following order, in terms of Ea, was observed: CeO2-HH (43.7 kJ mol−1) < CeO2-HL (53.8 kJ mol−1) < CeO2-D (57.5 kJ mol−1) < CeO2-P (58.8 kJ mol−1), which is perfectly matched to conversion performance (Fig. 8a).
| Sample | Activation energy, Ea (kJ mol−1) | Pre-exponential factor, A (nmol s−1 m−2) |
|---|---|---|
| CeO2-P | 58.8 | 8.3 × 10⁵ |
| CeO2-D | 57.5 | 4.6 × 10⁵ |
| CeO2-HL | 53.8 | 2.5 × 10⁵ |
| CeO2-HH | 43.7 | 6.2 × 10⁴ |
Based on the above, it can be stated that ceria NPs prepared by the hydrothermal method of high NaOH concentration (CeO2-HH) showed the best catalytic performance for CO oxidation reaction, among all samples prepared in the present work. These findings can be interpreted on the basis of the well-established Mars-van Krevelen mechanism, in which ceria is reduced by CO and oxidized by gas phase oxygen through a redox cycle.
The main steps of this procedure are: (i) adsorption of CO on the ceria surface, (ii) reaction of the adsorbed CO with the lattice oxygen and formation of reaction intermediates, (iii) desorption of these intermediates and production of CO2 and oxygen vacancies, (iv) replenishment of the oxygen vacancies by activating the gas phase oxygen on the catalyst.30,48
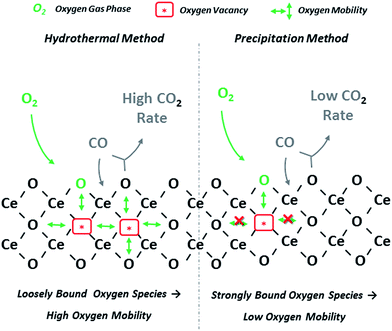
Since the above mechanistic steps exhibit a clear redox character, a strong dependence of CO oxidation performance from the redox properties of catalyst surface is expected. Indeed, the highly active CeO2-HH sample demonstrated the highest population of loosely bound, easily reduced, surface oxygen species, resulting in the highest surface-to-bulk (Os/Ob) oxygen species abundance (Table 2).
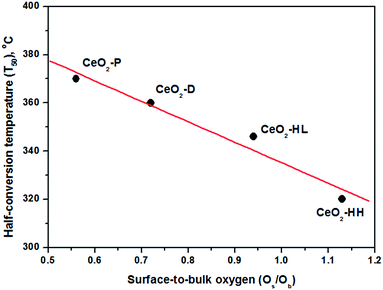
In view of this fact, a perfect trend between the half-conversion temperature (T50) and the Os/Ob ratio was revealed (Fig. 9), justifying the above argument. It is also of worth mentioning that although the CO oxidation performance was in general favoured by the surface area (Table 1), it seems not to be the decisive factor governing the CO oxidation activity. For instance, the CeO2-HL sample possesses the highest surface area (109.4 m2 g−1), without, however, offering the best catalytic performance.
In summary, it can be inferred that the hydrothermal method of high NaOH concentration can result to the formation of CeO2 NPs with rod-like morphology, with enhanced reducibility and surface oxygen exchange kinetics, and in turn CO oxidation activity.30 The latter is schematically illustrated in Fig. 10, which depicts the impact of synthesis parameters on the solid state properties and consequently on the CO oxidation performance of ceria NPs, on the basis of the above described Mars-van Krevelen reaction model. The high concentration of loosely bound oxygen species on ceria nanorods, related to oxygen mobility and vacancies formation, can be accounted for the superior performance of the ceria-HH sample.
Hence, the Os/Ob ratio, defined in the present work, can be considered as a reliable descriptor for the CO oxidation performance of ceria NPs. In view of this fact, in a comprehensive study by M. Capdevila-Cortada et al.,46 exploring the reactivity descriptors for ceria-based materials, the surface reduction (Ered) and oxygen basicity (O2p)-linked to vacancy formation energy and the number of adsorption sites-can be considered as the most important reactivity descriptor. Hence, the CO oxidation rate is expected to follow the order r110 > r100 > r111, in agreement with the vacancy formation energy.46
In light of the above, it has been clearly revealed, both theoretically32,33 and experimentally30,31,34 that anionic vacancies formation is strongly dependent on exposed facets of ceria, being lower on rod-like formations, where the {110} and {100} planes are prevailing. In a similar manner, the improved low temperature CO oxidation performance of various transition metals supported on CeO2-nanorods has been ascribed to the pronounced effect of ceria nanorods towards the formation of oxygen vacancies and CO adsorption sites.10 The key role of redox properties, and in particular of loosely bound oxygen species, on the CO oxidation performance was recently verified by Reddy and co-workers in a series of doped ceria samples.48 A direct correlation between the lattice oxygen binding energy and the activity was revealed, implying that oxygen species migration from bulk to surface may determine the overall process. It should be noted, however, that no similar correlation has been observed in the present work; the lattice oxygen binding energy of bare ceria samples is not strongly affected by the preparation method (Fig. 5). Instead of that, a direct correlation between the catalytic performance and the abundance of easily reduced (weakly bound) oxygen species is observed (Fig. 9).
Taking into account the superior reducibility of CeO2-HH sample, it would be of particular importance to explore the solid state properties and the catalytic performance of binary metal/CeO2-HH composites. The enhanced redox properties of ceria carrier are expected to notably affect the extent of metal-support interactions15,54,55 and in turn the catalytic activity.
Conclusions
The impact of synthesis parameters on the solid state properties of CeO2 materials was investigated. CeO2 prepared by hydrothermal method of high NaOH concentration (CeO2-HH) demonstrated the optimum CO oxidation performance, with the lowest Ea (43.7 kJ mol−1) amongst the other ceria samples prepared by precipitation, decomposition and hydrothermal with low NaOH concentration. Interestingly, the CO conversion performance of CeO2-HH sample outperforms notably that of commercial sample, lowering by ca. 150 °C the half-conversion temperature (T50). A direct quantitative correlation between the catalytic performance and the abundance of weakly bound (easily reduced) oxygen species was revealed. The rod-like morphology of CeO2-HH nanoparticles, with well-defined {100} and {110} reactive planes, favours the enhanced reducibility and lattice oxygen mobility, rendering this material appropriate as catalyst or supporting carrier.Acknowledgements
SACC thanks Fundação para a Ciência e Tecnologia (FCT) for financial support through Investigador FCT program (IF/01381/2013/CP1160/CT0007), with financing from the European Social Fund and the Human Potential Operational Program. This work was financially supported by Project POCI-01-0145-FEDER-006984 – Associate Laboratory LSRE-LCM funded by FEDER through COMPETE2020 – Programa Operacional Competitividade e Internacionalização (POCI) – and by national funds through FCT. MK is thankful for the Greece–Portugal Bilateral Educational Programme. Authors are thankful to Dr Carlos M. Sá (CEMUP) for assistance with XPS and SEM analyses and to Dr Pedro Tavares and Dr Lisete Fernandes (UME/CQVR/UTAD) for assistance with the TEM analyses.References
- T. Montini, M. Melchionna, M. Monai and P. Fornasiero, Chem. Rev., 2016, 116, 5987–6041 CrossRef CAS PubMed.
- W.-X. Tang and P.-X. Gao, MRS Commun., 2016, 6, 311–329 CrossRef CAS.
- D. Zhang, X. Du, L. Shi and R. Gao, Dalton Trans., 2012, 41, 14455–14475 RSC.
- Z. L. Wang, G. R. Li, Y. N. Ou, Z. P. Feng, D. L. Qu and Y. X. Tong, J. Phys. Chem. C, 2011, 115, 351–356 CAS.
- Z. X. Ji, X. Wang, H. Y. Zhang, S. J. Lin, H. Meng, B. B. Sun, S. George, T. Xia, A. E. Nel and J. I. Zink, ACS Nano, 2012, 6, 5366–5380 CrossRef CAS PubMed.
- Y. Kang, M. Sun and A. Li, Catal. Lett., 2012, 142, 1498–1504 CrossRef CAS.
- J. Han, H. J. Kim, S. Yoon and H. Lee, J. Mol. Catal. A: Chem., 2011, 335, 82–88 CrossRef CAS.
- M. Nolan, in Catalysis by materials with well-defined structures, ed. Z. Wu and S. H. Overbury, Elsevier Science, USA, 2015, ch. 6, pp. 159–192 Search PubMed.
- M. Melchionna and P. Fornasiero, Mater. Today, 2014, 17(7), 349–357 CrossRef CAS.
- S. A. Mock, S. E. Sharp, T. R. Stoner, M. J. Radetic, E. T. Zell and R. Wang, J. Colloid Interface Sci., 2016, 466, 261–267 CrossRef CAS PubMed.
- S. W. Yu, H. H. Huang, C. W. Tang and C. B. Wang, Int. J. Hydrogen Energy, 2014, 39(35), 20700–20711 CrossRef CAS.
- L. Soler, A. Casanovas, A. Urrich, I. Angurell and J. Llorca, Appl. Catal., B, 2016, 197, 47–55 CrossRef CAS.
- M. Piumetti, S. Bensaid, N. Russon and D. Fino, Appl. Catal., B, 2015, 165, 742–751 CrossRef CAS.
- C. P. Vinod, Catal. Today, 2010, 154(1–2), 113–117 CrossRef CAS.
- M. Konsolakis, Appl. Catal., B, 2016, 198, 49–66 CrossRef CAS.
- J. Liu, Z. Zhao, J. Wang, C. Xu, A. Duan, G. Jiang and Q. Yang, Appl. Catal., B, 2008, 84(1–2), 185–195 CrossRef CAS.
- A. I. Y. Tok, F. Y. C. Boey, Z. Dong and X. L. Sun, J. Mater. Process. Technol., 2007, 190(1–3), 217–222 CrossRef CAS.
- I. Ilgaz Soykal, H. Sohn, J. T. Miller and U. S. Ozkan, Top. Catal., 2014, 57(6–9), 785–795 CrossRef CAS.
- L. Yin, Y. Wang, G. Pang, Y. Koltypin and A. Gedanken, J. Colloid Interface Sci., 2002, 246(1), 78–84 CrossRef CAS PubMed.
- F. Gu, Z. Wang, D. Han, C. Shi and G. Guo, Mater. Sci. Eng., B, 2007, 139(1), 62–68 CrossRef CAS.
- M. Piumetti, T. Andana, S. Bensaid, N. Russo, D. Fino and R. Pirone, Nanoscale Res. Lett., 2016, 11, 165 CrossRef PubMed.
- X. Lu, D. Zheng, J. Gan, Z. Liu, C. Liang, P. Liu and Y. Tong, J. Mater. Chem., 2010, 20, 7118–7122 RSC.
- M. Kovacevic, B. L. Mojet, J. G. Van Ommen and L. Lefferts, Catal. Lett., 2016, 146(4), 770–777 CrossRef CAS.
- J. M. López, A. L. Gilbank, T. García, B. Solsona, S. Agouram and L. Torrente-Murciano, Appl. Catal., B, 2015, 174–175, 403–412 CrossRef.
- Z. Wu, M. Li, J. Howe, H. M. Meyer III and S. H. Overbury, Langmuir, 2010, 26(21), 16595–16606 CrossRef CAS PubMed.
- H. He, P. Yang, J. Li, R. Shi, L. Chen, A. Zhang and Y. Zhu, Ceram. Int., 2016, 42(6), 7810–7818 CrossRef CAS.
- J. Liu, Y. Li, J. Zhang and D. He, Appl. Catal., A, 2016, 513, 9–18 CrossRef CAS.
- Y. Makinose, T. Taniguchi, K. I. Katsumata, K. Okada and N. Matsushita, Adv. Powder Technol., 2016, 27(1), 64–71 CrossRef CAS.
- R. Rao, M. Yang, C. Li, H. Dong, S. Fang and A. Zhang, J. Mater. Chem. A, 2015, 3, 782–788 CAS.
- Z. Wu, M. Li and S. H. Overbury, J. Catal., 2012, 285, 61–73 CrossRef CAS.
- G. Vilé, S. Colussi, F. Krumeich, A. Trovarelli and J. Pérez-Ramírez, Angew. Chem., Int. Ed., 2014, 53, 12069–12072 CrossRef PubMed.
- M. Nolan, S. C. Parker and G. W. Watson, Surf. Sci., 2005, 595(1–3), 223–232 CrossRef CAS.
- M. Nolan, J. E. Fearon and G. W. Watson, Solid State Ionics, 2006, 177(35–36), 3069–3074 CrossRef CAS.
- E. Aneggi, D. Wiater, C. De Leitenburg, J. Llorca and A. Trovarelli, ACS Catal., 2014, 4, 172–181 CrossRef CAS.
- M. Piumetti, B. van der Linden, M. Makkee, P. Miceli, D. Fino, N. Russo and S. Bensaid, Appl. Catal., B, 2016, 199, 96–107 CrossRef CAS.
- S. Saitzek, J.-F. Blach, S. Villain and J.-R. Gavarri, Phys. Status Solidi A, 2008, 205(7), 1534–1539 CrossRef CAS.
- R. Barthos, A. Hegyessy, S. Klébert and J. Valyon, Microporous Mesoporous Mater., 2015, 207, 1–8 CrossRef CAS.
- J. Xu, J. Harmer, G. Li, T. Chapman, P. Collier, S. Longworth and S. C. Tsang, Chem. Commun., 2010, 46, 1887–1889 RSC.
- R. Dziembaj, M. M. Zaitz, M. Rutkowska, M. Molenda and L. Chmielarz, Catal. Today, 2012, 191(1), 121–124 CrossRef CAS.
- L. M. Walter and J. W. Morse, J. Sediment. Res., 1984, 54(4), 1081–1090 CAS.
- Y.-P. Fu, S.-B. Wen and C.-H. Lu, Progress in Nanotechnology: Applications, The American Ceramics Society, John Wiley & Sons, 2010, pp. 197–203 Search PubMed.
- A. Teleki, R. Wengeler, L. Wengeler, H. Nirschl and S. E. Pratsinis, Powder Technol., 2008, 181(3), 292–300 CrossRef CAS.
- A. B. Noor, M. Asri and B. Mohd, J. Phys. Sci., 2008, 19(2), 93–104 Search PubMed.
- M. Farahmandjou and M. Zarinkamar, Journal of Ultrafine Grained and Nanostructured Materials, 2015, 48(1), 5–10 Search PubMed.
- J.-Y. Luo, M. Meng, X. Li, X.-G. Li, Y.-Q. Zha, T.-D. Hu, Y.-N. Xie and J. Zhang, J. Catal., 2008, 254(2), 310–324 CrossRef CAS.
- M. Capdevila-Cortada, G. Vilé, D. Teschner, J. Pérez-Ramírez and N. López, Appl. Catal., B, 2016, 197, 299–312 CrossRef CAS.
- Z. Hu, X. Liu, D. Meng, Y. Guo, Y. Guo and G. Lu, ACS Catal., 2016, 6(4), 2265–2279 CrossRef CAS.
- D. Mukherjee, B. G. Rao and B. M. Reddy, Appl. Catal., B, 2016, 197, 105–115 CrossRef CAS.
- H. Jin, R. You, S. Zhou, K. Ma, M. Meng, L. Zheng, J. Zhang and T. Hu, Int. J. Hydrogen Energy, 2015, 40(10), 3919–3931 CrossRef CAS.
- M. Konsolakis, Z. Ioakimidis, T. Kraia and G. Marnellos, Catalysts, 2016, 6(3), 39 CrossRef.
- S. A. C. Carabineiro, M. Konsolakis, G. E. N. Marnellos, M. F. Asad, O. S. G. P. Soares, P. B. Tavares, M. F. R. Pereira, J. J. De Melo Órfão and J. L. Figueiredo, Molecules, 2016, 21, 644 CrossRef PubMed.
- L. Soler, A. Casanovas, C. Escudero, V. Pérez-Dieste, E. Aneggi, A. Trovarelli and J. Llorca, ChemCatChem, 2016, 8, 1–5 CrossRef.
- G. Li, B. Wu and L. Li, J. Mol. Catal. A: Chem., 2016, 424, 304–310 CrossRef CAS.
- G. N. Vayssilov, Y. Lykhach, A. Migani, T. Staudt, G. P. Petrova, N. Tsud, T. Skála, A. Bruix, F. Illas, K. C. Prince, V. Matolín, K. M. Neyman and J. Libuda, Nat. Mater., 2011, 10, 310–315 CrossRef CAS PubMed.
- D. R. Mullins and K. Z. Zhang, Surf. Sci., 2002, 513, 163–173 CrossRef CAS.
| This journal is © The Royal Society of Chemistry 2017 |

