 Open Access Article
Creative Commons Attribution 3.0 Unported Licence
Biocompatible CdSe/ZnS quantum dot micelles for long-term cell imaging without alteration to the native structure of the blood plasma protein human serum albumin†
Shanmugavel Chinnathambi a,
Norhidayah Abu
 b and
Nobutaka Hanagata
 *ac
*ac
aNanotechnology Innovation Station, National Institute for Materials Science, 1-2-1 Sengen, Tsukuba, Ibaraki 305-0047, Japan. E-mail: HANAGATA.Nobutaka@nims.go.jp
bAdvanced Materials Research Centre, SIRIM Berhad, Lot 34, Jalan Hi-Tech 2/3, Kulim, Hi-Tech Park, 09000 Kulim, Malaysia
cGraduate School of Life Science, Hokkaido University, N10W8, Kita-ku, Sapporo, Hokkaido 060-0812, Japan
First published on 12th January 2017
Abstract
Quantum dots (QDs)—especially those containing cadmium—are toxic to human cells, and therefore cannot be used directly for diagnosis and treatment of human disease. To circumvent this limitation, the surface of QDs must be modified to increase their water solubility and biocompatibility. To this end, we encapsulated CdSe/ZnS QDs coupled with iron oxide nanoparticles in phospholipid micelles ranging in size from 117 to 265 nm. The QD micelles showed no cytotoxicity in A549 and HeLa cells even at higher concentrations (25 μg ml−1). The ability of micelles to transport human serum albumin (HSA) protein was investigated by optical spectroscopy, and the thermodynamic parameters of the protein complexed with micelles were calculated with the van't Hoff equation at various temperatures (25–45 °C). We found that binding between micelles and HSA was stabilized by hydrogen bonds as well as electrostatic and hydrophobic forces. Fourier transform infrared spectroscopy and circular dichroism revealed changes in the secondary structure of HSA due to increment of alpha helical content, although the tertiary structure was largely preserved. The absolute quantum yield of water-soluble micelles was around 4% at an excitation wavelength 590 nm, while that of cadmium selenide (CdSe)/zinc sulfide (ZnS) QDs in chloroform was 20%. The fluorescence signal in HeLa and A549 cells remained high after 72 h of incubation with the micelles, as determined by confocal microscopy; moreover, the fluorescence signal was detected in both mother and daughter cells. These results demonstrate that CdSe/ZnS micelles are biocompatible since they do not induce cytotoxicity during long-term imaging nor affect the native structure of conjugated proteins.
1. Introduction
Fluorescence imaging of biological molecules using probes enables the visualization of cellular morphology and processes.1 Semiconductor quantum dots (QDs) are a type of probe that have potential therapeutic and biomechanical applications.2–9 QDs have higher signal intensity than fluorescent proteins and dyes, are photostable, and exhibit tunable emission from visible to infrared wavelengths and extensive absorption coefficients over a broad spectral range. Cadmium-based QDs have demonstrated toxicity in both in vitro and in vivo studies.6,7,10,11 This problem can be overcome by modifying the particle surface with water-soluble materials. For instance, phospholipid-modified QD micelles are widely used in biological applications owing to their low cytotoxicity and high solubility in water.12–14Human blood plasma contains several proteins that are involved in various physiological functions. Serum albumin (SA), the most abundant (60%) protein in blood plasma, maintains blood osmotic pressure and pH, transports endogenous and exogenous molecules (including drugs), and is used as a biomarker for disease diagnosis and treatment. HSA has an ellipsoid shape on highly oriented pyrolytic graphite surfaces, with an average length, width, and height of 12.6, 6.5, and 1.9 nm, respectively, under physiological conditions (pH 7.4).15 Recent studies have investigated the interaction between functionalized nanomaterials and plasma protein such as SA, fibrinogen, and globulin.16–20
In order to establish a safe and efficient system for live cell imaging, in the present study we prepared QDs coated with 1,2-distearoyl-sn-glycero-3-phosphoethanolamine-N-[biotinyl (polyethyleneglycol)-2000] [DSPE–PEG(2000)–biotin]-terminated phospholipids (Fig. S1†). Biotin is a useful substrate for targeting cancer cells including HeLa and A549 cells, which overexpress biotin receptors such as avidin and streptavidin.21–23 We also encapsulated oleic acid-terminated iron oxide nanoparticles (Fe3O4 NPs) within micelles for the purposes of magnetic separation and magnetic hyperthermia.24–27 When micelles containing Fe3O4 and cadmium selenide (CdSe)/zinc sulfide (ZnS) QDs are taken up by cancer cells, application of an external magnetic field can destroy the cells; moreover, micelle accumulation inside live specimens can be tracked by fluorescence microscopy and QDs can subsequently be removed along with the tumor. Here we investigated the interaction between magnetic CdSe/ZnS QD micelles and HSA as well as the behavior of QD micelles conjugated with HSA in HeLa and A549 cells, including cellular uptake and cytotoxicity.
2. Experimental methods
2.1 Reagents
CdSe/ZnS core shell-type QDs stabilized with octadecylamine ligands were purchased from Sigma-Aldrich (St. Louis, MO, USA; prod. no. 790206-10MG). Fe3O4 NPs in chloroform with oleic acid coating was from Nanotech Ocean (San Diego, CA, USA; prod. no. 92126 050412; 25 mg ml−1, 5 nm). DSPE–PEG (2000)–biotin was from Avanti Polar Lipids (Alabaster, AL, USA; prod. no. 880129). Human serum albumin (Product Number 017-10504) was purchased from Wako chemicals (Osaka, Japan). Chloroform and high-performance liquid chromatography (HPLC)-grade water were from Sigma-Aldrich. All chemicals were used without further purification. HeLa (RCB0007) and A549 (RCB0098) cell lines were obtained from Riken BioResource Center (Tsukuba, Japan).2.2 Preparation of phospholipid encapsulated CdSe/ZnS complexed with Fe3O4 NPs
DSPE–PEG (2000)–biotin (10 mg) was dispersed in 1 ml of chloroform; 1.2 mg CdSe/ZnS core shell QDs and 1 mg of a dispersion containing Fe3O4 NPs were then added to the phospholipid solution. The mixture was stirred for about 1 h and the chloroform was evaporated in a water bath with a rotary evaporator at 40 °C. The phospholipid film deposited on the reaction vessel was dissolved in 5 ml HPLC water and sonicated for 15 min in a water bath. Resultant micelles were filtered through a 0.2 μm membrane filter (Thermo Fisher Scientific, Waltham, MA, USA). To remove excess lipids from the micelle dispersion, the sample was centrifuged at 15![[thin space (1/6-em)]](https://www.rsc.org/images/entities/char_2009.gif) 000 rpm for 10 min, and the pellet was resuspended in HPLC water and re-filtered through a 0.2 μm membrane filter. Magneto fluorescent micelles in 5 ml HPLC water were stored at 4 °C.
000 rpm for 10 min, and the pellet was resuspended in HPLC water and re-filtered through a 0.2 μm membrane filter. Magneto fluorescent micelles in 5 ml HPLC water were stored at 4 °C.
2.3 Magnetic separation
Prepared micelles were separated from free phospholipids using a neodymium-based magnet (NdFeB, 50 × 50 × 25 mm) at a magnetic flex density of 0.6 tesla.2.4 Characterization
High-resolution images were obtained by transmission electron microscopy (TEM) on a G2 F30 S-Twin microscope (FEI Tecnai, Tokyo, Japan) with an acceleration voltage 300 kV. Samples were prepared by drop casting the dispersion onto a carbon-coated TEM grid. Ultraviolet-visible light (UV-vis) absorption spectra were acquired on a UV-vis spectrophotometer (U-2900; Hitachi, Tokyo, Japan). Photoluminescence spectra were recorded with a spectrofluorometer (Model F-7000; Hitachi) at an excitation wavelength of 500 nm and emission wavelength of 550–750 nm. Excitation and emission slit widths were 5 nm. Samples were loaded in a quartz cuvette for measurements. During photostability measurements, the water/chloroform solution of micelle-encapsulated magnetic CdSe/ZnS and CdSe/ZnS QDs (1 mg ml−1) was illuminated with a UV lamp for 1 h at a wavelength of 365 nm. Vibrating sample magnetometer (VSM) measurements of free Fe3O4 NPs and micelles were carried out using a Lake Shore VSM (Lake Shore Cryotonics, Westerville, OH, USA; model no. 7410) at room temperature. Micelle size was determined by dynamic light scattering (DLS) (Otsuka Electronics, Osaka, Japan; model no. DLS 8000) based on the Brownian motion of NPs excited with a He–Ne (632.8 nm) laser. Absolute quantum yields were measured using a C9920-03G system equipped with a 150 W xenon lamp (Hamamatsu Photonics, Hamamatsu, Japan). Measurements were obtained for dilute solutions in 1 cm2 quartz cuvettes.2.5 Time-resolved measurements
Fluorescence lifetime measurements were made using a Fluoro Cube UltraFast-3000U time-correlated single photon counting system (Horiba, Hamamatsu, Japan) with a fast-response, red-sensitive photomultiplier tube (Hamamatsu Photonics). The excitation source was a light-emitting diode laser with a wavelength of 570 nm (pulse width ∼ 0.1 ns) and decay measurements were made at 630 nm. The fluorescence emission was detected at a 90° angle relative to the path of the light source. The electrical signal was amplified by a TB-02 pulse amplifier (Horiba) connected to a constant fraction discriminator (Phillips, Amsterdam, The Netherlands). The first detected photon was used as a start signal by a time-to-amplitude converter (TAC), and the excitation pulse triggered the stop signal. The multichannel analyzer recorded repetitive start–stop signals from the TAC and generated a histogram of photons as a function of time-calibrated channels. The instrument response function was obtained using Rayleigh scatter of Ludox-40 (40 wt% suspension in water; Sigma-Aldrich) in a quartz cuvette at 570 nm. Decay analysis software (DAS6V6.0; Horiba) was used to extract lifetime components. The goodness of fit was judged by χ2 values and by visual observation of the fitted line and residuals. Fluorescence decay was analyzed with two and three lifetimes and χ2 values were compared to determine the best fit. The time calibration of the system was 6.976663 × 10⁻¹² s per channel. Decays were fitted to the following two-exponent function:
 | (1) |
 | (2) |
2.6 Excitation and emission matrix (EEM)
The EEM was characterized under the following conditions: emission spectra were obtained between 200–600 nm, and the initial excitation wavelength was set to 200 nm in increments of 10 nm. The number of scanning curves was 20 and other scanning parameters were identical to those used for fluorescence emission spectral measurements. For EEM measurements, spectral band passes were maintained at 5 nm for both excitation and emission. Samples were analyzed in 1 ml quartz cuvettes with a 1 cm excitation path length.2.7 Stocks shift spectroscopy
Synchronous fluorescence spectra were obtained by simultaneously scanning the excitation and emission monochromators at two different constant wavelength intervals – e.g., 15 and 60 nm between excitation and emission monochromators.2.8 Fluorescence resonance energy transfer (FRET) measurement
The FRET distance and efficiency of energy transfer was calculated from the micelle absorption spectrum and HSA fluorescence spectrum at a concentration ratio of micelles and protein of 1![[thin space (1/6-em)]](https://www.rsc.org/images/entities/char_2009.gif) :
:![[thin space (1/6-em)]](https://www.rsc.org/images/entities/char_2009.gif) 1 at pH 7.4.
1 at pH 7.4.
2.9 Circular dichroism (CD) measurement
CD spectra of HSA alone and in a micelle complex were obtained with a spectropolarimeter (model J-725; Jasco, Tokyo, Japan) using a 1 mm path length quartz cuvette with a scan speed 100 nm min−1. Ellipticity is expressed in millidegrees. Various micelle concentrations were added as small aliquots of stock solution to protein solutions. Each spectrum represents an average of three scans. Measurements were obtained at 24 °C.2.10 Fourier transform infrared (FTIR) spectroscopy
Attenuated total reflection FTIR spectra measurements of HSA alone and in a micelle complex were obtained with an FTIR spectrometer (IRTracer-100; Shimadzu, Kyoto, Japan). Spectra of sample and buffer solutions were obtained under the same conditions (pH 7.4).2.11 Cell cultures
A549 and HeLa cells were cultured in a 75 cm2 flask for microscopy and the cytotoxicity assay. A549 cells were grown in high-glucose Dulbecco-modified Eagle's medium supplemented with 10% fetal bovine serum, 50 U ml−1 penicillin, and 50 mg ml−1 streptomycin at 37 °C in humidified air containing 5% CO2. HeLa cells were cultured under the same conditions but in minimal essential medium.2.12 Fluorescence microscopy
HeLa and A549 cells (8000 cells per cm2) were cultured in a 35 mm dish for 24 h for micelle uptake and fluorescence imaging, for which 20 μg ml−1 of micelle were used. Control experiments were performed under identical conditions but without adding micelles to the cultures. Cells were washed three times with phosphate-buffered saline and fixed with 3.7% paraformaldehyde for 10 min. Differential interference contrast and fluorescence images were obtained with an SP5 confocal laser scanning microscope (Leica Microsystems, Wetzlar, Germany).2.13 Cytotoxicity assay
An in vitro cytotoxic assay for QDs was carried out using Cell Counting Kit-8 (Dojindo Laboratories, Osaka, Japan). Cells were seeded in a 96-well plate at a density of 5000 per well. QDs were added after 24 h, and the plate was incubated for an additional 24 h followed by incubation with 10 μl cholecystokinin octapeptide for 2 h. Absorbance at 450 nm was measured on a microplate reader (MTP-880Lab; Corona, Hitachinaka, Japan). Cytotoxicity is represented as a percentage of untreated control cells.3. Results and discussion
3.1 Characterization of micelles containing QDs and magnetic NPs
TEM analysis of free-standing hydrophobic CdSe/ZnS QDs (stabilized with octadecylamine ligands) before surface modification revealed a relatively monodispersed size distribution with an average particle size of 10 nm (Fig. 1A and B). The presence of lattice fringes indicated that the particles were crystalline. We also confirmed the localization of CdSe/ZnS and Fe3O4 NPs inside micelles (Fig. 1C and D), which ranged in size from 50 to 70 nm when the two NPs were coencapsulated. The hydrodynamic diameter distribution as measured by DLS revealed a mean micelle diameter of 117.87 ± 2.55 nm. The ratio of CdSe/ZnS and Fe3O4 NPs varied among micelles (Table 1). The presence of CdSe/ZnS and Fe3O4 NPs in the micelle core was verified by energy-dispersive X-ray analysis (Fig. S2†). When an external magnetic field was applied to the micelle-containing vessel, the micelle moved to the point where the field gradient was strongest (Fig. S3†); when the magnetic field was removed, the micelle was readily dispersed in water. The micelle showed high luminescence under a magnetic field when excited by UV light.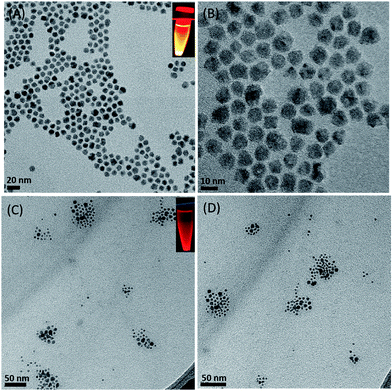 | ||
| Fig. 1 TEM Characterization. (A, B) CdSe/ZnS QDs with different magnification. (C, D) Magnetic CdSe/ZnS QDs micelles. Inset (A, C) indicates fluorescence under UV light excitation. | ||
Micelle (CdSe/ZnS)![[thin space (1/6-em)]](https://www.rsc.org/images/entities/char_2009.gif) : :![[thin space (1/6-em)]](https://www.rsc.org/images/entities/char_2009.gif) (Fe3O4)/phospholipid (Fe3O4)/phospholipid |
D1 | D2 | D3 | Davg |
|---|---|---|---|---|
M1 (1![[thin space (1/6-em)]](https://www.rsc.org/images/entities/char_2009.gif) : :![[thin space (1/6-em)]](https://www.rsc.org/images/entities/char_2009.gif) 1)/10 mg 1)/10 mg |
118.5 | 115.1 | 120.1 | 117.87 ± 2.55 |
M2 (1![[thin space (1/6-em)]](https://www.rsc.org/images/entities/char_2009.gif) : :![[thin space (1/6-em)]](https://www.rsc.org/images/entities/char_2009.gif) 2)/10 mg 2)/10 mg |
136.9 | 135.5 | 130.8 | 134.40 ± 3.19 |
M3 (1![[thin space (1/6-em)]](https://www.rsc.org/images/entities/char_2009.gif) : :![[thin space (1/6-em)]](https://www.rsc.org/images/entities/char_2009.gif) 3)/10 mg 3)/10 mg |
144.9 | 143.2 | 138.8 | 142.30 ± 3.15 |
M4 (1![[thin space (1/6-em)]](https://www.rsc.org/images/entities/char_2009.gif) : :![[thin space (1/6-em)]](https://www.rsc.org/images/entities/char_2009.gif) 2)/05 mg 2)/05 mg |
259.4 | 269.2 | 265.4 | 264.66 ± 4.94 |
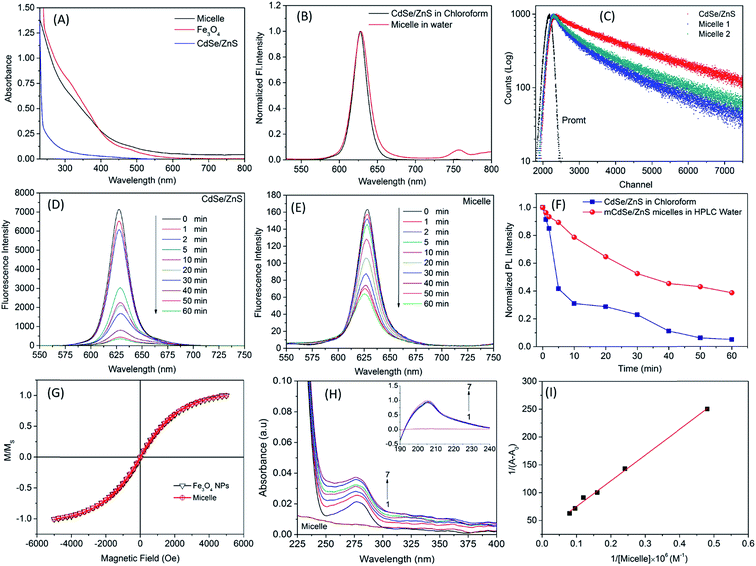
Fig. 2A shows the absorption spectra of micelle-encapsulated CdSe/ZnS QDs/Fe3O4 NPs, CdSe/ZnS QDs in chloroform, and Fe3O4 NPs in chloroform. NPs alone had lower absorption than micelles (>500 nm) due to the presence of both NPs inside the micelle core. The fluorescence emission spectra of micelles and CdSe/ZnS QDs were obtained at 630 nm (Fig. 2B); those of micelles and CdSe/ZnS QDs in chloroform were similar. The average lifetime variations of QDs and micelle are shown in Fig. 2C and Table 2. Fe3O4 NPs quenched QD fluorescence through energy transfer, reflecting the results from the lifetime profile in the excited state.
| Samples | α1 | α2 | α3 | τ1 (ns) | τ2 (ns) | τ3 (ns) | τ0 (ns) | χ2 |
|---|---|---|---|---|---|---|---|---|
| CdSe/ZnS | 07.39 | 92.61 | — | 3.82 | 19.81 | — | 19.57 | 0.96 |
| CdSe/ZnS | 09.37 | 00.76 | 89.88 | 5.21 | 00.86 | 20.62 | 20.22 | 0.95 |
| M1 | 18.87 | 81.13 | — | 2.78 | 16.48 | — | 15.96 | 1.07 |
| M1 | 22.55 | 04.41 | 73.04 | 4.61 | 00.89 | 18.79 | 17.75 | 0.99 |
| M2 | 25.10 | 74.90 | — | 2.59 | 14.69 | — | 14.01 | 1.14 |
| M2 | 28.38 | 06.01 | 65.61 | 4.18 | 00.84 | 17.04 | 15.75 | 1.04 |
Photobleaching is an important parameter in biological imaging experiments. We examined the optical properties of QDs and micelles under irradiation with UV light (Fig. 2D and E). As irradiation time increased, luminescence of the materials decreased due to photobleaching (Fig. 2F). After 60 min of irradiation, the 4% absolute quantum yield of micelles exhibited a stability of 50%, whereas the 20% absolute quantum yield of CdSe/ZnS QD intensity was zero. These results suggest that the prepared micelles are suitable for biological imaging under strong laser illumination or long-term light exposure.
Magnetic characterization was carried out using a VSM. Both QDs and Fe3O4 NPs were superparamagnetic at 305 K. Fe3O4 NPs alone showed higher magnetization than micelles (Fig. 2G), which had a small amount of these NPs in their core. Nonetheless, upon standardization, the magnetization profile of the two materials were nearly indistinguishable.
3.2 Cytotoxicity of micelle-QDs
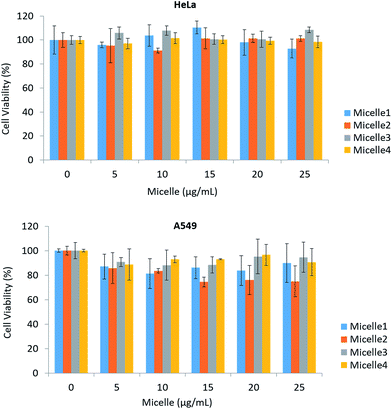
Micelles showed no cytotoxicity in the concentration range of 0–25 μg ml−1 in HeLa and A549 cell lines exposed for up to 24 h. This may be attributable to the structure of the ZnS shell and phospholipid coating; a previous study reported that a ZnS shell and PEG coating inhibit the release of Cd2+ from QDs, which is one known mechanism of QD toxicity. We tested micelles of four different sizes ranging from 117.87 ± 2.55 to 264.66 ± 4.94 nm. In the case of HeLa cells, there was no obvious toxicity even at higher concentrations, although some effects were observed in A549 cells (Fig. 3A and B).3.3 Effect of micelle-QDs on serum HSA
Albumin is synthesized in the liver. SA accounts for 55% of blood plasma proteins and maintains osmotic pressure in plasma to enable lipid and steroid hormone transport. Therefore, in order to evaluate the possibility of drug delivery using QD micelles, it is important to clarify the interaction between micelles and HSA. UV-vis spectroscopy is used to study the interaction between NPs and proteins. HSA has absorption peak at 278 nm; we obtained the UV-vis absorption spectrum of HSA in the presence and absence of QD micelles (Fig. 2H). HSA absorption increased in the presence of micelles and showed two bands. The first (∼200 nm) was due to π–π* transition of the polypeptide backbone C![[double bond, length as m-dash]](https://www.rsc.org/images/entities/char_e001.gif) O of HSA, and the second had a peak at 278 nm due to aromatic amino acid residues, especially tryptophan (Trp). The second band changed perceptibly after micelle addition, indicating a change in the microenvironment of the Trp residue. These observations suggest the formation of a ground state complex between HSA and micelles.
O of HSA, and the second had a peak at 278 nm due to aromatic amino acid residues, especially tryptophan (Trp). The second band changed perceptibly after micelle addition, indicating a change in the microenvironment of the Trp residue. These observations suggest the formation of a ground state complex between HSA and micelles.
The degree of complex formation between HSA and micelles was calculated with the following equation:
 | (3) |
k = [HSA![[thin space (1/6-em)]](https://www.rsc.org/images/entities/char_2009.gif) : :![[thin space (1/6-em)]](https://www.rsc.org/images/entities/char_2009.gif) micelle]/([HSA][micelle]) micelle]/([HSA][micelle])
| (4) |
The binding constant of complex formation was determined from the change in intensity of the absorption peak at 278 nm according to the Benesi–Hildebrand relationship:28
| 1/(Aobs − A0) = 1/(Ac − A0) + 1/Kapp [Ac − A0]1/[micelle] | (5) |
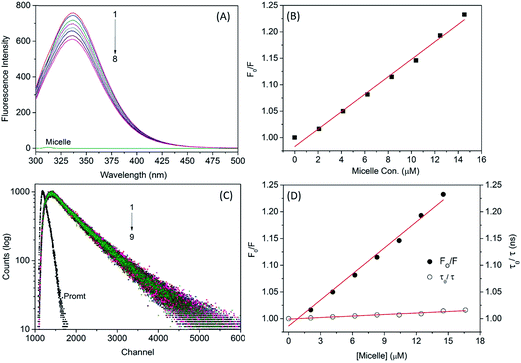
The binding affinity of the micelle–protein interaction was determined by fluorescence emission spectroscopy. The emission maximum of SA was attributable to aromatic amino acids such as Trp, tyrosine (Tyr), and phenylalanine. Trp has a high quantum yield compared to the other aromatic amino acids present in the HSA; Trp214 is located in subdomain IIA, which is the major binding site of HSA. Static or dynamic quenching can occur via FRET, molecular rearrangement, and excited state reactions. When small molecules interact with HSA, the intrinsic fluorescence intensity changes due to Trp residues. Fluorescence emission spectra revealed that adding increasing concentrations of micelle to HSA caused quenching of the protein fluorescence without peak shifts (Fig. 4A), implying that micelles and HSA formed complexes. The polarity of the fluorescence quantum yield surrounding Trp residues was altered due to unfolding of the native protein conformation. The decreased quantum yield of Trp214 was due to molecular interaction with micelles.
Fluorescence quenching can be of two types, static and dynamic. The former occurs when molecules (HSA–micelles) form a complex in the ground state, and the latter when molecules come into contact during the transient existence of the excited state. To confirm whether HSA–micelle complexes exhibit static or dynamic quenching, we plotted F0/F vs. [Q]; a linear relationship was observed (Fig. 4B), providing evidence for static quenching.
The Kq was calculated using the Stern–Volmer equation, which is expressed as follows:29–31
 | (6) |
To clarify the dynamics of the HSA–micelle complex, we measured the fluorescence lifetime of HSA in the presence and absence of micelles (Fig. 4). HSA alone showed a biexponential decay curve with an average lifetime of 5.89 ns and lifetime components of 27.86% and 72.14%. The fluorescence decay of HSA was unaltered by increasing micelle concentrations (Table 4), remaining biexponential in the presence of 42 μg micelle with an average lifetime 5.80 ns and lifetime components of 26.29% and 73.71%, respectively. Minute alterations occurred as a result of changes in the local conformation of HSA. A time-resolved Stern–Volmer plot was generated with the following equation:32
 | (7) |
The plot was parallel to the x axis, indicating a static quenching mechanism for the interaction between the micelle and HSA (Fig. 4D). Trp214 was located in the hydrophobic cavity of subdomain IIA, which is where the micelle was bound, resulting in quenching.
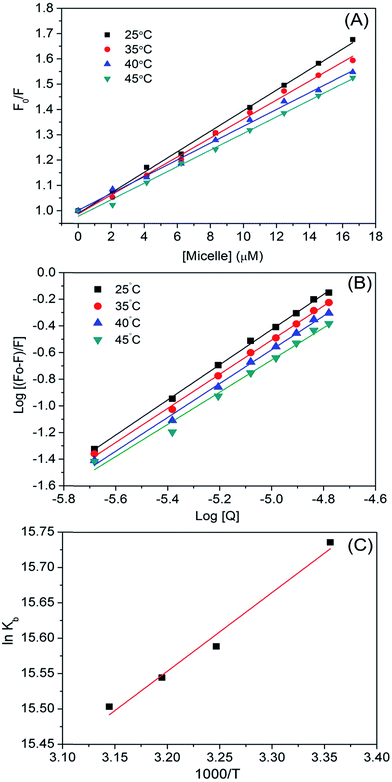
We calculated binding parameters at different temperatures using the van't Hoff equation to determine the driving force between micelles and HSA (Fig. 5):33
 | (8) |
![[thin space (1/6-em)]](https://www.rsc.org/images/entities/char_2009.gif) K and 1/T. The free energy change (ΔG) of the reaction at different temperatures was calculated using ΔH and ΔS in the equation ΔG = ΔH − TΔS. The binding parameters are listed in Table 3. The ΔG value was more negative due to negative ΔH and positive ΔS values, thus favoring micelle–HSA complex formation. Positive values of ΔH and ΔS indicate hydrophobic interactions, whereas negative values indicate van der Waal's forces and hydrogen bond formation.34 A positive ΔS and negative ΔH suggest a specific electrostatic interaction between specific ions in an aqueous solution. The negative change in enthalpy (ΔH° = −119.90 kJ mol−1) and positive change in entropy (ΔS° = 11.12 J mol−1 K−1) values for HSA–micelle binding indicate an entropy-driven interaction in which enthalpy is unfavorable, resulting in the stabilization of a specific electrostatic force. A negative ΔH value could also represent hydrogen bonding. ΔS values are positive whereas ΔH values are either close to zero or negative for a number of processes involving hydrophobic interactions. Binding of ligand to protein buries the water-accessible surface area and thereby releases the solvent from the surface. A positive ΔS value reflects the associated entropic changes in the system and indicates that the interaction between the micelle and HSA is hydrophobic. Thus, hydrophobic effects, electrostatic forces, and hydrogen bonding predominate the micelle–HSA interaction. Possible micelle–HSA assemblies are illustrated in Fig. S4C.†
K and 1/T. The free energy change (ΔG) of the reaction at different temperatures was calculated using ΔH and ΔS in the equation ΔG = ΔH − TΔS. The binding parameters are listed in Table 3. The ΔG value was more negative due to negative ΔH and positive ΔS values, thus favoring micelle–HSA complex formation. Positive values of ΔH and ΔS indicate hydrophobic interactions, whereas negative values indicate van der Waal's forces and hydrogen bond formation.34 A positive ΔS and negative ΔH suggest a specific electrostatic interaction between specific ions in an aqueous solution. The negative change in enthalpy (ΔH° = −119.90 kJ mol−1) and positive change in entropy (ΔS° = 11.12 J mol−1 K−1) values for HSA–micelle binding indicate an entropy-driven interaction in which enthalpy is unfavorable, resulting in the stabilization of a specific electrostatic force. A negative ΔH value could also represent hydrogen bonding. ΔS values are positive whereas ΔH values are either close to zero or negative for a number of processes involving hydrophobic interactions. Binding of ligand to protein buries the water-accessible surface area and thereby releases the solvent from the surface. A positive ΔS value reflects the associated entropic changes in the system and indicates that the interaction between the micelle and HSA is hydrophobic. Thus, hydrophobic effects, electrostatic forces, and hydrogen bonding predominate the micelle–HSA interaction. Possible micelle–HSA assemblies are illustrated in Fig. S4C.†
| T (°C) | Kq (×1012 l mol−1 s−1) | Kb (×106 l mol−1) | n | R2 | ΔG° (kJ mol−1) | ΔH° (kJ mol−1) | ΔS° (J mol−1 K−1) |
|---|---|---|---|---|---|---|---|
| 25 | 5.67 | 6.16 | 1.31 | 0.99 | −35.719 | −119.90 | 11.12 |
| 35 | 5.61 | 5.89 | 1.27 | 0.99 | −36.918 | ||
| 40 | 4.48 | 5.75 | 1.26 | 0.99 | −37.517 | ||
| 45 | 4.11 | 5.37 | 1.20 | 0.98 | −38.117 |
| Sample | α1 | α2 | τ1 (ns) | τ2 (ns) | τ0 (ns) | χ2 |
|---|---|---|---|---|---|---|
| 1 | 27.86 | 72.14 | 2.52 | 6.41 | 5.8972 | 1.01 |
| 2 | 28.61 | 71.39 | 2.53 | 6.42 | 5.8894 | 1.04 |
| 3 | 27.17 | 72.83 | 2.46 | 6.37 | 5.8776 | 1.03 |
| 4 | 28.26 | 71.74 | 2.58 | 6.39 | 5.8671 | 1.05 |
| 5 | 27.14 | 72.86 | 2.54 | 6.35 | 5.8559 | 1.08 |
| 6 | 23.99 | 76.01 | 2.34 | 6.27 | 5.8558 | 1.10 |
| 7 | 26.13 | 73.87 | 2.45 | 6.31 | 5.8438 | 1.08 |
| 8 | 24.65 | 75.35 | 2.36 | 6.24 | 5.8127 | 1.08 |
| 9 | 26.29 | 73.71 | 2.42 | 6.27 | 5.8041 | 1.13 |
We used three dimensional fluorescence spectroscopy to further examine the conformational changes in HSA induced by addition of micelles (Fig. 6). Peaks 1 and 2 represent fluorescence from HSA, and peaks x and y correspond to Rayleigh and second order-scattering peaks, respectively. Peak 1 arises from the intrinsic fluorescence of HSA due to Tyr and Trp (tertiary structure) residues participating in the π → π* transition, whereas peak 2 was attributable to fluorescence characteristics of the polypeptide backbone structure (secondary structure) of HSA caused by π → π* transition. These peaks are associated with HSA fluorescence quenching upon binding with micelles.
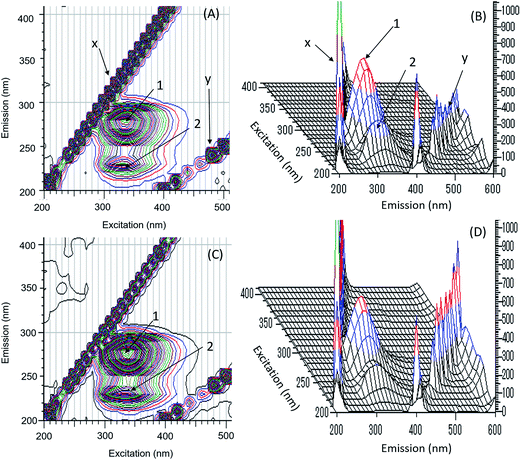 | ||
| Fig. 6 Contour map and three dimensional fluorescence spectra of interaction of HSA in the absence (A, B) and the presence (C, D) of micelles. | ||
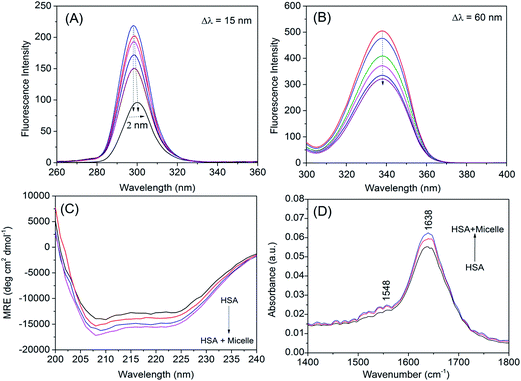
Conformational changes in the microenvironment around the fluorophores Tyr (Δλ = 15 nm) and Trp (Δλ = 60 nm) were determined based on synchronous fluorescence spectra obtained for HSA at increasing concentrations of micelle (Fig. 7A and B). A small red shift of 2 nm was detected within the maximum emission for Tyr, while there was no shift for Trp, suggesting that micelle–HSA binding had altered the microenvironment of Tyr but not Trp residues—specifically, a shift from a nonpolar, hydrophobic environment to one that is more hydrophilic.
3.4 Secondary structure of HSA
We monitored the secondary structure of the HSA interaction with QD-containing micelles by CD spectroscopy (Fig. 7C). Native HSA contains two negative peaks at 208 and 222 nm and has an α-helical content of 67.45% ± 0.73%.32,35 After serial addition of micelles at concentrations of 2, 4, and 6 μM, the α-helical content increased to 70.05% ± 0.81%, 72.24% ± 0.77%, and 74.11% ± 0.68%, respectively. However, the shape and positions of the protein peaks were unaltered in the presence of micelles. Thus, the increment in the α-helical content changed the secondary structure of protein during interaction with higher concentrations of micelle or the formation of an HSA–micelle complex via hydrogen bonding or hydrophobic interactions.36Changes in protein secondary structure during interaction with other small molecules can also be analyzed by FTIR spectroscopy. Amide I and II frequencies of HSA are sensitive to such changes; the amide I band occurs in the region 1600–1700 cm−1 mainly due to C![[double bond, length as m-dash]](https://www.rsc.org/images/entities/char_e001.gif) O stretch, while the amide II peak occurs in the region of 1500–1550 cm−1 due to C–N stretch coupled with N–H bending.37,38 The FTIR spectrum of HSA complexed with a micelle revealed no shifts in the amide I and II peaks, although their respective intensities increased (Fig. 7D), indicating that the secondary structure of HSA is slightly altered by interaction with micelles, consistent with the CD results.
O stretch, while the amide II peak occurs in the region of 1500–1550 cm−1 due to C–N stretch coupled with N–H bending.37,38 The FTIR spectrum of HSA complexed with a micelle revealed no shifts in the amide I and II peaks, although their respective intensities increased (Fig. 7D), indicating that the secondary structure of HSA is slightly altered by interaction with micelles, consistent with the CD results.
3.5 FRET
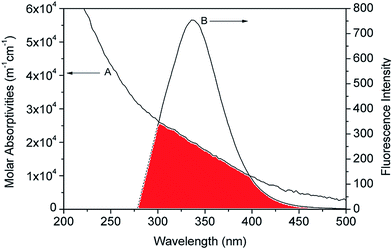
The binding distance between donor–acceptor pairs can be calculated based on Förster non-radiative energy transfer. The distance between HSA and the micelle is approximated by the distance between the Trp214 residue in the protein and the micelle surface. The rate of energy transfer depends on following factors: (i) the absorption spectrum of the acceptor overlaps with that of the donor; (ii) donor and acceptor molecules are separated by a distance of ≤2–8 nm; and (iii) the relative orientation of donor and acceptor transition dipoles. A significant overlap was observed between the emission spectrum of HSA and the absorption spectra of micelles (Fig. 8). According to the Förster theory of non-radiative energy transfer, the energy transfer efficiency, E, can be calculated as,39,40
 | (9) |
| R0 = 9.79 (K2N−4ϕDJ)1/6 | (10) |
3.6 Uptake of micelle-QDs by cancer cells
The uptake of QD micelles by cultured cancer cells was examined by confocal microscopy (Fig. 9). Within 24 h of exposure to micelles dissolved in HPLC water, cells accumulated micelles in the cell membrane and cytoplasm with high signal intensity. After 72 h of continuous incubation with micelles, the micelle fluorescence intensity from the cells was good. To verify cellular uptake of micelles, cells were harvested after 72 h of incubation with micelles using trypsin–EDTA solution and then reseeded. After an additional 72 h, fluorescence was observed in divided cells (Fig. S5†), indicating that QD micelles are highly stable in cancer cells and maintain both their micelle and fluorescence properties.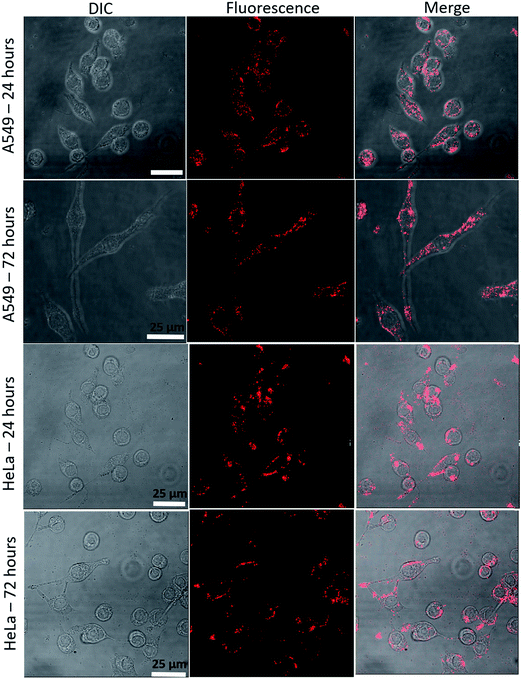 | ||
| Fig. 9 Cellular uptake of micelles. HeLa and A549 cells were incubated with micelles for 24 or 72 h. | ||
4. Conclusion
The present study described the properties and demonstrated the application of magneto-fluorescent CdSe/ZnS QD micelles for in vitro imaging and blood plasma protein binding studies. Even at a high concentration (25 μg ml−1), micelles of various diameters were non-toxic to HeLa and A549 cells. We used 117.87 ± 2.55 nm-sized micelles for in vitro imaging, since smaller particles are more readily taken up by cancer cells via blood vessels near the tumor site. In order to assess the potential for in vivo applications, we analyzed the interaction of micelles with the blood plasma protein HSA using different optical spectroscopic techniques. We found that the interaction was stabilized via hydrogen bonding, electrostatic forces, and hydrophobic interaction, with no obvious structural changes to the protein. Our findings indicate that CdSe/ZnS QD micelles can be useful for long-term imaging of biological samples by fluorescence microscopic methods.Acknowledgements
This work was supported by a Japan Society for the Promotion of Science (JSPS) Postdoctoral Fellowship from the Ministry of Education, Culture, Sports, Science and Technology.References
- W. A. W. Razali, V. K. A. Sreenivasan, C. Bradac, M. Connor, E. M. Goldys and A. V. Zvyagin, J. Biophotonics, 2016, 9, 848–858 CrossRef CAS PubMed.
- M. X. Zhao, Y. Li, E. Z. Zeng and C. J. Wang, Chem.–Asian J., 2014, 9, 1349–1355 CrossRef CAS PubMed.
- D. Painuly, A. Bhatt and V. K. Krishnan, Proceeding of International Conference on Recent Trends in Applied Physics and Material Science, 2013, vol. 1536, pp. 63–64 Search PubMed.
- K. V. Zolotarev, V. N. Kashirtseva, A. V. Mishin, N. F. Belyaeva, N. V. Medvedeva and O. M. Ipatova, ISRN Nanotechnol., 2012, 2012, 1–5 CrossRef.
- B. B. Manshian, S. J. Soenen, A. Al-Ali, A. Brown, N. Hondow, J. Wills, G. J. Jenkins and S. H. Doak, Toxicol. Sci., 2015, 144, 246–258 CrossRef CAS PubMed.
- S. Sanwlani, K. Rawat, M. Pal, H. B. Bohidar and A. K. Verma, J. Nanopart. Res., 2014, 16, 2382 CrossRef.
- L. Peng, M. He, B. Chen, Q. Wu, Z. Zhang, D. Pang, Y. Zhu and B. Hu, Biomaterials, 2013, 34, 9545–9558 CrossRef CAS PubMed.
- G. Amiri, A. Valipoor, K. Parivar, M. Modaresi, A. Noori, H. Gharamaleki, J. Taheri and A. Kazemi, Int. J. Fertil. Steril., 2014, 9, 512–520 Search PubMed.
- Y. J. Choi, Y. J. Kim, J. W. Lee, Y. Lee, Y. B. Lim and H. W. Chung, J. Nanosci. Nanotechnol., 2012, 12, 2160–2168 CrossRef CAS PubMed.
- J. Y. Zhao, L. M. Jia, W. Q. Song, W. L. Zhang, Y. M. Fu, Y. Zhang, W. W. Cao, Y. Sun, J. H. Zheng and F. M. Zhang, J. Nanopart. Res., 2014, 16, 2382 CrossRef.
- W. Wang, Y. He, G. Yu, B. Li, D. W. Sexton, T. Wileman, A. A. Roberts, C. J. Hamilton, R. Liu, Y. Chao, Y. Shan and Y. Bao, PLoS One, 2015, 10, e0138771 Search PubMed.
- J. Liu, F. Erogbogbo, K. T. Yong, L. Ye, J. Liu, R. Hu, H. Chen, Y. Hu, Y. Yang, J. Yang, I. Roy, A. Nicholas, N. A. Karker, M. T. Swihart and P. N. Prasad, ACS Nano, 2013, 7, 7303–7310 CrossRef CAS PubMed.
- F. Erogbogbo, K. T. Yong, I. Roy, R. Hu, W. C. Law, W. Zhao, H. Ding, F. Wu, R. Kumar, M. T. Swihart and P. N. Prasad, ACS Nano, 2011, 5, 413 CrossRef CAS PubMed.
- F. Erogbogbo, K. T. Yong, R. Hu, W. C. Law, H. Ding, C. W. Chang, P. N. Prasad and M. T. Swihart, ACS Nano, 2010, 4, 5131 CrossRef CAS PubMed.
- X. Peng, H. Fu, R. Liu, L. Zhao, Y. Zu, F. Xu and Z. Liu, Scanning, 2015, 37, 158–164 CrossRef CAS PubMed.
- Kenry, K. P. Loh and C. T. Lim, Nanoscale, 2016, 8, 9425–9441 RSC.
- N. Fernandez-Iglesias and J. Bettmer, Nanoscale, 2015, 7, 14324–14331 RSC.
- T. Sen, S. Mandal, S. Haldar, K. Chattopadhyay and A. Patra, J. Phys. Chem. C, 2011, 115, 24037–24044 CAS.
- S. Tenzer, D. Docter, S. Rosfa, A. Wlodarski, J. Kuharev, A. Rekik, S. K. Knauer, C. Bantz, T. Nawroth, C. Bier, J. Sirirattanapan, W. Mann, L. Treuel, R. Zellner, M. Maskos, H. Schild and R. H. Stauber, ACS Nano, 2011, 5, 7155–7167 CrossRef CAS PubMed.
- S. P. Boulos, T. A. Davis, J. A. Yang, S. E. Lohse, A. M. Alkilany, L. A. Holland and C. J. Murphy, Langmuir, 2013, 29, 14984–14996 CrossRef CAS PubMed.
- D. Jung, S. Maiti, J. H. Lee, J. H. Lee and J. S. Kim, Chem. Commun., 2014, 50, 3044–3047 RSC.
- S. Maiti, N. Park, J. H. Han, H. M. Jeon, J. H. Lee, S. Bhuniya, C. Kang and J. S. Kim, J. Am. Chem. Soc., 2013, 135, 4567–4572 CrossRef CAS PubMed.
- W. X. Ren, J. Han, S. Uhm, Y. J. Jang, C. Kang, J. H. Kim and J. S. Kim, Chem. Commun., 2015, 51, 10403–10418 RSC.
- M. Banobre-Lopez, A. Teijeiro and J. Rivas, Rep. Pract. Oncol. Radiother., 2013, 18, 397–400 CrossRef PubMed.
- A. C. Silva, T. R. Oliveira, J. B. Mamani, S. M. Malheiros, L. Malavolta, L. F. Pavon, T. T. Sibov, E. Amaro Jr, A. Tannus, E. L. Vidoto, M. J. Martins, R. S. Santos and L. F. Gamarra, Int. J. Nanomed., 2011, 6, 591–603 CAS.
- K. Hayashi, M. Nakamura, W. Sakamoto, T. Yogo, H. Miki, S. Ozaki, M. Abe, T. Matsumoto and K. Ishimura, Theranostics, 2013, 3, 366–376 CrossRef CAS PubMed.
- K. Hayashi, M. Moriya, W. Sakamoto and T. Yogo, Chem. Mater., 2009, 21, 1318–1325 CrossRef CAS.
- S. Chinnathambi, D. Velmurugan, N. Hanagata, P. R. Aruna and S. Ganesan, J. Lumin., 2014, 151, 1–10 CrossRef CAS.
- D. P. Yeggoni, A. Rachamallu and R. Subramanyam, RSC Adv., 2016, 6, 40225–40237 RSC.
- D. Ray, A. Kundu, A. Pramanik and N. Guchhait, J. Phys. Chem. B, 2015, 119, 2168–2179 CrossRef CAS PubMed.
- R. Sett, A. Ganguly and N. Guchhait, J. Photochem. Photobiol., B, 2016, 164, 141–150 CrossRef CAS PubMed.
- R. Mangaiyarkarasi, S. Chinnathambi, P. Aruna and S. Ganesan, J. Nanopart. Res., 2015, 17, 136 CrossRef.
- B. K. Paul, D. Ray and N. Guchhait, Phys. Chem. Chem. Phys., 2013, 15, 1275–1287 RSC.
- P. D. Ross and S. Subramanian, Biochemistry, 1981, 20, 3096–3102 CrossRef CAS PubMed.
- M. Wang, C. Fu, X. Liu, Z. Lin, N. Yang and S. Yu, Nanoscale, 2015, 7, 15191–15196 RSC.
- J. Wang, L. Ma, Y. Zhang and T. Jiang, J. Mol. Struct., 2017, 1129, 160–168 CrossRef CAS.
- Z. Q. Xu, Q. Q. Yang, J. Y. Lan, J. Q. Zhang, W. Peng, J. C. Jin, F. L. Jiang and Y. Liu, J. Hazard. Mater., 2016, 301, 242–249 CrossRef CAS PubMed.
- J. C. Ioannou, A. M. Donald and R. H. Tromp, Food Hydrocolloids, 2015, 46, 216–225 CrossRef CAS.
- S. Chinnathambi, S. Karthikeyan, D. Velmurugan, N. Hanagata, P. Aruna and S. Ganesan, Int. J. Spectrosc., 2015, 2015, 1–12 CrossRef.
- S. Chinnathambi, S. Karthikeyan, M. Keshervani, D. Velmurugan and N. Hanagata, J. Phys. Chem. Biophys., 2016, 6, 1–9 Search PubMed.
- S. Raut, R. Rich, R. Fudala, S. Butler, R. Kokate, Z. Gryczynski, R. Luchowski and I. Gryczynski, Nanoscale, 2014, 6, 385–391 RSC.
- Z. Cheng, R. Liu and X. Jiang, Spectrochim. Acta, Part A, 2013, 115, 92–105 CrossRef CAS PubMed.
Footnote |
| † Electronic supplementary information (ESI) available. See DOI: 10.1039/c6ra26592h |
| This journal is © The Royal Society of Chemistry 2017 |

