 Open Access Article
Lamellar mesoporous carbon derived from bagasse for the cathode materials of lithium–sulfur batteries†
Xiqing Yuana,
Bingchuan Liua,
Jingyi Xua,
Xiaorong Yanga,
Kemal Zeinua,
Xiulin Hea,
Longsheng Wua,
Jingping Hu *a,
Jiakuan Yang
 *a and
Jia Xieb
aSchool of Environmental Science and Engineering, Huazhong University of Science and Technology (HUST), Wuhan, 430074, P. R. China. E-mail: hujp@hust.edu.cn; jkyang@hust.edu.cn; Tel: +86-27-87793948 Tel: +86-27-87792207
bSchool of Electrical & Electronic Engineering, Huazhong University of Science and Technology (HUST), Wuhan, 430074, P. R. China
First published on 28th February 2017
Abstract
Mesoporous lamellar carbon was produced by direct high temperature carbonization of bagasse, a novel process designed with affordable cost and ease of production for scale-up manufacturing. The lamellar carbon exhibited a highly mesoporous structure with favorable pore size distribution, large surface area and good electrical conductivity derived from the intrinsic thin-walled parenchyma cells of bagasse. The produced lithium–sulfur battery exhibited excellent cycle stability, due to the unique pore structure of bagasse that can accommodate the drastic volume change during battery cycling, and good rate performance, due to the high electrical conductivity of bagasse derived carbon after pyrolysis. A high initial reversible capacity of 1202 mA h g−1 (S) at 0.1C as well as a reversible capacity of 494 mA h g−1 (S) after 180 cycles at 1C was achieved, and the capacity retention was also found to be more than 70% at 1C. The designed processing method for the facile production of lamellar mesoporous carbon derived from direct carbonization of bagasse should be a feasible method for the mass production of cathode materials for high performance lithium–sulfur batteries.
1 Introduction
The demand for high performance energy storage devices has increased drastically with the fast growth in economies and the emerging environmental issues.1 Among different types of batteries, the lithium–sulfur (Li–S) battery is considered as one of the most promising candidates for the next generation secondary battery market.2 Conventional lithium ion batteries exhibit an inherent theoretical capacity limitation of around 300 mA h g−1 and energy density of 387 W h kg−1,3 while Li–S batteries have a much higher theoretical capacity of 1675 mA h g−1 and energy density of 2600 W h kg−1.4–6 In addition, sulfur is abundant and cost-effective, making it a feasible candidate for practical use in devices with high energy density.7,8 However, the poor electrical conductivity of sulfur, the large volume expansion (about 80%) during the discharge process, and the loss of active mass due to the dissolution and shuttle effect of lithium polysulfides in the electrolyte greatly suppressed the long-term performance of Li–S batteries and hindered them from further commercialization.9,10Many strategies have been implemented in order to eliminate the loss of the active material to improve the cycle stability and rate performance of Li–S batteries.11 Among them, the fabrication of carbon–sulfur composite has been widely investigated.12 Graphene was predominantly used in the cathode due to its high electrical conductivity, large surface area and versatile structure.13 Compared with graphene, 3D graphene-foam-reduced-graphene-oxide structure increased the sulfur loading to 14.36 mg cm−2 which corresponds to a sulfur content of 89.4 wt%.14 Ding et al. utilized three-dimensional porous polymer frameworks PPN-13 to construct the sulfur loaded cathode and the battery demonstrated an improved performance with a discharge capacity of 606.4 mA h g−1 (S) over 100 cycles at 0.1C.15 Layered carbon with hierarchically porous structure was used as a sulfur host for high rate lithium–sulfur batteries.16 Although premium performance has been obtained, the usage of graphene in Li–S battery cathode suffers from the high cost and complicated preparation process. Carbon materials derived from sustainable biomass, on the other hand, are abundant, inexpensive and suitable for mass production. It can be readily used for large volume production after pyrolysis. Chemical activation by alkali was typically used following the carbonization to produce interconnected mesopores and macropores.17 Corncobs was used to prepare microporous carbon nanosheets after carbonization and activation with KOH, and the battery exhibited a high initial discharge capacity of 1600 mA h g−1 (S), and a retained capacity of 554 mA h g−1 (S) after 50 cycles at 0.1C.18 Pomelo peels was utilized to produce 3D connected activated carbon after thermal carbonization and chemical activation by KOH, and the 60% sulfur loaded nanocomposite showed a high initial discharge capacity of 1258 mA h g−1 (S) at 0.2C, and a retained capacity of 750 mA h g−1 (S) after 100 cycles.19
The performance of biomass-derived carbon–sulfur composite electrode is mostly determined by the microstructure of the carbon material, including the characteristics of biomass, pore structure, surface area, and electrical conductivity. Sugarcane bagasse is an abundant solid waste generated in large quantity in sugar mill plant after the extraction of sucrose, mostly consisting of cellulose, hemicellulose and lignin.20 The application of bagasse in supercapacitors has been reported after hydrothermal treatment to separate cellulose from lignin, followed by carbonization in the presence of KOH.21,22 However, the complex processing process hindered the mass production of this cathode material for commercial lithium–sulfur batteries.
Here in this paper, we explored a facile method to produce lamellar mesoporous carbon by direct carbonization of bagasse, as a novel cathode material for Li–S batteries. This method circumvented the conventional tedious and time consuming hydrothermal and chemical activation treatments mostly reported in the production of bagasse derived carbon for energy storage. The prepared cathode material showed excellent electrochemical performance with good cycling stability, high rate capacity, and high capacity retention even at the current rate of 1C, providing a promising material feasible for commercial mass production of cathode materials for Li–S battery.
2 Experimental
2.1 Synthesis of lamellar carbon
Waste bagasse was dried in the oven at 80 °C for 12 h, and the pyrolysis of dried bagasse was conducted at 900 °C under N2 atmosphere for 2 h with a heating rate of 5 °C min−1. The product was grounded for at least 15 minutes to obtain lamellar mesoporous carbon material with a uniform particle size distribution.Chemical activation was also routinely used to improve the pore structure and surface area of biomass derived activated carbon for energy storage, and the activation was implemented using 3![[thin space (1/6-em)]](https://www.rsc.org/images/entities/char_2009.gif) :
:![[thin space (1/6-em)]](https://www.rsc.org/images/entities/char_2009.gif) 1 KOH (carbon
1 KOH (carbon![[thin space (1/6-em)]](https://www.rsc.org/images/entities/char_2009.gif) :
:![[thin space (1/6-em)]](https://www.rsc.org/images/entities/char_2009.gif) KOH ratio of 1
KOH ratio of 1![[thin space (1/6-em)]](https://www.rsc.org/images/entities/char_2009.gif) :
:![[thin space (1/6-em)]](https://www.rsc.org/images/entities/char_2009.gif) 3) at 800 °C for 1 h.
3) at 800 °C for 1 h.
2.2 Preparation of lamellar carbon–sulfur composites
The bagasse derived lamellar mesoporous carbon was mixed with sulfur in the mass ratio of ms![[thin space (1/6-em)]](https://www.rsc.org/images/entities/char_2009.gif) :
:![[thin space (1/6-em)]](https://www.rsc.org/images/entities/char_2009.gif) mc = 4
mc = 4![[thin space (1/6-em)]](https://www.rsc.org/images/entities/char_2009.gif) :
:![[thin space (1/6-em)]](https://www.rsc.org/images/entities/char_2009.gif) 1. The mixture was placed in a Teflon lined stainless-steel container and kept at 155 °C for 12 hours to impregnate the pores with sulfur, followed by another heat treatment in a tube furnace at 300 °C for 2 hours under N2 atmosphere to remove the excess sulfur on the carbon surface.
1. The mixture was placed in a Teflon lined stainless-steel container and kept at 155 °C for 12 hours to impregnate the pores with sulfur, followed by another heat treatment in a tube furnace at 300 °C for 2 hours under N2 atmosphere to remove the excess sulfur on the carbon surface.
2.3 Preparation of cathode
The lamellar carbon–sulfur composite, super P carbon, and polyvinylidene fluoride (70![[thin space (1/6-em)]](https://www.rsc.org/images/entities/char_2009.gif) :
:![[thin space (1/6-em)]](https://www.rsc.org/images/entities/char_2009.gif) 20
20![[thin space (1/6-em)]](https://www.rsc.org/images/entities/char_2009.gif) :
:![[thin space (1/6-em)]](https://www.rsc.org/images/entities/char_2009.gif) 10) were ground in a mortar using n-methyl-2-pyrrolidinone as solvent for 40 minutes, then the slurry was coated on an Al foil, pressed tight with a roller machine and then polished with a blade. The foil was dried at 50 °C for 6 hours in a vacuum oven, and hand punched into disks with a diameter of 8 mm. A cathode sulfur loading of around 1.6 mg cm−2 was applied in all the tests. All capacity values of the batteries were calculated based on the mass of sulfur.
10) were ground in a mortar using n-methyl-2-pyrrolidinone as solvent for 40 minutes, then the slurry was coated on an Al foil, pressed tight with a roller machine and then polished with a blade. The foil was dried at 50 °C for 6 hours in a vacuum oven, and hand punched into disks with a diameter of 8 mm. A cathode sulfur loading of around 1.6 mg cm−2 was applied in all the tests. All capacity values of the batteries were calculated based on the mass of sulfur.
2.4 Electrochemical measurements
Lithium foil with a diameter of 16 mm was used as the anode, and a commercial polypropylene separator (Cellgard 2400) was used as the separator. A mixture of 1 M lithium bistrifluoromethanesulfonylimide (LiTFSI), 0.2 M LiNO3 dissolved in 1,3-dioxolane (DOL) and 1,2-dimethoxyethane (DME) (1![[thin space (1/6-em)]](https://www.rsc.org/images/entities/char_2009.gif) :
:![[thin space (1/6-em)]](https://www.rsc.org/images/entities/char_2009.gif) 1 by volume) was used as the electrolyte. Coin cells (2032) were fabricated in an argon-filled glove box and cycled between 2.8 and 1.7 V (vs. Li+/Li) at 26 °C using a battery test system (LAND CT2001A, China).
1 by volume) was used as the electrolyte. Coin cells (2032) were fabricated in an argon-filled glove box and cycled between 2.8 and 1.7 V (vs. Li+/Li) at 26 °C using a battery test system (LAND CT2001A, China).
Cyclic voltammetry (CV) was carried out by potential cycling between 3 V and 1.5 V with a sweeping rate of 0.2 mV s−1, and electrochemical impedance spectroscopy (EIS) measurement was conducted in the frequency range of 100 kHz to 100 mHz with an AC amplitude of 5 mV using an electrochemical workstation (Biologic, VSP 300, France).
2.5 Material characterizations
Scanning electron microscope (SEM) measurements were performed using FEI Nova NanoSEM 450 operated at an acceleration voltage of 10 kV after coating the samples with a very thin layer of gold to eliminate charging effect, and EDX spectra were acquired at an acceleration voltage of 20 kV. EDX linear scan was conducted on the Li anode to explore the profile of the anode surface. Transmission electron microscopy (TEM) images were acquired using FEI Tecnai G2 20 TEM. Brunauer–Emmett–Teller (BET) measurements were conducted using automatic specific surface area and porosity analyzer (JW-BK122W, JWGB LTD., China). The crystalline structure of samples was identified by X-ray diffraction analysis (XRD, D/MAX 2550, Rigaku, Japan) using Cu Kα radiation (λ = 1.54 Å), with an operation voltage of 40 kV and current of 300 mA. Thermal gravity analysis (TGA) was performed using TA SDT Q600, with a heating rate of 10 °C min−1. Raman measurements were performed using a Jobin Yvon LabRAM HR800, excited by a 632.8 nm He–Ne laser.3 Results and discussion
3.1 Materials characterization
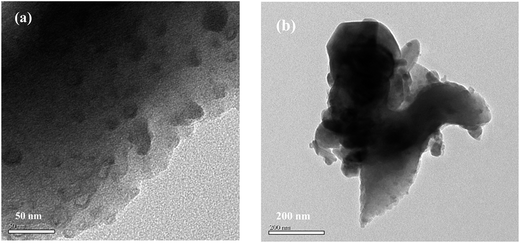
The carbon material derived from the pyrolysis of bagasse showed lamellar morphology in SEM (Fig. 1a and b). No discernable morphology changes were observed after loading with sulfur and further heat treatment at 300 °C, indicating no excess sulfur debris on the exterior surface of the lamellar carbon. However, the sulfur infused inside the mesopores mostly survived from the heating treatment at 300 °C due to hindered diffusion of sulfur and affinity between sulfur and carbon wall.23,24 EDX analysis showed uniform sulfur distribution inside the lamellar mesoporous carbon of the sulfur composite (Fig. 1c), which can be confirmed by the TEM images in Fig. 2. The well dispersion and uniform distribution of sulfur inside the mesopores of the lamellar carbon cathode are critical factors for improving the performance of Li–S batteries.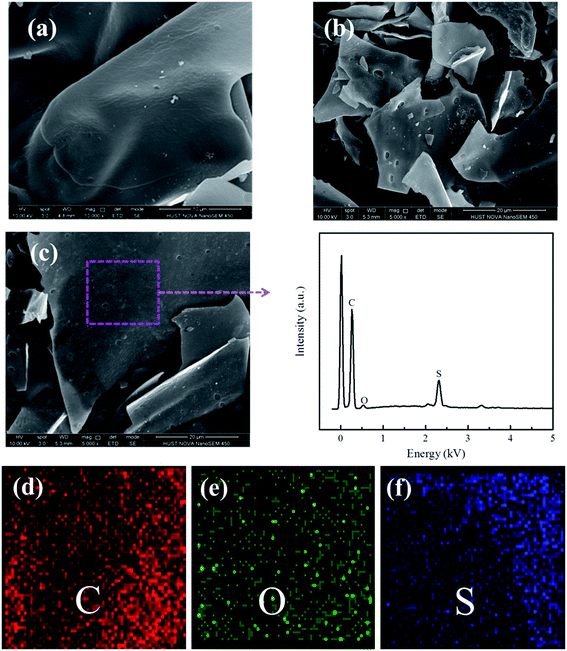 | ||
| Fig. 1 SEM images of the (a) carbon, (b) C/S mixture, (c) elemental analysis, (d) C, (e) O and (f) S elemental mapping of the selected region by EDX. | ||
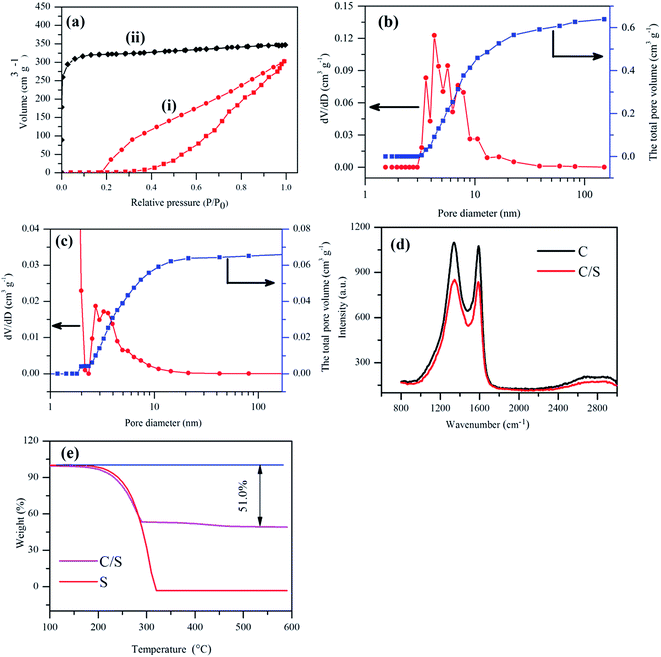
BET measurement showed that the lamellar mesoporous carbon possesses a high surface area of 545 m2 g−1 and a high specific pore volume of 0.64 cm3 g−1 (Fig. 3a and b). The isotherm profile showed a H3-type hysteresis loop, implying a mesoporous structure.25 The BJH pore size distribution showed a wide peak from 2 nm to 10 nm, which was in good accordance with the various pore size seen in TEM images (Fig. 2). The mesoporous lamellar carbon was produced from the intrinsic thin-walled parenchyma cell of sugar cane by direct carbonization without the widely adopted chemical activation process, and the presence of polar chemical defect sites, as confirmed by the presence of oxygen in EDX analysis and disordered carbon in Raman spectra, were believed to be formed on the carbon material during pyrolysis, which was beneficial to retain the polysulfides during the charge–discharge process. It has been demonstrated that high density of defects containing carbon onto sacrificial porous silicon templates could effectively confine the polysulfides during the charge–discharge process.26 The chemical defects on carbon nanohorn also demonstrated the capability to confine the polysulfides during electrochemical process and improved the performance of the batteries.27 Similarly, the bagasse-derived carbon was expected to provide chemical defective sites as highly polar pinning sites for polar soluble polysulfides. The size of mesoporous structure also enlarged the contact area between electrode and electrolyte together with the availability of fully covered polar sites to promote the confinement of soluble polysulfides, which were beneficial for high stability and fast kinetics of Li–S battery, as confirmed by the excellent electrochemical performance in the following tests.
The degree of graphitization of the lamellar carbon and the C/S mixture were measured by Raman spectroscopy (Fig. 3c). The ID/IG ratio of the carbon was 1.013, revealing a sufficient degree of graphitization for high electrical conductivity,28,29 which was especially beneficial to retain a high capacity at a high current rate. After the addition of sulfur, the ID/IG ratio in Raman spectra decreased slightly to 1.009. The high electrical conductivity indicated that there was little change in the material structure during sulfur encapsulation, which was beneficial for the performance stability. The TGA results in Fig. 3d showed that the content of sulfur in the C/S mixture was 51%, which was used for the capacity calculations.
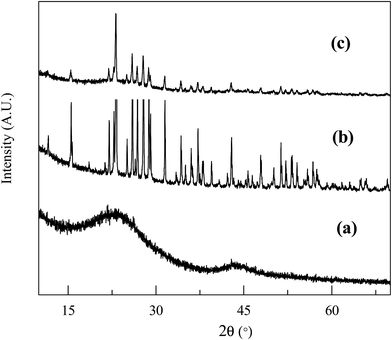
The crystallographic structures of carbon, sulfur and the C/S mixture were analyzed using XRD (Fig. 4). The bagasse derived carbon exhibited two weak and broad peaks at 22.8° and 43.2°, indicating activated carbon like structure.30 After encapsulation of sulfur inside the pores of lamellar sheets, it presented well defined but weak peaks, confirming the incorporation of well dispersed sulfur inside the pores.
3.2 Performance of the lamellar carbon–sulfur cathode
The electrochemical performance of the bagasse derived lamellar carbon based cathodes was evaluated using CV after 0.1C rate test for 200 cycles (Fig. 5a) and after 1C rate test for 180 cycles (Fig. 5b) respectively. It displayed two reduction peaks at around 2.34 V and 2.02 V in the cathodic scan, corresponding to the two discharge plateaus as presented in Fig. 5c. The peak found at 2.34 V was related to the open ring reduction of sulfur (S8) to the soluble lithium polysulfides (Li2Sx, 4 ≤ x ≤ 8), and the peak at 2.02 V was attributable to the reduction of high order lithium polysulfides to Li2S2 and Li2S.9,10 There was no apparent shift of the two cathodic peaks, but a small positive shift of the anodic peak in the voltammetry sweeps carried out after 0.1C rate and a small negative shift of anodic peak in CV after rate test, which were related to the activation process caused by the first cyclic redox reaction.31 In the following potential sweeps, the anodic and cathodic curves were overlapped, implying high reversibility of the electrode.32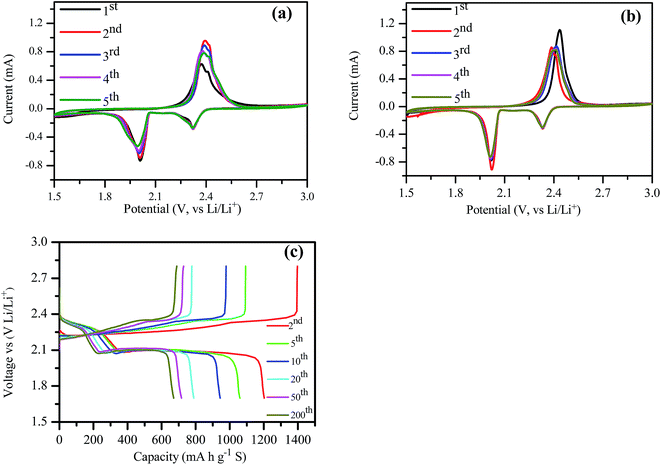 | ||
| Fig. 5 CV of the cathode after (a) 200 cycles at 0.1C rate, (b) CV after rate cycles, and (c) charge–discharge profiles of the battery at 0.1C rate. | ||
From the charge–discharge profiles of the battery at 0.1C rate (Fig. 5c), it can be observed that the discharge capacity of the second cycle was 1202 mA h g−1 (S), and the cathode convertible capacity retained at 670 mA h g−1 (S) after 200 cycles. It was apparent that there were two discharge plateaus and a single charge plateau, which corresponded to the peaks from the CV curve. The charge–discharge potential difference (ΔE) of the batteries remained almost constant with increased number of charge–discharge cycles, indicating excellent cycle reversibility of these batteries. Meanwhile, the ΔE increased slightly with the increased number of charge–discharge cycles.
The cycle stability tests at 0.1C and 1C were presented in Fig. 6a and b. It can be seen that the second cycle capacity of battery was 1202 mA h g−1 (S), and the capacity remained as high as 670 mA h g−1 (S) after 200 cycles with 48.6% capacity retention, implying a capacity loss of 0.26% per charge–discharge cycle (Fig. 6a). The capacity decayed rapidly in the first 15 cycles from 1202 to 895 mA h g−1 (S), which was affected by the presence of few residual sulfur on the external surface of the lamellar carbon. The capacity decreased slowly in the following cycles. With an increased current density at 1C, the capacity of the batteries became lower. A more stable capacity of 494 mA h g−1 (S) was obtained after 180 cycles at the current density of 1C, indicating that the battery exhibited high cycling stability especially at high current density.
 | ||
| Fig. 6 The cycle performance of the batteries with current rate of (a) 0.1C and (b) 1C for (i) pristine lamellar carbon and (ii) lamellar carbon after chemical activation. | ||
The rate capacities of Li–S batteries at different current rates were compared in Fig. 7. The C/S cathode exhibited excellent performance at different current densities. The initial discharge capacity of around 953 mA h g−1 (S) was obtained at 0.1C. When the current density increased to 0.2C, 0.5C, 1C, and 2C, the initial discharge capacity decreased to 651, 548, 492 and 460 mA h g−1 (S) respectively. When the current rate was switched back to 0.1C, a reversible capacity of 604 mA h g−1 (S) was achieved, confirming excellent electrode stability. The electrode stability can be attributed to the unique mesoporous structure inherited from the intrinsic structure of sugar cane with most pores distributed between 2 to 10 nm, and an ideal pore size distribution to entrap polysulfides and inhibit the shuttling effect. After chemical activation, the specific surface area was almost doubled (984 m2 g−1), but the pore size distribution was dominated by micropores, and the pore volume of mesopores decreased to one fifth of the original value (Fig. 3b). Surprisingly, the KOH activated lamellar carbon demonstrated poor discharge capacity and low rate capacity (Fig. 6 and 7). This could be attributed to the enlargement of carbon material pores from mesopores to macropores, and the generation of micropores, hence losing part of the favorable interaction between polar defect terminated surface and polysulfides in a larger pore volume for improved stability. The transport of lithium ions into the micropores inside submicron thick lamellar carbon was greatly hindered and the insoluble polysulfides trapped inside the micropores became inaccessible to the electrolyte,33 in contrast to improved supercapacitor performance after KOH activation benefited from the much thinner wall of aerogel structure after the hydrothermal extraction process.34,35 This is in agreement with the report that commercial microporous activated carbon demonstrated low specific capacity due to the long and tortuous pores as a poor host for electrochemical active sulfur.34
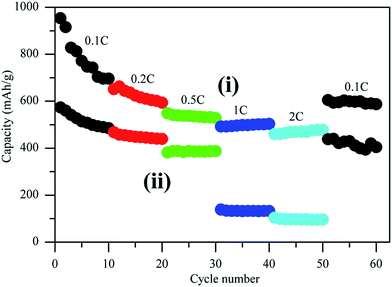 | ||
| Fig. 7 Cathodes rate capability of Li–S batteries cycled between 1.7 and 2.8 V (versus Li/Li+) prepared with (i) pristine lamellar carbon and (ii) lamellar carbon after chemical activation. | ||
The AC impedance of the Li–S batteries after 200 cycles at 0.1C and rate cycles was studied and the Nyquist plots are presented in Fig. S1.† There are two semicircles in the high to medium frequency region and a straight line in the low frequency region. The first semicircle can be assigned to the resistance of solid electrolyte interface (SEI) film and the second semicircle was related to the charge-transfer resistance.25 An equivalent circuit was drawn to fit the Nyquist plot (inset of Fig. S1†). The internal resistances were 6.91 Ω after rate cycles and 7.66 Ω after 200 cycles at 0.1C, implying low internal resistance35 and high electrical conductivity of the cathode, which was beneficial for the rate stability of the batteries.
3.3 Cathodes and anodes analysis after cycle test
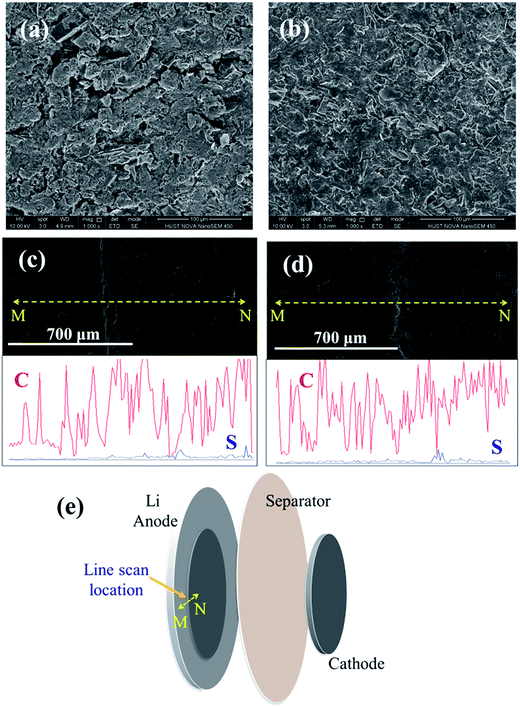
The surface morphology of the cathode was measured after 200 cycles at 0.1C rate and after rate cycles, respectively, and the morphology showed distinct difference (Fig. 8a and b). After 200 cycles at 0.1C, the cathode showed some prominent cracks compared with the cathode after rate cycles at 0.2C, 0.5C, 1C and 2C. EDX linear scan (Fig. 8e) showed that the thickness of the anode central area (labeled as N in Fig. 8e) decreased slightly compared to the edge area (labeled as M in Fig. 8e), matching with the projection area of the cathode, which can be attributed to mechanical impact by the cathode during battery assembling. The content of sulfur increased in the region opposite to the cathode (label N in Fig. 8e) after cycling at 0.1C rate (Fig. 8c). After rate test, the content of sulfur increased first and then decreased when scanned from outer edge to the region opposite to the cathode as shown in Fig. 8d, indicating non-uniform distribution of sulfur on the electrode. The accumulation of sulfur was associated with the formation of lithium dendrites. During battery charge and discharge, lithium polysulfides transferred from cathode to the anode and deposited as lithium dendrites and elemental sulfur in the region of anode opposite to the cathode, and the deposition layer became non-uniform after cycling especially at high current rates. However the overall average sulfur content was less than 3% evaluated from the EDX analysis, indicating effective inhibition of shuttling effect using the mesoporous lamellar carbon as the cathode.4 Conclusions
In this paper, a novel processing method was proposed for the facile production of lamellar mesoporous carbon as cathode materials for Li–S batteries from direct carbonization of waste bagasse. The unique highly mesoporous structure and the desirable pore size distribution were produced without routine chemical activation, and the mesoporous structure was beneficial for the cycle stability and rate performance of the sulfur cathode. High sulfur content of 51 wt% and high sulfur loading of 1.6 mg cm−2 of the cathode were achieved after incorporation of sulfur into the mesoporous structure. The special lamellar mesoporous structure of the carbon cathode enhanced the entrapment of the lithium polysulfides and accommodated the drastic volume change during battery cycling. The batteries delivered a high initial reversible capacity of 1202 mA h g−1 (S) at 0.1C and retained a discharge capacity of 494 mA h g−1 (S) after 180 cycles at 1C. The good performance of capacity retention and high rate capacity can be attributed to the high conductivity and the unique mesoporous structure of the lamellar graphitic carbon derived from the intrinsic thin-walled parenchyma cell of sugar cane. This work provides a low cost and green method for the facile preparation of the lamellar mesoporous carbon, applicable for the mass production of cathode materials for advanced Li–S batteries with high energy storage capacities.Acknowledgements
The authors would like acknowledge the financial supports from National Program on Key Basic Research of China (973 Program, 2015CB258400), the National Thousand Young Talents Program, Natural Science Foundation of China (51508213), key project of Hubei Provincial Natural Science Foundation (2014CFA109), Innovative and Interdisciplinary Team at HUST (0118261077), and Independent Innovation Foundation of HUST – Exploration Fund (2014TS092). The authors would like to thank Dr Huijie Hou for her help in the preparation of this manuscript, the Analytical and Testing Center of Huazhong University of Science and Technology for providing the facilities to fulfill the experimental measurements, especially Mr Jinjin Wu for his assistant with SEM measurements.References
- N. L. Panwar, S. C. Kaushik and S. Kothari, Renewable Sustainable Energy Rev., 2011, 15, 1513–1524 CrossRef.
- G. Jeong, Y. U. Kim, H. Kim, Y. J. Kim and H. J. Sohn, Energy Environ. Sci., 2011, 4, 1986 CAS.
- P. G. Bruce, S. A. Freunberger, L. J. Hardwick and J. M. Tarascon, Nat. Mater., 2012, 11, 19–29 CrossRef CAS PubMed.
- Z. Li, Y. Huang, L. Yuan, Z. Hao and Y. Huang, Carbon, 2015, 92, 41–63 CrossRef CAS.
- V. A. Agubra, L. Zuniga, D. Flores, J. Villareal and M. Alcoutlabi, Electrochim. Acta, 2016, 192, 529–550 CrossRef CAS.
- R. Younesi, G. M. Veith, P. Johansson, K. Edström and T. Vegge, Energy Environ. Sci., 2015, 8, 1905–1922 CAS.
- A. Fotouhi, D. J. Auger, K. Propp, S. Longo and M. Wild, Renewable Sustainable Energy Rev., 2016, 56, 1008–1021 CrossRef CAS.
- B. Scrosati, J. Hassoun and Y. K. Sun, Energy Environ. Sci., 2011, 4, 3287 CAS.
- M. Wild, L. O'Neill, T. Zhang, R. Purkayastha, G. Minton, M. Marinescu and G. J. Offer, Energy Environ. Sci., 2015, 8, 3477–3494 CAS.
- L. Ma, K. E. Hendrickson, S. Wei and L. A. Archer, Nano Today, 2015, 10, 315–338 CrossRef CAS.
- W. Li, Q. Zhang, G. Zheng, Z. W. Seh, H. Yao and Y. Cui, Nano Lett., 2013, 13, 5534–5540 CrossRef CAS PubMed.
- J. G. Wang, K. Xie and B. Wei, Nano Energy, 2015, 15, 413–444 CrossRef CAS.
- B. Papandrea, X. Xu, Y. Xu, C. Y. Chen, Z. Lin, G. Wang, Y. Luo, M. Liu, Y. Huang, L. Mai and X. Duan, Nano Res., 2016, 9, 240–248 CrossRef.
- G. Hu, C. Xu, Z. Sun, S. Wang, H. M. Cheng, F. Li and W. Ren, Adv. Mater., 2016, 28, 1603–1609 CrossRef CAS PubMed.
- K. Ding, Q. Liu, Y. Bu, K. Meng, W. Wang, D. Yuan and Y. Wang, J. Alloys Compd., 2016, 657, 626–630 CrossRef CAS.
- Y. Wei, Y. Tao, C. Zhang, J. Wang, W. Qiao, L. Ling and D. Long, Electrochim. Acta, 2016, 188, 385–392 CrossRef CAS.
- S. Dutta, A. Bhaumik and K. C. Wu, Energy Environ. Sci., 2014, 7, 3574–3592 CAS.
- J. Guo, J. Zhang, F. Jiang, S. Zhao, Q. Su and G. Du, Electrochim. Acta, 2015, 176, 853–860 CrossRef CAS.
- J. Zhang, J. Xiang, Z. Dong, Y. Liu, Y. Wu, C. Xu and G. Du, Electrochim. Acta, 2014, 116, 146–151 CrossRef CAS.
- G. Várhegyi, M. J. Antal, T. Szekely and P. Szabo, Energy Fuels, 1989, 3, 329–335 CrossRef.
- H. Feng, H. Hu, H. Dong, Y. Xiao, Y. Cai, B. Lei, Y. Liu and M. Zheng, J. Power Sources, 2016, 302, 164–173 CrossRef CAS.
- P. Hao, Z. Zhao, J. Tian, H. Li, Y. Sang, G. Yu, H. Cai, H. Liu, C. P. Wong and A. Umar, Nanoscale, 2014, 6, 12120–12129 RSC.
- Z. Sun, S. Wang, L. Yan, M. Xiao, D. Han and Y. Meng, J. Power Sources, 2016, 324, 547–555 CrossRef CAS.
- T. S. Kim and R. H. Dauskardt, Nano Lett., 2010, 10, 1955–1959 CrossRef CAS PubMed.
- J. Li, F. Qin, L. Zhang, K. Zhang, Q. Li, Y. Lai, Z. Zhang and J. Fang, J. Mater. Chem. A, 2014, 2, 13916 CAS.
- R. Carter, D. Ejorh, K. Share, A. P. Cohn, A. Douglas, N. Muralidharan, T. M. Tovar and C. L. Pint, J. Power Sources, 2016, 330, 70–77 CrossRef CAS.
- L. Oakes, R. Cartera and C. L. Pint, Nanoscale, 2016, 8, 19368–19375 RSC.
- F. Tuinstra, J. Chem. Phys., 1970, 53, 1126 CrossRef CAS.
- T. Bordjiba, M. Mohamedi and L. H. Dao, J. Power Sources, 2007, 172, 991–998 CrossRef CAS.
- G. Xu, J. Han, B. Ding, P. Nie, J. Pan, H. Dou, H. Li and X. Zhang, Green Chem., 2015, 17, 1668–1674 RSC.
- K. Yang, Q. Gao, Y. Tan, W. Tian, W. Qian, L. Zhu and C. Yang, Chemistry, 2016, 22, 3239–3244 CrossRef CAS PubMed.
- J. Wang, S. Cheng, W. Li, S. Zhang, H. Li, Z. Zheng, F. Li, L. Shi, H. Lin and Y. Zhang, J. Power Sources, 2016, 321, 193–200 CrossRef CAS.
- R. Singhal, S. H. Chung, A. Manthiram and V. Kalra, J. Mater. Chem. A, 2015, 3, 4530–4538 CAS.
- J. Lee, Y. Zhao, S. Thieme, H. Kim, M. Oschatz, L. Borchardt, A. Magasinski, W. Cho, S. Kaskel and G. Yushin, Adv. Mater., 2013, 25, 4573–4579 CrossRef CAS PubMed.
- Y. Cheng, S. Ji, X. Xu and J. Liu, RSC Adv., 2015, 5, 100089–100096 RSC.
Footnote |
| † Electronic supplementary information (ESI) available. See DOI: 10.1039/c6ra26531f |
| This journal is © The Royal Society of Chemistry 2017 |

