
 Open Access Article
 This Open Access Article is licensed under a
 Creative Commons Attribution 3.0 Unported Licence
The effect of doping temperature on the nitrogen-bonding configuration of nitrogen-doped graphene by hydrothermal treatment†
Jun-ho Song a,
Chang-Min Kima,
Euntae Yanga,
Moon-Ho Hamb and
In S. Kim*ac
a,
Chang-Min Kima,
Euntae Yanga,
Moon-Ho Hamb and
In S. Kim*ac
aSchool of Earth Sciences and Environmental Engineering, Gwangju Institute of Science and Technology (GIST), 123 Cheomdangwagi-ro, Buk-gu, Gwangju 61005, Korea. E-mail: iskim@gist.ac.kr
bSchool of Materials Science and Engineering, Gwangju Institute of Science and Technology (GIST), 123 Cheomdangwagi-ro, Buk-gu, Gwangju 61005, Korea
cGlobal Desalination Research Center (GDRC), Gwangju Institute of Science and Technology (GIST), 123 Cheomdangwagi-ro, Buk-gu, Gwangju 61005, Korea
First published on 11th April 2017
Abstract
Nitrogen-doped graphene was synthesized by hydrothermal treatment of graphene oxide with ammonia at different doping temperatures. As the doping temperature increased, each type of nitrogen-bonding showed different tendencies. There was a high proportion of pyrrolic-N, but the proportion was relatively lower with temperature. Despite its smaller content, pyridinic-N plays a prominent part.
Graphene is a two-dimensional (2D) carbon material, a flat monolayer of carbon atoms arranged on a honeycomb lattice.1 Since graphene has finally been divulged, it has received continuous attention as a promising material in all research areas owing to its unique properties, such as high electrical and thermal conductivity,2,3 high Young's modulus,4 large specific surface area,5 and good optical transmittance.6 Graphene derived from liquid-phase exfoliation of graphite though the ultrasonication process has wide application, but it has uncertain scalability and a low production rate.7 To overcome these limitations, graphene oxide (GO), which is an oxidized form of pristine graphene, has been well utilized in experiments as a raw material instead of pristine graphene because it allows large-scale production, the potential of cost-effectiveness, and easy transformation.8,9 However, in the process of oxidation, sp2 networks in graphene are partially broken and an sp3 bond is formed simultaneously.10 Moreover, the various functional groups such as hydroxyl, epoxy, carboxyl, and ketone groups are built through a covalent bond at the basal plane and edge of graphene, so it can be more reactive.11 Through these structural transitions, graphene lost its intrinsic properties and gained a remarkable obstacle to moving electrons. The key to recovering this electrical characteristic is modulating properties using chemical doping with nitrogen which has one more valence electron, high electronegativity and a comparable atomic size to carbon, e.g. C–C bond (1.42 Å), C–N bond (1.41 Å).12,13 In this approach, the nitrogen gives three different bonding configurations; pyridinic-N, pyrrolic-N, and graphitic-N. These three types of bonding have different behaviours for application.13–15 Until now, several doping techniques have been employed: for example, chemical vapour deposition (CVD),16,17 thermal annealing,18 plasma treatment,19,20 arc-discharge,21,22 and hydrothermal treatment.23–26 In the case of hydrothermal treatment, although it is hard to expect high quality compared with the other methods, it has been utilized for the preparation of nanomaterials in the laboratory due to its benefits such as easy operation, relatively mild synthesis conditions (low energy consumption), and comparative mass production (high yield).25,27–29
According to previous studies, chemical doping with nitrogen, called nitrogen doping (N-doping), via hydrothermal treatment is influenced by doping temperature and time. D. Long et al. prepared nitrogen doped graphene (NG) by a combined chemical and hydrothermal method by adding ammonia and hydrazine hydrate as reducing agents at 80–200 °C for 3 h. They reported that nitrogen and pyridinic-N contents increase and decrease, respectively, as doping temperature increases.24 G. Wang et al. also prepared nitrogen doping with ammonia under mild conditions at 60–180 °C for 5 h. They demonstrated that nitrogen and pyridinic-N contents increase along with doping temperature.25 On the other hand, F. M. Hassan et al. reported that pyrrolic-N is a dominant and influential type for electrical properties. However, both pyrrolic-N and nitrogen contents shrink with increasing temperature. They obtained NG using ammonia and hydrazine at 80–180 °C for 3 h.26 These experimental studies gave different nitrogen and types of nitrogen bond contents at different doping temperatures below 200 °C for 3 or 5 hours and their outcomes show the diversity of opinion concerning which type of nitrogen bonding could have more influence on the electrical properties of NG depending on the temperature variable.
In this paper, we synthesize NG by hydrothermal treatment under ammonia at a relatively higher temperature than previously, and systematically demonstrate that doping temperature impacts on the nitrogen bonding configuration and electrical performance using various characterization techniques and simple measurements – Raman spectroscopy (NRS-5100, Jasco Inc, USA (532.13 nm of laser wavelength)), Fourier transform-infrared spectroscopy (FT-IR, Spectrum 400, PerkinElmer, USA), X-ray photoelectron spectroscopy (XPS, VG Microtech MultiLab ESCA 2000, Thermo VG Scientific, United Kingdom), and four-point probe (FPP, CMT-SR2000, Changmin Tech Co., Ltd, Korea).
To obtain the nitrogen-doped graphene (NG) synthesized by a hydrothermal process, 10 mL of graphene oxide (GO) solution (6.2 mg mL−1, Graphene supermarket, US) was used as a precursor and sonicated for 1 h. Sequentially, 60 mL of ammonia solution (25 wt% in water) as a nitrogen source was added, and the ammonia-containing dispersion was then transferred into a Teflon-lined stainless steel autoclave and placed in a furnace at 160, 190, 220, 250, or 280 °C for 3 h. The synthesized NG precipitate was washed with deionized water (DI) and dried in a desiccator at 60 °C under vacuum overnight to eliminate the ammonia solution. The obtained NG powders were denoted as NG-p-x, where x represents the doping temperature. To make the NG solution (0.5 mg mL−1), NG powder was dispersed in N,N-dimethylformamide (DMF, Sigma-Aldrich, USA) with polyacrylonitrile (PAN, 0.5 wt%, Sigma-Aldrich, USA) to promote adhesion between the graphene sheets and the substrate. Then, the NG solution was vacuum-filtered onto a porous ceramic membrane (Al2O3, 0.1 μm, 47 mm, Whatman, Germany) for analysis.30 The resulting sample was submerged in DI to remove the residue and was then dried in the air. The filtrated samples were denoted as NG-x, where x represents the doping temperature.
To evaluate the grade of structural distortion on the graphene lattice, Raman spectroscopy measurements were performed; the results are shown in Fig. 1. The prominent features are the G and D bands appearing at around 1590 and 1350 cm−1, respectively, due to the intrinsic dispersion of the π-electrons in graphene.31 The G band, commonly observed for all carbon based nanomaterials, is attributed to bond stretching of all pairs of sp2 carbon networks in both rings and chains, whereas the D band, which is proof of the existence of defects, arises from the breathing modes of sp2 atoms in rings.16 Also, the D band is highly related to disorder in the graphene sheet induced by the attachment of hydroxyl and epoxide groups, and N-doping. The relative intensity of the D band to the G band (ID/IG) provides the level of disorder and degree of restoration of the sp2 rings.32 As shown in Fig. 1, ID/IG, the bandwidth of D and G, and the position of the G peak were higher and smaller than those of the GO-p sample. In detail, the value for ID/IG increased from 1.049 for GO-p to 1.149, 1.156, 1.217, 1.240, and 1.264 for NG-p samples. By increasing the doping temperature, the higher ID/IG, broader width of the D band, and narrower width of the G band in NG-p (Table S1†) suggest that the NG-p possesses an amount of defective sites and that the bonding structure difference including covalent bonds (e.g., C–O, C–N) in the graphene lattice is caused by the N-doping and insufficient reduction.32 The G band was shifted from 1592 cm−1 for GO-p to 1582, 1584, 1585, 1589, and 1587 cm−1 for NG-p-160, 190, 220, 250 and 280, indicating a renovation of the adjacent construction of GO-p by N-doping with the hydrothermal treatment. In addition, the shift of the G band in NG-p could be associated with the electron-donating capability of nitrogen.33,34 These results could imply that N-doping was successful and that structural defects grew larger with an increase in the investigated doping temperature. Moreover, the FT-IR spectra of all samples were used to indicate the existence of bonding through a comparative analysis between GO and NG (Fig. 2). In the case of GO-p, the peaks at 1037, 1155, 1614, 1728, and 3157 cm−1 corresponded to hydroxyl C–O, epoxy C–O, aromatic C![[double bond, length as m-dash]](https://www.rsc.org/images/entities/char_e001.gif) C, carboxyl CO, and hydroxyl O–H, respectively.35,36 Of these, the broad peak at 3157 cm−1 was related to the O–H stretching vibration and oxygen-functional groups in GO-p.37 For NG-p, besides the GO-p peaks, new peaks were observed at 1258 cm−1 and at 1542 cm−1 which were attributed to C–N stretching vibrations and the N–H bend vibration generated by N-doping. It is not easy to discern the presence of C–N and C
C, carboxyl CO, and hydroxyl O–H, respectively.35,36 Of these, the broad peak at 3157 cm−1 was related to the O–H stretching vibration and oxygen-functional groups in GO-p.37 For NG-p, besides the GO-p peaks, new peaks were observed at 1258 cm−1 and at 1542 cm−1 which were attributed to C–N stretching vibrations and the N–H bend vibration generated by N-doping. It is not easy to discern the presence of C–N and C![[triple bond, length as m-dash]](https://www.rsc.org/images/entities/char_e002.gif) N because of the overlap of two adjacent peaks for C–O and CC, but it exists in the NG-p samples. By increasing the doping temperature, the peaks related to all of the oxygen-functional groups declined, particularly the O–H stretching vibration. This implied that the degree of reduction determined by the doping temperature is likely to eliminate obstacles on the graphene sheet to electric current. XPS was used to characterize the extent of nitrogen doping and reduction by quantitatively analysing the elemental composition of the sensitivity. Apparently, a nitrogen peak can be observed in the survey spectra of NG-p (Fig. 3a), suggesting that nitrogen has been successfully incorporated into carbon sheets, and the atomic% of C, N, O components in GO-p and NG-p samples based on the result of XPS analysis (Fig. 3b). A C 1s peak at the binding energy of around 285 eV was observed in all samples, presenting at 73.60, 76.53, 74.63, 78.98, and 83.48 at% for each of the NG-p samples. As shown in Fig. 3c and S3,† the high resolution C 1s spectra of samples made by GO-p and NG-p further confirm the N-doping and reduction of GO. The components of the C 1s spectrum of GO-p and NG-p located at around 285.02, 286.47, 287.84, 289.45, and 291.69 eV can be assigned to C in C–C, C–O, CO, O–CO, and shake-up which is attributed modelling error, respectively.37 After N-doping, the dominant C–O peaks in GO-p decreased remarkably. It is assumed that nitrogen is mainly responsible for the reaction with C–O groups to form C–N bonds. However, the peaks of the C–O bond (286.7 eV) and C–N bond (286.2 eV) were hard to distinguish in the NG-p samples because of their similar binding energy. Not only the C and N connection, but that between the N and O also have a close relation (Fig. 3b). The N at% of the sample is in the range of 6.37, 6.82, 8.23, 9.04 and 7.28 accompanied by a decrease in O at% to 20.03, 16.63, 17.14, 11.98, and 9.23 from NG-p-160 to 280, respectively, representing the different reactions that may occur between GO and ammonia solution with doping temperature. In other words, a slight decrease in the O 1s peak around 530 eV is observed with an increase in the doping temperature, indicating N-doping and a simultaneous reduction of GO.37 Fig. 3e and S4† show that bonding configurations of nitrogen substituted into the graphene lattice were observed by N 1s core-level spectra. The deconvolution of N 1s of NG-p yields three major components from pyridinic-N (∼398.4 eV), pyrrolic-N (∼399.9 eV), and graphitic-N (∼401.06 eV).13–15 Pyridinic-N and pyrrolic-N that bonded to two C atoms with one N atom donated one and two p-electrons to the π network system, respectively. Graphitic-N connecting three C atoms results from the substitution of a C atom by an N atom in the graphene lattice. The distribution of N-bonding configurations obtained from the peak area by temperature is presented in Fig. 3f. The pyrrolic-N predominates among the three types, but, it was less linear than pyridinic-N with elevated doping temperature. It is assumed that there is an intimate relation between pyridinic-N and doping temperature in hydrothermal treatment. The N-doping and reduction led to an improvement in the electrical properties of NG, as shown in Fig. 4. The filtrated NG sheets on the ceramic substrate (Fig. S2†) were examined by a four-point probe (FPP), which is a simple device for measuring the resistivity of semiconductor samples. In practice, the FPP was used on seven spots randomly selected on three samples each. As for the before-doping case, the GO sheet was electrically insulating which corresponds to about 4.07 × 10⁶ ± 1.7 × 10⁵ ohm sq−1 as a sheet resistance. This value is over 4000 times higher than that of NG-280 which has the lowest value of about 9.5 × 10³ ± 6.3 × 10² ohm sq−1. The other values at the investigated temperatures are also better than that of GO. Moreover, only N-doping without a reduction effect is verified through the sheet resistance gap value between NG and rGO (Fig. 4). At a relatively high temperature, the value of NG dwindles whereas that of rGO is maintained at a constant level. The above results are sufficient evidence to show that nitrogen substituted into the graphene lattice certainly improves the electrical characteristics over those of GO and rGO. Then, there is a correlation between increasing doping temperature and decreasing sheet resistance.
N because of the overlap of two adjacent peaks for C–O and CC, but it exists in the NG-p samples. By increasing the doping temperature, the peaks related to all of the oxygen-functional groups declined, particularly the O–H stretching vibration. This implied that the degree of reduction determined by the doping temperature is likely to eliminate obstacles on the graphene sheet to electric current. XPS was used to characterize the extent of nitrogen doping and reduction by quantitatively analysing the elemental composition of the sensitivity. Apparently, a nitrogen peak can be observed in the survey spectra of NG-p (Fig. 3a), suggesting that nitrogen has been successfully incorporated into carbon sheets, and the atomic% of C, N, O components in GO-p and NG-p samples based on the result of XPS analysis (Fig. 3b). A C 1s peak at the binding energy of around 285 eV was observed in all samples, presenting at 73.60, 76.53, 74.63, 78.98, and 83.48 at% for each of the NG-p samples. As shown in Fig. 3c and S3,† the high resolution C 1s spectra of samples made by GO-p and NG-p further confirm the N-doping and reduction of GO. The components of the C 1s spectrum of GO-p and NG-p located at around 285.02, 286.47, 287.84, 289.45, and 291.69 eV can be assigned to C in C–C, C–O, CO, O–CO, and shake-up which is attributed modelling error, respectively.37 After N-doping, the dominant C–O peaks in GO-p decreased remarkably. It is assumed that nitrogen is mainly responsible for the reaction with C–O groups to form C–N bonds. However, the peaks of the C–O bond (286.7 eV) and C–N bond (286.2 eV) were hard to distinguish in the NG-p samples because of their similar binding energy. Not only the C and N connection, but that between the N and O also have a close relation (Fig. 3b). The N at% of the sample is in the range of 6.37, 6.82, 8.23, 9.04 and 7.28 accompanied by a decrease in O at% to 20.03, 16.63, 17.14, 11.98, and 9.23 from NG-p-160 to 280, respectively, representing the different reactions that may occur between GO and ammonia solution with doping temperature. In other words, a slight decrease in the O 1s peak around 530 eV is observed with an increase in the doping temperature, indicating N-doping and a simultaneous reduction of GO.37 Fig. 3e and S4† show that bonding configurations of nitrogen substituted into the graphene lattice were observed by N 1s core-level spectra. The deconvolution of N 1s of NG-p yields three major components from pyridinic-N (∼398.4 eV), pyrrolic-N (∼399.9 eV), and graphitic-N (∼401.06 eV).13–15 Pyridinic-N and pyrrolic-N that bonded to two C atoms with one N atom donated one and two p-electrons to the π network system, respectively. Graphitic-N connecting three C atoms results from the substitution of a C atom by an N atom in the graphene lattice. The distribution of N-bonding configurations obtained from the peak area by temperature is presented in Fig. 3f. The pyrrolic-N predominates among the three types, but, it was less linear than pyridinic-N with elevated doping temperature. It is assumed that there is an intimate relation between pyridinic-N and doping temperature in hydrothermal treatment. The N-doping and reduction led to an improvement in the electrical properties of NG, as shown in Fig. 4. The filtrated NG sheets on the ceramic substrate (Fig. S2†) were examined by a four-point probe (FPP), which is a simple device for measuring the resistivity of semiconductor samples. In practice, the FPP was used on seven spots randomly selected on three samples each. As for the before-doping case, the GO sheet was electrically insulating which corresponds to about 4.07 × 10⁶ ± 1.7 × 10⁵ ohm sq−1 as a sheet resistance. This value is over 4000 times higher than that of NG-280 which has the lowest value of about 9.5 × 10³ ± 6.3 × 10² ohm sq−1. The other values at the investigated temperatures are also better than that of GO. Moreover, only N-doping without a reduction effect is verified through the sheet resistance gap value between NG and rGO (Fig. 4). At a relatively high temperature, the value of NG dwindles whereas that of rGO is maintained at a constant level. The above results are sufficient evidence to show that nitrogen substituted into the graphene lattice certainly improves the electrical characteristics over those of GO and rGO. Then, there is a correlation between increasing doping temperature and decreasing sheet resistance.
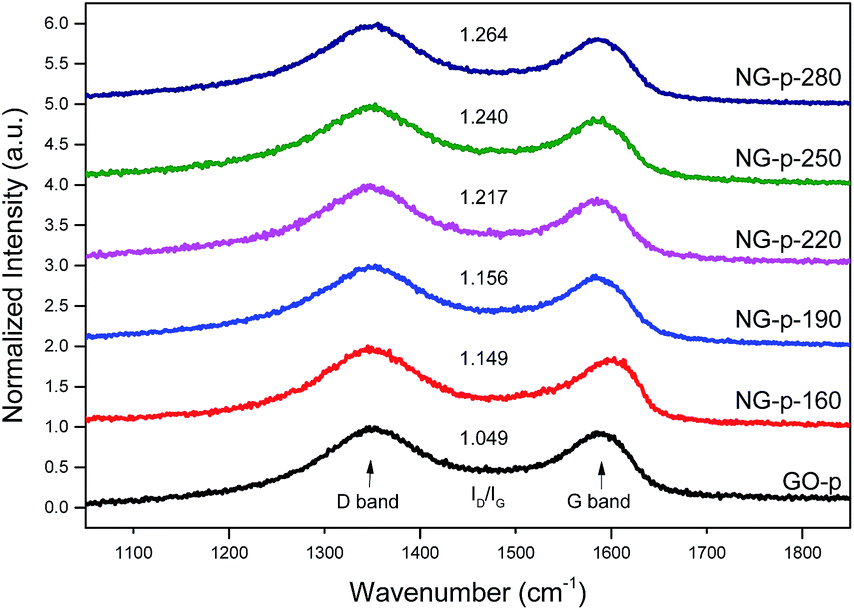 | ||
| Fig. 1 Normalized Raman spectra of GO and NG powders. ID/IG values are also shown for each spectrum. | ||
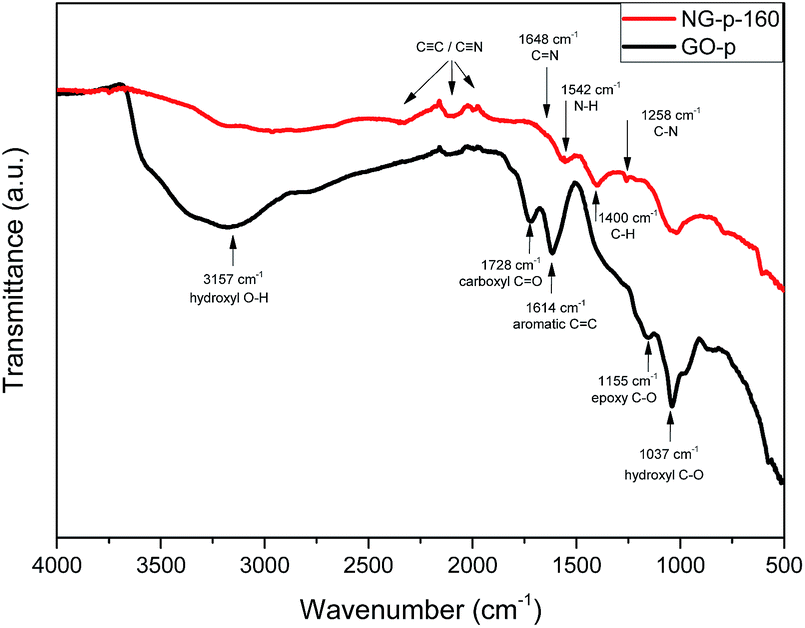 | ||
| Fig. 2 Representative FT-IR spectra of GO-p and NG-p-160. | ||
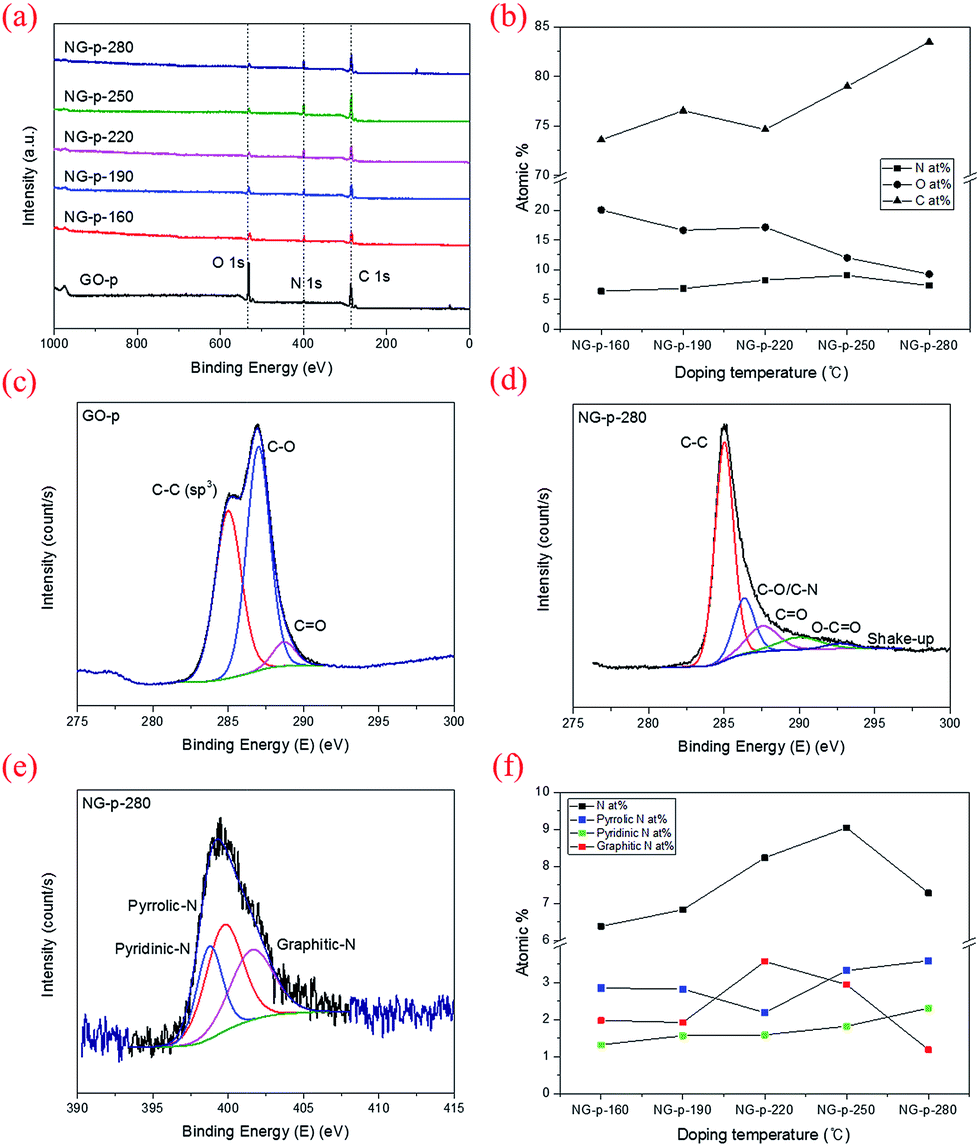 | ||
| Fig. 3 (a) XPS survey spectra of NG powder samples. (b) Elemental composition (C, O, N at%) of NG-p by doping temperature. (c and d) High-resolution C 1s of GO-p and NG-p-280. (e) N 1s of NG-p-280 as representative sample and (f) content distributions of nitrogen in NG powders. | ||
 | ||
| Fig. 4 Sheet resistance of NG and rGO sheets synthesized by doping temperature compared GO. | ||
In this study, nitrogen-doped graphene (NG) has been successfully synthesized by hydrothermal treatment from graphene oxide (GO) using ammonia solution (NH4OH) as a nitrogen precursor that has high reactivity at the relatively low investigated temperatures. To prove the effect of doping temperature on the N-bonding configuration of NG, some techniques were used for structural, qualitative, and quantitative analysis. The defects/disorders formed by N-doping and reduction of GO were demonstrated in NG, as a result of Raman spectroscopy. Through the FT-IR spectra, the formation of a C–N bond and narrowing O–H bond with temperature can be confirmed. X-ray photoelectron spectroscopy (XPS) analysis revealed that the N-doping was up to ∼9.04 at% and pyrrolic-N had a high proportion in N contents. However, a clear relationship between pyrrolic-N and temperature was not shown. Despite its smaller content, only pyridinic-N was highly correlated with temperature and sheet resistance. Therefore, we demonstrated the effect of doping temperature on N-doping configuration and made sure which one is dominant. Based on these results, we expect to utilize the condition of N-doping in applications for electrodes, catalysts, and batteries.
Acknowledgements
This research was supported by National Research Foundation of Korea Grant funded by the Korean Government (NRF-2013R1A1A2066114).References
- A. K. Geim and K. S. Novoselov, Nat. Mater., 2007, 6, 183–191 CrossRef CAS PubMed.
- K. I. Bolotin, K. J. Sikes, Z. Jiang, M. Klima, G. Fudenberg, J. Hone, P. Kim and H. L. Stormer, Solid State Commun., 2008, 146, 351–355 CrossRef CAS.
- A. A. Balandin, S. Ghosh, W. Bao, I. Calizo, D. Teweldebrhan, F. Miao and C. N. Lau, Nano Lett., 2008, 8, 902–907 CrossRef CAS PubMed.
- C. Lee, X. Wei, J. W. Kysar and J. Hone, Science, 2008, 321, 385–388 CrossRef CAS PubMed.
- M. D. Stoller, S. Park, Y. Zhu, J. An and R. S. Ruoff, Nano Lett., 2008, 8, 3498–3502 CrossRef CAS PubMed.
- S. De and J. N. Coleman, ACS Nano, 2010, 4, 2713–2720 CrossRef CAS PubMed.
- F. Bonaccorso, A. Bartolotta, J. N. Coleman and C. Backes, Adv. Mater., 2016, 28, 6136–6166 CrossRef CAS PubMed.
- S. Stankovich, D. A. Dikin, G. H. Dommett, K. M. Kohlhaas, E. J. Zimney, E. A. Stach, R. D. Piner, S. T. Nguyen and R. S. Ruoff, Nature, 2006, 442, 282–286 CrossRef CAS PubMed.
- S. Park and R. S. Ruoff, Nat. Nanotechnol., 2009, 4, 217–224 CrossRef CAS PubMed.
- Y. Zhu, S. Murali, W. Cai, X. Li, J. W. Suk, J. R. Potts and R. S. Ruoff, Adv. Mater., 2010, 22, 3906–3924 CrossRef CAS PubMed.
- H. He, J. Klinowski, M. Forster and A. Lerf, Chem. Phys. Lett., 1998, 287, 53–56 CrossRef CAS.
- A. H. Castro Neto, F. Guinea, N. M. R. Peres, K. S. Novoselov and A. K. Geim, Rev. Mod. Phys., 2009, 81, 109–162 CrossRef CAS.
- L. S. Panchakarla, K. S. Subrahmanyam, S. K. Saha, A. Govindaraj, H. R. Krishnamurthy, U. V. Waghmare and C. N. R. Rao, Adv. Mater., 2009, 21, 4726–4730 CAS.
- D. Geng, S. Yang, Y. Zhang, J. Yang, J. Liu, R. Li, T.-K. Sham, X. Sun, S. Ye and S. Knights, Appl. Surf. Sci., 2011, 257, 9193–9198 CrossRef CAS.
- D. Usachov, O. Vilkov, A. Gruneis, D. Haberer, A. Fedorov, V. K. Adamchuk, A. B. Preobrajenski, P. Dudin, A. Barinov, M. Oehzelt, C. Laubschat and D. V. Vyalikh, Nano Lett., 2011, 11, 5401–5407 CrossRef CAS PubMed.
- A. C. Ferrari, Solid State Commun., 2007, 143, 47–57 CrossRef CAS.
- T. Wu, H. Shen, L. Sun, B. Cheng, B. Liu and J. Shen, New J. Chem., 2012, 36, 1385 RSC.
- G. Giovannetti, P. A. Khomyakov, G. Brocks, V. M. Karpan, J. van den Brink and P. J. Kelly, Phys. Rev. Lett., 2008, 101, 026803 CrossRef CAS PubMed.
- H. M. Jeong, J. W. Lee, W. H. Shin, Y. J. Choi, H. J. Shin, J. K. Kang and J. W. Choi, Nano Lett., 2011, 11, 2472–2477 CrossRef CAS PubMed.
- Z. Luo, T. Yu, J. Shang, Y. Wang, S. Lim, L. Liu, G. G. Gurzadyan, Z. Shen and J. Lin, Adv. Funct. Mater., 2011, 21, 911–917 CrossRef CAS.
- Z. H. Ni, H. M. Wang, J. Kasim, H. M. Fan, T. Yu, Y. H. Wu, Y. P. Feng and Z. X. Shen, Nano Lett., 2007, 7, 2758–2763 CrossRef CAS PubMed.
- Z. Luo, T. Yu, Z. Ni, S. Lim, H. Hu, J. Shang, L. Liu, Z. Shen and J. Lin, J. Phys. Chem. C, 2011, 115, 1422–1427 CAS.
- E. N. Nxumalo and N. J. Coville, Materials, 2010, 3, 2141 CrossRef CAS.
- D. Long, W. Li, L. Ling, J. Miyawaki, I. Mochida and S. H. Yoon, Langmuir, 2010, 26, 16096–16102 CrossRef CAS PubMed.
- G. Wang, L.-T. Jia, Y. Zhu, B. Hou, D.-B. Li and Y.-H. Sun, RSC Adv., 2012, 2, 11249 RSC.
- F. M. Hassan, V. Chabot, J. Li, B. K. Kim, L. Ricardez-Sandoval and A. Yu, J. Mater. Chem. A, 2013, 1, 2904 CAS.
- S. Majeed, J. Zhao, L. Zhang, S. Anjum, Z. Liu and G. Xu, Nanotechnol. Rev., 2013, 2, 615–635 CAS.
- M. Du, J. Sun, J. Chang, F. Yang, L. Shi and L. Gao, RSC Adv., 2014, 4, 42412–42417 RSC.
- W. Zhang, L. Wu, Z. Li and Y. Liu, RSC Adv., 2015, 5, 49521–49533 RSC.
- C.-M. Kim, K.-B. Park, K.-S. Kim and I. S. Kim, J. Korean Soc. Environ. Eng., 2015, 37, 649–655 CrossRef.
- L. G. Cançado, A. Reina, J. Kong and M. S. Dresselhaus, Phys. Rev. B: Condens. Matter Mater. Phys., 2008, 77, 245408 CrossRef.
- A. L. Palma, L. Cinà, S. Pescetelli, A. Agresti, M. Raggio, R. Paolesse, F. Bonaccorso and A. Di Carlo, Nano Energy, 2016, 22, 349–360 CrossRef CAS.
- Z. Lin, M. K. Song, Y. Ding, Y. Liu, M. Liu and C. P. Wong, Phys. Chem. Chem. Phys., 2012, 14, 3381–3387 RSC.
- Z. Lin, G. Waller, Y. Liu, M. Liu and C.-P. Wong, Adv. Energy Mater., 2012, 2, 884–888 CrossRef CAS.
- S. Stankovich, R. D. Piner, S. T. Nguyen and R. S. Ruoff, Carbon, 2006, 44, 3342–3347 CrossRef CAS.
- M. Mermoux, Y. Chabre and A. Rousseau, Carbon, 1991, 29, 469–474 CrossRef CAS.
- C. Hontoria-Lucas, A. J. López-Peinado, J. d. D. López-González, M. L. Rojas-Cervantes and R. M. Martín-Aranda, Carbon, 1995, 33, 1585–1592 CrossRef CAS.
Footnote |
| † Electronic supplementary information (ESI) available. See DOI: 10.1039/c6ra26426c |
| This journal is © The Royal Society of Chemistry 2017 |