
 Open Access Article
 This Open Access Article is licensed under a
 Creative Commons Attribution 3.0 Unported Licence
Copper sulfide-functionalized molybdenum disulfide nanohybrids as nanoenzyme mimics for electrochemical immunoassay of myoglobin in cardiovascular disease
Bo Zhanga,
Yi Zhanga,
Wenbin Liangb,
Xuejun Yua,
Hu Tana,
Guoqiang Wanga,
Aimin Lia,
Jun Jina and
Lan Huang*a
aDepartment of Cardiology, Xinqiao Hospital, Third Military Medical University, Chongqing 400037, PR China. E-mail: huanglancq@yeah.net
bDepartment of Clinical Biochemistry, Laboratory Sciences, Third Military Medical University, Chongqing 400038, PR China
First published on 12th January 2017
Abstract
Myoglobin is one of the most commonly used cardiac biomarkers for the clinical diagnosis of acute myocardial infarction, which is the leading cause of mortality worldwide. Herein, we report a novel ‘signal-on’ electrochemical immunosensing system for the quantitative detection of myoglobin without the need for natural enzymes and additional electron mediators. The assay was readily carried out on a monoclonal mouse anti-human myoglobin capture antibody-modified carbon fiber microelectrode using copper sulfide–molybdenum disulfide (CuS–MoS2) hybrid nanostructures conjugated with polyclonal rabbit anti-human myoglobin detection antibody. Upon introduction of target myoglobin into the detection system, sandwiched immunocomplexes were formed on the electrode between the capture antibody and the detection antibody accompanying the CuS–MoS2 nanohybrids. The carried CuS–MoS2 nanohybrids acted as nanoenzyme mimics to electrochemically oxidize the glucose substrate, thereby resulting in the increment of the anodic current. Under optimal conditions, the detectable currents exhibited a ‘signal-on’ response relative to myoglobin concentrations within a dynamic linear range of 0.005–20 ng mL−1, with a limit of detection (LOD) as low as 1.2 pg mL−1. In addition, the electrochemical immunosensing platform displayed high specificity, good precision and reproducibility, and acceptable method accuracy for determining human serum specimens from cardiovascular disease patients with consistent results obtained from the referenced enzyme-linked immunosorbent assay (ELISA) method.
Introduction
Acute myocardial infarction (AMI, also known as a heart attack) is a life-threatening condition that occurs when blood flowing to the heart is abruptly cut off as a result of a blockage in one or more of the coronary arteries, including a build-up of plaque (a substance mostly made of fat, cholesterol and cellular waste products).1,2 Previous studies have reported that AMI remains a major cause of morbidity and mortality worldwide, resulting from cardiovascular disease, despite recent advancements in reperfusion therapy.3 Typically, myoglobin protein is commonly utilized as a cardiac biomarker for AMI due to its higher sensitivity compared to other biomarkers and its rapid release in the bloodstream.4 One major merit of using myoglobin as the cardiac biomarker lies in the fact that it can be released from the damaged cells earlier than other cardiac markers,5 achieving the purpose of the early diagnosis of AMI. In this regard, it is necessary to explore novel assay methods, particularly immunoassay development, for more flexible and easy-to-use protocols, while preserving the essential benefits in sensitivity, robustness, broad application and suitability for automation.Electrochemical immunoassay, the measurement of antigen/antibody concentration on the basis of a biospecific recognition reaction, holds great potential as the next-generation major analytical tool in clinical diagnosis because of its high sensitivity, simple instrumentation and operation, and good compatibility with miniaturization technologies.6,7 Khan et al. devised an impedimetric immunosensor for the detection of cardiovascular disorder risk biomarkers on a multiwalled carbon nanotubes-modified, screen-printed electrode.8 Zhang et al. constructed a sandwich-type amperometric immunosensor for detecting myoglobin using nanogold-penetrated poly(amidoamine) dendrimer as the label for the signal antibody.9 The Singh group used gold nanoparticles-reduced graphene oxide for electrochemical immunosensing of the cardiac biomarker, myoglobin.10 In these cases, high sensitivity was usually acquired using an indicator system that resulted in the amplification of the measured product, e.g., enzyme labels or nanolabels.11,12 Undoubtedly, enzyme labels are more preferable for the signal amplification; for example, 1 M horseradish peroxidase can cause the conversion of 107 M substrates per min.13 However, one of the problems commonly associated with natural enzymes is their susceptibility to interference and the detection conditions at the signal-generation stage; e.g., pH, temperature and instability caused by structural unfolding.14 Moreover, natural enzymes are usually expensive and easily denatured during storage and usage. In contrast with natural enzymes, the emergence of nanomaterials-based enzyme mimics (e.g., Fe3O4, Co3O4, MnO2, Pt and Ag) opens a new avenue for the selection of enzyme labels.15,16 Although there are some well-established schemes in this field, the high-efficiency nanoenzyme mimics for the development of electrochemical immunoassay still need to be explored and exploited.
Copper sulfide (CuS, as a p-type semiconductor with a direct band gap of 1.2–2.0 eV caused by copper vacancies within the lattice) has attracted great interest in photocatalysis, solar cell devices and biosensors, owing to its unique optical properties, low cost, non-toxicity, easy preparation and ready storage.17,18 Similar to the redox pair of Cu2+/Cu3+, copper-based nanostructures usually serve as effective electron mediators in the electrocatalytic oxidation of glucose.19 Qian et al. synthesized CuS nanotubes on Cu electrodes for the direct electrooxidation of glucose.20 Lin et al. found that glucose could be electrocatalytically oxidized on the sphere-like CuS microcrystals.21 Yang et al. synthesized flower-like CuS nanoparticles for nonenzymatic glucose sensing with good electrocatalytic activity.22 However, recent studies reported that the electrocatalytic capability of CuS nanostructures could be controlled by changing their structures, shapes and surface properties.23 Hybrid nanocomposites field, by combining with different nanomaterials, has expanded significantly to encompass various systems and improve the photogeneration rate, efficient carrier transfer and plasmon-induced ‘hot carrier’, playing a significant role in enhancing device performance.24 Molybdenum disulfide (MoS2), with a layered inorganic compound structure, is often used as an efficient cocatalyst in photocatalytic and electrocatalytic reactions, owing to its large surface area and high electrical conductivity.25,26 The Lin27 and Huang28 groups observed that glassy carbon electrode modified with MoS2 and copper nanoflowers/nanoparticles exhibited higher electrocatalytic activity toward glucose than copper or MoS2 nanomaterials alone. Unfortunately, the electrocatalytic reaction of MoS2–Cu nanohybrids toward glucose oxidization is readily carried out in 0.1 M NaOH because of the presence of Cu0, which is unfavorable for protein detection. In contrast, the use of CuS nanocrystals would be advantageous for the formation of the Cu2+/Cu3+ redox pair. To this end, our aim in this study is to synthesize CuS–MoS2 hybrid nanostructures to improve the electrocatalytic properties toward glucose, which are applied in immunoassay development.
Herein, we report the design of an enzyme-free electrochemical immunoassay method for the sensitive and specific detection of myoglobin using CuS–MoS2 nanohybrids as enzyme mimics (Scheme 1). This system consists of a capture antibody-modified glassy carbon electrode and detection antibody-conjugated CuS–MoS2. In the presence of myoglobin, the analyte is sandwiched between the capture antibody and detection antibody and carried with CuS–MoS2 nanostructures on the electrode. The carried CuS–MoS2 electrochemically catalyzes the oxidization of glucose in the detection solution. The signal increases with increasing target myoglobin in the sample on the basis of the sandwich-type immunoassay format. In this case, we can quantitatively determine the myoglobin concentration level by evaluating the current of glucose oxidization.
 | ||
| Scheme 1 Schematic illustration of the CuS–MoS2-based, enzyme-free, electrochemical immunoassay of the target myoglobin on monoclonal mouse anti-myoglobin capture antibody (mAb)-modified carbon fiber microelectrode (CFME), using polyclonal rabbit anti-myoglobin detection antibody (pAb)-conjugated CuS–MoS2 hybrid nanostructures as the signal-generation tags for glucose oxidization. | ||
Experimental
Materials and apparatus
Mouse anti-human monoclonal myoglobin capture antibody (denoted as mAb, 0.29 mg mL−1 in PBS containing 0.09% sodium azide, w/v), rabbit anti-human polyclonal myoglobin detection antibody (denoted as pAb, application: 1![[thin space (1/6-em)]](https://www.rsc.org/images/entities/char_2009.gif) :500–1:1000), myoglobin and human myoglobin ELISA kit were purchased from Abcam (Hong Kong, China). MoS2 nanocrystals (50 nm, 99.9%, 120 m2 g−1; spherical; dark gray) were obtained from Beijing DK Nano Technol. Co. Ltd. (Beijing, China). N-(3-Dimethylaminopropyl)-N′-ethylcarbodiimide hydrochloride (EDC), N-hydroxysuccinimide (NHS), thioglycolic acid, bovine serum albumin (BSA, 96–99%) and chitosan (high purity, MW 60000–120000) were acquired from Sigma-Aldrich. All other chemicals, including Cu(NO3)2 and Na2S, were of analytical grade and used as received. Ultrapure water obtained from a Millipore water purification system at ∼18.2 MΩ cm−1 (Milli-Q, Millipore) was used in all runs. Phosphate buffer solution (PBS) with different pH values was prepared from 10 mM phosphate-buffered saline and 0.1 M KCl (used as the supporting electrolyte).
:500–1:1000), myoglobin and human myoglobin ELISA kit were purchased from Abcam (Hong Kong, China). MoS2 nanocrystals (50 nm, 99.9%, 120 m2 g−1; spherical; dark gray) were obtained from Beijing DK Nano Technol. Co. Ltd. (Beijing, China). N-(3-Dimethylaminopropyl)-N′-ethylcarbodiimide hydrochloride (EDC), N-hydroxysuccinimide (NHS), thioglycolic acid, bovine serum albumin (BSA, 96–99%) and chitosan (high purity, MW 60000–120000) were acquired from Sigma-Aldrich. All other chemicals, including Cu(NO3)2 and Na2S, were of analytical grade and used as received. Ultrapure water obtained from a Millipore water purification system at ∼18.2 MΩ cm−1 (Milli-Q, Millipore) was used in all runs. Phosphate buffer solution (PBS) with different pH values was prepared from 10 mM phosphate-buffered saline and 0.1 M KCl (used as the supporting electrolyte).
Preparation and bioconjugation of CuS–MoS2 nanohybrids with pAb antibody
In the first step, CuS-functionalized MoS2 nanocrystals (denoted as CuS–MoS2) were prepared using the wet-chemistry method. Initially, 0.5 g of MoS2 nanocrystals was dispersed into 2.0 mL of 1.0 wt% chitosan acetic acid solution with the help of sonication. Then, the resulting suspension was centrifuged for 10 min at 10000g to obtain chitosan-coated MoS2 nanocrystals. Following that, the precipitate was dispersed into 5.0 mL of 2 mM Cu(NO3)2 aqueous solution, and the pH was adjusted to ∼9.0 using Na2CO3. During this process, the positively charged Cu2+ ions were adsorbed onto the MoS2 nanoparticles through the negatively charged –SO32− group on the chitosan. After being de-aerated with highly pure N2 for 30 min, 10 μL thioglycolic acid and 5.0 mM Na2S aqueous solution were added into the mixture in sequence to make the molar ratio of Na2S and Cu(NO3)2 about 2.5.29 Subsequently, the mixture was allowed to react further for 12 h at room temperature with the protection of N2. Finally, the brownish-black suspension was centrifuged for 10 min at 10000g and washed three times with ultrapure water. The as-prepared CuS–MoS2 nanohybrids were dried at 60 °C for further use.
The pAb antibody was conjugated with MoS2–CuS nanostructures via a typical carbodiimide coupling.30 Initially, 100 μL of 50 mg mL−1 EDC and 100 μL of 50 mg mL−1 NHS aqueous solution were simultaneously added to 2.0 mL ultrapure water containing 50 mg CuS–MoS2 to activate the –COOH group on the nanohybrids. Thereafter, the suspension was centrifuged in order to remove the excess EDC and NHS, and the obtained precipitate was dispersed into 2 mL of pAb antibody solution (1:1000 dilution with PBS at pH 7.4) and incubated overnight at 4 °C with slight shaking on a shaker. Finally, pAb-conjugated CuS–MoS2 (denoted as pAb–CuS–MoS2) was centrifuged for 10 min at 10000g, washed with PBS at pH 7.4, and resuspended in 2.0 mL PBS (10 mM, pH 7.4) containing 0.5 wt% BSA and 0.1 wt% sodium azide with a final concentration of 25 mg mL−1 for subsequent use at 4 °C.
Preparation of the electrochemical immunosensor
Prior to modification with mAb antibody, the carbon fiber microelectrode (CFME) was prepared referring to the literature.31 A carbon fiber 1.0 mm in diameter, adhered on a copper wire with silver conducting epoxy, was initially inserted into a glass capillary with a tip diameter of ∼2.0 mm. Then, the tip of the glass capillary was sealed with epoxy resin and heat cured at 100 °C for 60 min (note: the exposed carbon fiber was trimmed to a length of 10 nm with a scalpel). After being ultrasonically cleaned with water and acetone, the resulting CFME was electrochemically activated by holding it at +2.0 V for 30 s and −1.0 V for 10 s in 0.1 M H2SO4 and then pre-treated by potential cycling in the same solution in the potential range from 0.0 to +1.0 V at 100 mV s−1 until a stable cyclic voltammogram was obtained. During this process, numerous –COOH groups were formed on the CFME. Following that, the activated CFME was immersed in the mixture containing 50 mg mL−1 EDC and 50 mg mL−1 NHS and incubated for 6 h at room temperature. After being washed with ultrapure water, the resultant CFME was dipped into mAb solution to covalently conjugate the capture antibody. Finally, the electrode was incubated in 2.5 wt% BSA for 60 min at room temperature to eliminate the non-specific binding effect and block the remaining active sites. The obtained immunosensor (denoted as mAb-CFME) was stored at 4 °C for further use.Electrochemical measurement of the target myoglobin
Scheme 1 displays a schematic of the CuS–MoS2-based, sandwich-type immunosensing platform for the electrochemical detection of myoglobin on mAb-CFME, using pAb–CuS–MoS2 as the signal transducer in the presence of glucose. All electrochemical measurements were carried out on an electrochemical workstation (AutoLab μAUTIII.FRA2.v, Eco Chemie, The Netherlands) with a classical three-electrode system, including a modified CFME working electrode, a Pt-wire auxiliary electrode and an Ag/AgCl reference electrode. The detection process for myoglobin was as follows. After incubating the mAb-CFME in the incubation solution containing myoglobin of different concentrations for 35 min at room temperature and washing with PBS of pH 7.4, the resulting electrode was submerged in the pAb–CuS–MoS2 solution for another 35 min at room temperature. After being washed gently with PBS of pH 7.4 to remove the unbound pAb–CuS–MoS2, the amperometric response of the immunosensor was recorded in PBS (10 mM, pH 7.2) containing 0.5 mM glucose due to the catalytic oxidization of glucose by the CuS–MoS2-based nanoenzyme mimics. The value of the anodic peak current was registered as the sensor signal since this value is proportional to the quantity of CuS–MoS2 and, consequently, to the concentration of myoglobin. The signals in all experiments were referred to average responses of anodic currents with corresponding standard deviations in triplicate, unless otherwise indicated. All measurements were performed at room temperature (25 °C ± 1.0 °C).Results and discussion
Characterization of CuS–MoS2 hybrid nanostructures
As mentioned above, the detectable signal of the electrochemical immunosensor for glucose oxidization during the voltammetric measurement is mainly derived from the doped CuS in the CuS–MoS2 hybrid nanostructures; therefore, the successful preparation of CuS–MoS2 nanohybrids would directly affect the analytical performance of our strategy. First, we used high-resolution transmission electron microscope images (HRTEM, H-7650, Hitachi Instruments, Tokyo, Japan) to characterize the morphology of MoS2 nanocrystals before and after modification with CuS nanostructures (Fig. 1A and B). MoS2 nanocrystals with an average size of 50 nm in diameter were homogeneously dispersed in the solution as shown from HRTEM image (Fig. 1A), which was almost in accordance with that reported by producer. We also observed the layered structure of the MoS2 nanocrystals (Fig. 1A, top inset). As shown in Fig. 1B, the as-prepared nanocomposites were bigger than the MoS2 nanocrystals alone after the formation of CuS–MoS2 nanohybrids. Furthermore, we used dynamic light scattering (DLS, Zetasizer Nano S90, Malvern, London, UK) to evaluate the size of the MoS2 nanocrystals before and after reaction with Cu(NO3)2 and Na2S. The average sizes of the nanoparticles were 50.8 ± 1.3 nm for MoS2 nanocrystals (Fig. 1A, bottom inset) and 68.7 ± 2.1 nm for CuS–MoS2 nanohybrids (Fig. 1B, bottom inset). From the inset of Fig. 1B, we can observe that a large number of CuS nanoparticles were coated on the surface of the MoS2 nanocrystals (Fig. 1B, top inset). In addition, we utilized ex situ Raman spectra to investigate the synthesized CuS–MoS2 nanostructures (Fig. 1B, inset). The Raman spectrum collected from the samples had three strong characteristic bands located at 380 cm−1, 407 cm−1 and 470 cm−1. The high-intensity peak recorded at 470 cm−1 was identified as the S–S stretching mode of S2 ions at the 4e sites of CuS nanocrystals,32 and the sharp peak suggested that the lattice atoms were aligned in the periodic array.33 Referring to previous reports,28,34 two characteristic bands at 380 and 407 cm−1 originated from the in-plane vibrational (E12g) and the out-of-plane vibrational (A1g) modes of MoS2 nanocrystals. However, Raman data are usually collected from a point and cannot provide adequate information on the uniform formation of MoS2–CuS throughout the samples. To further demonstrate the formation of MoS2–CuS nanohybrids, we utilized X-ray diffraction (XRD, PANalytical X'Pert spectrometer, The Netherlands) and X-ray photoelectron spectroscopy (XPS, Thermo Scientific ESCALAB 250 spectrometer, USA) to characterize the as-prepared nanocrystals. As shown in Fig. 1C, two characteristic XRD diffraction peaks at 58.5° and 48.1° were clearly obtained, which were ascribed to the (110) planes of MoS2 and CuS nanocrystals, respectively.35,36 XPS analysis was also employed to confirm the elemental composition and chemical state of the nanostructures. Fig. 1D gives the Mo3d, Cu2p, S2p, O1s and C1s core level regions of the hybrid nanomaterials, respectively, indicating that the main constituent elements were Cu, Mo and S. Based on these results, we can conclude that MoS2–CuS hybrid nanostructures were successfully synthesized using the wet-chemistry method.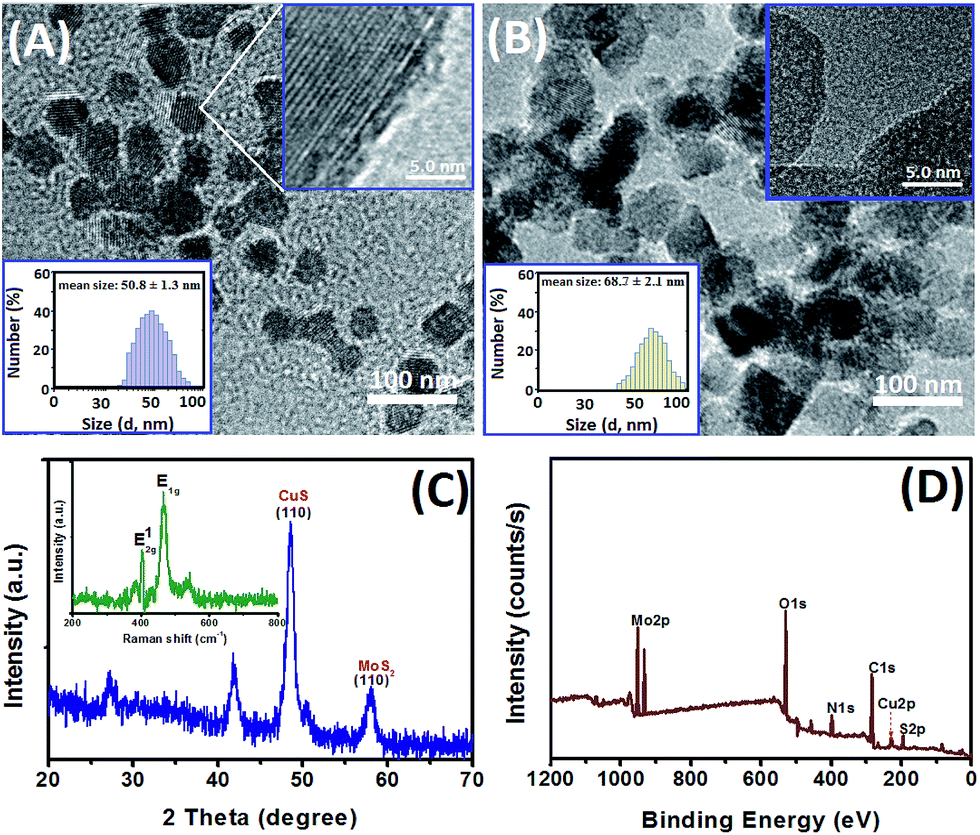 | ||
| Fig. 1 HRTEM images of (A) MoS2 nanocrystals and (B) CuS–MoS2 hybrid nanostructures [inset: (top) magnification images and (bottom) DLS data of the corresponding nanostructures]. (C) XRD patterns (inset: Raman spectrum of CuS–MoS2 hybrid nanostructures with the lowest laser power). (D) XPS data of CuS–MoS2 nanostructures. | ||
Electrochemical characteristics of differently modified electrodes
In this study, mAb capture antibody was immobilized onto the CFME via a typical carbodiimide coupling method. To monitor the preparation of mAb-CFME, we used electrochemical impedance spectroscopy (EIS) to characterize the fabrication procedure of the immunosensor in PBS (pH 7.4) containing 5 mM Fe(CN)64−/3− and 0.1 M KCl in the range of 10−2 to 105 Hz at an alternate voltage of 5 mV (Fig. 2A). In EIS, the semicircle diameter equals the electron transfer resistance, Ret, which controls the electron transfer kinetics of the redox-probe at the electrode interface. The value varies when different substances are adsorbed on the surface of the electrode. Curve ‘a’ gives the Nyquist diagram of the newly prepared CFME and the resistance was ∼212 Ω. After the CFME was activated in 0.1 M H2SO4, the resistance increased to 489 Ω (curve ‘b’). The reason might be the fact that the formed –COO− group on the CFME hindered the transfer of negatively charged Fe(CN)64−/3− from the solution to the base electrode. Furthermore, introduction of the mAb capture antibody again caused the increased resistance of the electrode (curve ‘c’), owing to the presence of weak-conductivity antibody molecules. Thus, the mAb capture antibody could be covalently conjugated to the CFME with the assistance of EDC and NHS.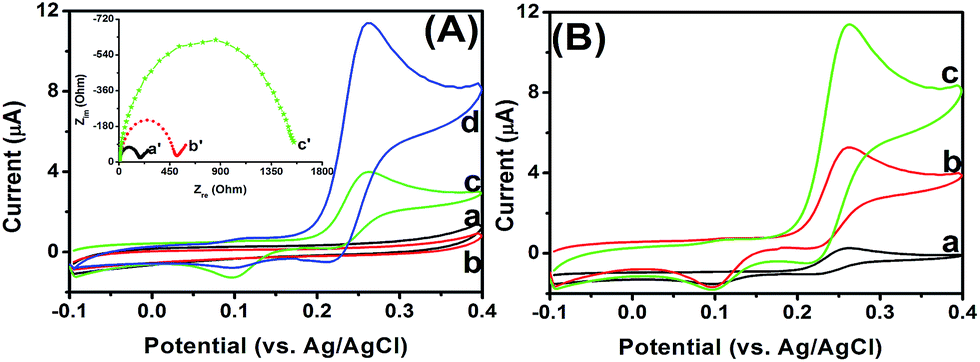 | ||
| Fig. 2 (A) Cyclic voltammograms of (a) mAb-CFME + PBS at pH 7.2, (b) mAb-CFME + 0.1 ng mL−1 myoglobin + PBS at pH 7.2, (c) sensor ‘b’ + pAb–CuS–MoS2 + PBS at pH 7.2, and (d) sensor ‘b’ + pAb–CuS–MoS2 + PBS with pH 7.2 + 0.5 mM glucose at 50 mV s−1 (inset: Nyquist diagrams for (a) CFME, (b) activated CFME and (c) mAb-CFME) in 5 mM Fe(CN)64−/3− containing 0.1 M KCl in the range from 10−2 Hz to 105 Hz at an alternate voltage of 5 mV. (B) Cyclic voltammetric responses of mAb-CFME toward 0.1 ng mL−1 myoglobin in PBS with pH 7.2 by using (a) pAb–MoS2, (b) pAb–CuS and (c) pAb–CuS–MoS2 as the signal-generation tags, respectively. | ||
Logically, one question arises as to whether the as-prepared mAb-CFME could be used for the detection of target myoglobin with the pAb–CuS–MoS2. To demonstrate this issue, cyclic voltammograms of the mAb-CFME were monitored in PBS (10 mM, pH 7.2) before and after incubation with 0.1 ng mL−1 myoglobin (used as an example) and pAb–CuS–MoS2, respectively (Fig. 2B). No redox peak was observed at the mAb-CFME at 50 mV s−1 (curve ‘a’). After the mAb-CFME reacted with target myoglobin, a relatively low background current was achieved (curve ‘b’), indicating that the formed immunocomplexes could cause the decreasing background current. However, when the resulting electrode was incubated again with pAb–CuS–MoS2, a pair of redox peaks at +95 mV and +265 mV was obtained in PBS at pH 7.2 (curve ‘c’), suggesting that the as-synthesized CuS–MoS2 had a good redox electroactivity and could facilitate electron transfer. Upon addition of glucose in PBS at pH 7.2, an evident catalytic characteristic appeared with the increase in the oxidation current (curve ‘d’). The catalytic behavior could be ascribed to the labeled CuS–MoS2 hybrid nanostructures toward glucose oxidization. As the control test, the myoglobin/mAb-CFME was also investigated via cyclic voltammetry in PBS at pH 7.2, without and with glucose, and the anodic peak currents were almost not changed before and after the addition of glucose (data not shown). Thus, the CuS–MoS2-based electrochemical immunosensing strategy could be utilized for the detection of myoglobin.
To clarify the advantage of CuS–MoS2 hybrid nanostructures for the development of enzyme-free electrochemical immunoassay, a comparative study was carried out using three nanolabels, such as pAb–CuS–MoS2, pAb–CuS and pAb–MoS2, for the detection of 0.1 ng mL−1 myoglobin (used as an example) on the same-batch mAb-CFME sensors, respectively (note: pAb–CuS and pAb–MoS2 were prepared using thioglycolic acid, EDC and NHS, similar to the literature30). As shown in Fig. 2C, the use of pAb–CuS–MoS2 resulted in a much greater amperometric response than those obtained with pAb–CuS and pAb–MoS2. Some possible explanations might be attributed to the following observations: (i) the high surface-to-volume ratio of the MoS2 nanocrystals could efficiently enhance the immobilization density of CuS nanostructures; (ii) nanometer-sized CuS particles electrochemically catalyzed the oxidization of glucose (please see the catalytic mechanism in detail in the literature);19,20,37 (iii) the carried CuS with MoS2 nanoscales might serve as an intervening “spacer” matrix to extend the electron away from the substrate into the mobile phase, resulting in binding sites more accessible to electrons.
Optimization of experimental conditions
To acquire optimal analytic performance, the following parameters were optimized: (a) pH of PBS and (b) time for the antigen–antibody immunoreaction. Generally speaking, the influence of the pH value of the detection solution is an important parameter because the acidity of the solution greatly affects the activity of the conjugated proteins. Fig. 3A gives the effect of the pH of detection solution on the anodic currents of the mAb-CFME in 10 mM PBS containing 0.5 mM glucose after reaction with 10 ng mL−1 of target myoglobin and pAb–CuS–MoS2 for 60 min at room temperature. The current increased with the increasing pH values from 4.0 to 7.2 and then decreased. The optimal current was obtained at pH 7.2, and hence PBS with pH of 7.2 was selected as the detection solution in this study.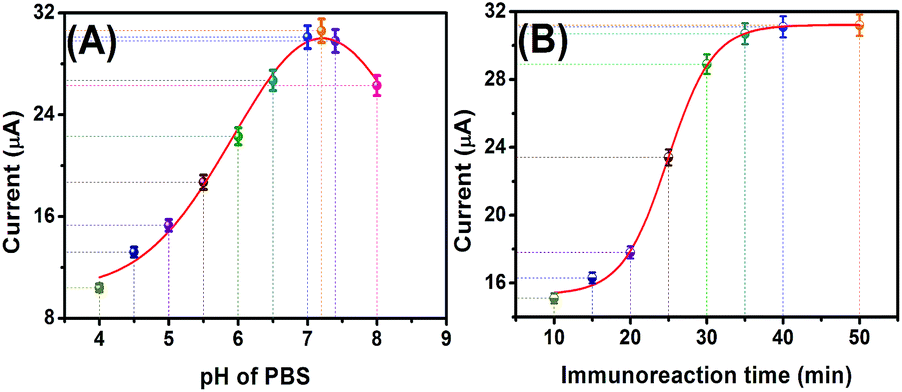 | ||
| Fig. 3 Effects of (A) pH of PBS and (B) immunoreaction time of mAb-CFME with target myoglobin and pAb–CuS–MoS2 on the anodic current of the electrochemical immunosensor (10 ng mL−1 myoglobin used in this case). | ||
Usually, the antigen–antibody reaction is adequately carried out at normal body temperature (37 °C). Considering the possible application of the proposed immunoassay in the future, we selected room temperature (25 °C ± 1.0 °C) for the antigen–antibody interaction throughout the experiment. Under these conditions, we monitored the effect of incubation time on the currents of the immunosensors from 10 min to 50 min (note: to avoid confusion, the incubation times of the immunosensor with myoglobin were parallel to those of the immunosensor-myoglobin with pAb–CuS–MoS2). As shown in Fig. 3B, the anodic current increased with the increment of incubation time, and tended to level off after 35 min; hence, an incubation time of 35 min was selected for the sensitive determination of myoglobin in the subsequent experiments.
Analytical performance of the CuS–MoS2-based electrochemical immunosensor
To increase the probability for effective treatment, highly sensitive detection of cancer markers is very important for early cancer diagnosis. Under optimal conditions, we monitored the analytical properties of the electrochemical immunosensor toward myoglobin standards on mAb-CFME using pAb–CuS–MoS2 as the detection antibody. As seen from Fig. 4A, the peak currents increased with the increasing target analyte. A linear dependence between the peak current and the logarithm of myoglobin level was achieved within the dynamic range from 0.005 to 20 ng mL−1 with a detection limit (LOD) of 1.2 pg mL−1 estimated at a signal-to-noise ratio of 3 (Fig. 4A, inset). The regression equation could be fitted to y (μA) = 21.062 × logC + 8.892 (ng mL−1, R2 = 0.9982, n = 7). Evidently, the LOD and linear range of our method were also comparable with other detection systems (Table 1) and the existing commercialized myoglobin ELISA kits (e.g., 86 pg mL−1 for Abcam; 5.0 ng mL−1 for AccuDiag™).
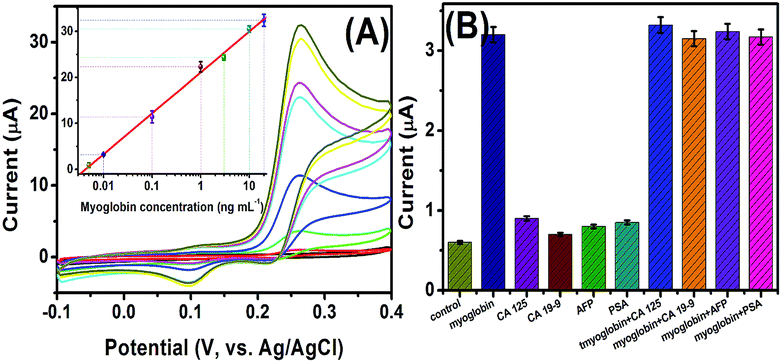 | ||
| Fig. 4 (A) Cyclic voltammetric responses of the CuS–MoS2-based electrochemical immunosensor toward myoglobin standards with different concentrations (note: 0, 0.005, 0.01, 0.1, 1.0, 3.0, 10 and 20 ng mL−1 from inner to outer) at 50 mV s−1 in PBS (10 mM, pH 7.2) (inset: the corresponding calibration curve between 0.005 ng mL−1 and 20 ng mL−1). (B) The specificity of the enzyme-free electrochemical immunosensor against 0.01 ng mL−1 myoglobin, 100 U mL−1 CA 19–9, 100 U mL−1 CA 125, 100 ng mL−1 CEA and 100 ng mL−1 AFP. | ||
| Method | Indicator/nanomaterials | Linear range (ng mL−1) | LOD (pg mL−1) | Ref. |
|---|---|---|---|---|
| Electrochemistry | Nanogold | 0.01–500 | 3.8 | 9 |
| Electrochemistry | o-Phenylenediamine | 18–18000 |
9000 | 38 |
| Electrochemistry | Graphene quantum dots | 0.01–100 | 10 | 39 |
| Impedimetric sensor | Carbon nanotube | 0.1–90 | 80 | 8 |
| Fluorescence sensor | Magnetic SiO2@Au | 0–250 | 280 | 40 |
| Electrochemistry | Aptamer | — | 0.524 | 41 |
| Electrochemistry | Dual-aptamer | — | ∼420 | 42 |
| Fluorescence | PicoGreen/SiO2 | 0.13–45 nM | 870 | 43 |
| Lateral flow assay | Saline ions | — | 1560 | 44 |
| Electrochemistry | Graphene oxide/CNT | 1.0–4000 | 340 | 45 |
| Electrochemistry | CuS–MoS2 | 0.005–20 | 1.2 | This study |
The precision of the CuS–MoS2-based electrochemical immunosensor was evaluated by determining the intra- and inter-batch coefficients of variation (CVs, n = 3). Experimental results indicated that the CVs of the assays using the same-batch mAb-CFME and pAb–CuS–MoS2 were 8.3%, 6.7% and 7.3% at 0.01, 1.0, and 10 ng mL−1 myoglobin, respectively. The sensor-to-sensor reproducibility was also studied using different-batch mAb-CFME and pAb–CuS–MoS2 and the CVs were 11.6%, 9.8% and 12.7% at the abovementioned concentration levels, respectively. Hence, the repeatability and intermediate precision of the electrochemical immunosensor was acceptable.
Next, the selectivity of the CuS–MoS2-based electrochemical immunoassay was studied using this system against other biomarkers in human serum, e.g., cancer antigen 125 (CA 125), cancer antigen 19–9 (CA 19–9), alpha-fetoprotein (AFP) and prostate-specific antigen (PSA). As shown in Fig. 4B, the signal of the immunosensor toward target myoglobin was 3-fold increased at a concentration level of three orders of magnitude lower than those of other biomarkers. Moreover, the coexistence of non-target biomarkers with target myoglobin did not cause a significant increase in the current, compared with that of myoglobin alone. In addition, ∼95% of the initial signal was preserved after storage of mAb-CFME and pAb–CuS–MoS2 for 45 days at 4 °C. Therefore, the CuS–MoS2-based electrochemical immunosensor had high specificity and long-term stability.
Analysis of real samples
Under the optimal conditions, the accuracy of the CuS–MoS2-based electrochemical immunoassay method was evaluated by assaying human serum specimens on the basis of the standard addition method. Three human serum samples, including myoglobin (0.82 μg mL−1, 0.54 μg mL−1 and 0.69 μg mL−1) were collected from three cardiac patients in our hospital (XinQiao Hospital, Third Military Medical University, Chongqing 400037, China) according to the rules of the local hospital ethical committee. Prior to measurement, these samples were diluted to the linear range of this sensor with PBS (10 mM, pH 7.4). A rapid and stable amperometric response was acquired with the addition of 50 μL of sample to the incubation solution. After the signal was obtained, myoglobin standards with different concentrations were successively injected into this system for the standard addition measurement to calculate the myoglobin concentration in these samples. The results were compared with those obtained by commercial human myoglobin ELISA kit (Abcam, SimpleStep ab171580) (Table 2). Experimental results were statistically analyzed by a linear regression analysis of the two methods. The regression equation for these data, obtained from both methods, displayed a good positive correlation, with a correlation coefficient of 0.9977, indicating that the CuS–MoS2-based electrochemical immunoassay was capable of detecting myoglobin in complex systems.| Sample no. | Method; concentration (ng mL−1, n = 3)a | RSD (%) | |
|---|---|---|---|
| Found by immunosensor | Found by ELISA kit | ||
| a The regression equation (linear) for the data is as follows: y = 1.0879x − 3.5203 (R2 = 0.9954) (x-axis: by the electrochemical immunosensor; y-axis: by the ELISA kit). High-concentration myoglobin samples were calculated by multiplying with the dilution factor. Analyses were made in triplicate, and the data were obtained based on the mean value of three assays (n = 3). | |||
| 1 | 11.3 | 13.2 | 7.8 |
| 2 | 106.4 | 93.4 | 6.5 |
| 3 | 203.2 | 231.2 | 6.4 |
| 4 | 1.6 | 2.1 | 13.5 |
| 5 | 56.7 | 45.6 | 10.9 |
| 6 | 401.9 | 432.7 | 3.7 |
| 7 | 0.78 | 0.91 | 7.7 |
| 8 | 8.6 | 7.2 | 8.9 |
| 9 | 50.3 | 56.7 | 6.1 |
Conclusions
In this contribution, we successfully devised a high-efficiency electrochemical immunoassay method for the simple and sensitive detection of cardiac biomarker-myoglobin, without the participation of natural enzyme or additional electron mediator. Relative to traditional nanoenzyme mimics, such as metal oxides (e.g., Fe3O4, Co3O4 and MnO2), noble metal nanoparticles (e.g., nano-Pt and nano-Ag) or other hybrid nanostructures (e.g., Au–Fe3O4 and MnO2–MoS2), the CuS–MoS2 hybrid nanostructures were not only used as the nanoenzyme mimics instead of natural enzyme (glucose oxidase), but were also utilized as the electron mediator ascribed to the Cu2+/Cu3+ redox pair. Although the present system was focused on detecting target myoglobin, our strategy is easily extended to determine other biomarkers by controlling the corresponding capture antibody and detection antibody. Nevertheless, there is still an existing challenge in this system because the detection antibodies were covalently conjugated to the CuS–MoS2 nanohybrids. A basic limitation commonly associated with covalent binding lies in decreasing the protein activity when the proteins are exposed to the reactive groups and harsh reaction conditions. To realize possible application, further investigation should be carried out to improve the labeling strategies.Acknowledgements
Support by the National Natural Science Foundation of China (Grant no. 81100149, 81470300 and 81301518) is greatly acknowledged.References
- K. Mahmoud and F. Zijlstra, Nat. Rev. Cardiol., 2016, 13, 418–428 CrossRef PubMed.
- B. Scirica and D. Morrow, Clin. Chem., 2015, 61, 1427–1429 CAS.
- K. Rentrop and F. Feit, Am. Heart J., 2015, 170, 971–980 CrossRef PubMed.
- M. Weber, M. Rau, K. Madlener, A. Elsaesser, D. Bankovic, V. Mitrovic and C. Hamm, Clin. Biochem., 2005, 38, 1027–1030 CrossRef CAS PubMed.
- T. Imamura, Circ. J., 2011, 75, 1322–1323 CrossRef CAS PubMed.
- X. Pei, B. Zhang, J. Tang, B. Liu, W. Lai and D. Tang, Anal. Chim. Acta, 2013, 758, 1–18 CrossRef CAS PubMed.
- Y. Lin, Q. Zhou, Y. Lin, D. Tang, R. Niessner and D. Knopp, Anal. Chem., 2015, 87, 8531–8540 CrossRef CAS PubMed.
- R. Khan, M. Pal, A. Kuzikov, T. Bulko, E. Suprun and V. Shumyantseva, Mater. Sci. Eng. C, 2016, 68, 52–58 CrossRef CAS PubMed.
- B. Zhang, Y. Zhang, W. Liang, B. Cui, J. Li, X. Yu and L. Huang, Anal. Chim. Acta, 2016, 904, 51–57 CrossRef CAS PubMed.
- S. Singh, S. Tuteja, D. Sillu, A. Deep and C. Suri, Microchim. Acta, 2016, 183, 1729–1738 CrossRef CAS.
- M. Hasanzadeh, N. Shadjou, M. Eshandani, M. de la Guardian and E. Omidinia, TrAC, Trends Anal. Chem., 2013, 49, 20–30 CrossRef CAS.
- G. Liu and Y. Lin, Talanta, 2007, 74, 308–317 CrossRef CAS PubMed.
- B. Zhang, D. Tang, I. Goryacheva, R. Niessner and D. Knopp, Chem.–Eur. J., 2013, 19, 2496–2503 CrossRef CAS PubMed.
- Y. Lin, Q. Zhou, Y. Lin, M. Lu and D. Tang, Anal. Chim. Acta, 2015, 887, 67–74 CrossRef CAS PubMed.
- P. Chen, A. Periasamy, S. Harroun, W. Wu and H. Chang, Coord. Chem. Rev., 2016, 320, 129–138 CrossRef.
- E. Kuah, S. Toh, J. Yee, Q. Ma and Z. Gao, Chem.–Eur. J., 2016, 22, 8404–8430 CrossRef CAS PubMed.
- P. Roy and S. Srivastava, Small, 2014, 10, 631–645 CrossRef PubMed.
- Y. Wei, H. Wang, S. Sun, L. Tang, Y. Cao and B. Deng, Biosens. Bioelectron., 2016, 86, 714–719 CrossRef CAS PubMed.
- S. Radhakrishnan, H. Kim and B. Kim, Sens. Actuators, B, 2016, 233, 93–99 CrossRef CAS.
- L. Qian, J. Mao, X. Tian, H. Yuan and D. Xiao, Sens. Actuators, B, 2013, 176, 952–959 CrossRef CAS.
- J. Lin, F. Tao, L. Wang, L. Chen, Y. Ying, L. Zhang, H. Liu and M. Xia, J. Mater. Sci., 2013, 48, 5509–5516 CrossRef CAS.
- Y. Yang, J. Zi and W. Li, Electrochim. Acta, 2014, 115, 126–130 CrossRef CAS.
- N. Wang, C. Gao, Y. Han, X. huang, Y. Xu and X. Cao, J. Mater. Chem. B, 2015, 3, 3254–3259 RSC.
- X. Li, J. Zhu and B. Wei, Chem. Soc. Rev., 2016, 45, 3145–3187 RSC.
- B. Liu, W. Zhao, Z. Ding, I. Verzhbitshiy, L. Li, J. Lu, J. Cen, G. Eda and K. Loh, Adv. Mater., 2016, 28, 6457–6464 CrossRef CAS PubMed.
- C. Naylor, N. Kybert, C. Schneier, J. Xi, G. Romerot, J. Saven, R. Liu and A. Johnson, ACS Nano, 2016, 10, 6173–6179 CrossRef CAS PubMed.
- X. Lin, Y. Ni and S. Kokot, Biosens. Bioelectron., 2016, 79, 685–692 CrossRef CAS PubMed.
- J. Huang, Z. Dong, Y. Li, J. Li, W. Tang, H. Yang, J. Wang, Y. Bao, J. Jin and R. Li, Mater. Res. Bull., 2013, 48, 4544–4547 CrossRef CAS.
- G. Fan, H. Zhu, D. Du, J. Zhang, J. Zhu and Y. Lin, Anal. Chem., 2016, 88, 3392–3399 CrossRef CAS PubMed.
- Y. Zhu, J. Peng, L. Jiang and J. Zhu, Analyst, 2014, 139, 649–655 RSC.
- L. Mao, F. Xu, Q. Xu and L. Jin, Anal. Biochem., 2001, 292, 94–101 CrossRef CAS PubMed.
- M. Ishii, K. Shibata and H. Nozaki, Solid State Chem., 1993, 105, 504–511 CrossRef CAS.
- T. Hurmar and S. Kose, Optik International Journal for Light and Electron Optics, 2016, 127, 6000–6006 CrossRef.
- X. Li, A. Tang, J. Li, L. Guan, G. Dong and F. Teng, Nanoscale Res. Lett., 2016, 11, 171 CrossRef PubMed.
- X. Zhang, X. Huang, M. Xue, X. Ye, W. Lei, H. Tang and C. Li, Mater. Lett., 2015, 148, 67–70 CrossRef CAS.
- L. Zhang, M. Chen, Y. Jiang, M. Chen, Y. Ding and Q. Liu, Sens. Actuators, B, 2017, 239, 28–35 CrossRef CAS.
- L. Qian, J. Mao, X. Tian, H. Yuan and D. Xiao, Sens. Actuators, B, 2013, 176, 952–959 CrossRef CAS.
- V. Shumyantseva, T. Bulko, L. Sigolaeva, A. Kuzikov and A. Archakov, Biosens. Bioelectron., 2016, 86, 330–336 CrossRef CAS PubMed.
- S. Tuteja, R. Chen, M. Kukkar, C. Song, R. Mutreja, S. Singh, A. Paul, H. Lee, K. Kim, A. Deep and C. Suri, Biosens. Bioelectron., 2016, 86, 548–556 CrossRef CAS PubMed.
- Y. Wang, H. Sun, R. Li, P. Ke, H. Zhu, H. Guo, M. Liu and H. Sun, Anal. Methods, 2016, 8, 7324–7330 RSC.
- V. Kumar, J. Brent, M. Shorie, H. Kaur, G. Chadha, A. Thomas, E. Lewis, A. Rooney, L. Nguyen, X. Zhong, M. Burke, S. Haigh, A. Walton, P. McNaughter, A. Tedstone, N. Savjani, C. Muryn, P. O'Brien, A. Ganguli, D. Lewis and P. Sabherwal, ACS Appl. Mater. Interfaces, 2016, 8, 22860–22868 CAS.
- S. Taghdisi, N. Danesh, M. Ramezani, A. Emrani and K. Abnous, Biosens. Bioelectron., 2016, 80, 532–537 CrossRef CAS PubMed.
- K. Abnous, N. Danesh, A. Emrani, M. Ramezani and S. Taghdisi, Anal. Chim. Acta, 2016, 917, 71–78 CrossRef CAS PubMed.
- R. Tang, H. Yang, J. Choi, Y. Gong, J. Hu, S. Feng, B. Pinguang-Murphy, Q. Mei and F. Xu, Talanta, 2016, 152, 269–276 CrossRef CAS PubMed.
- V. Kumar, M. Shorie, A. Ganguli and P. Sabherwal, Biosens. Bioelectron., 2015, 72, 56–60 CrossRef CAS PubMed.
| This journal is © The Royal Society of Chemistry 2017 |