 Open Access Article
Creative Commons Attribution 3.0 Unported Licence
Crystal structure, tunable luminescence and energy transfer properties of Na3La(PO4)2:Tb3+,Eu3+ phosphors†
Dan Qin and
Wanjun Tang*
Hubei Key Laboratory for Catalysis and Material Science, College of Chemistry and Material Science, South-Central University for Nationalities, Wuhan 430074, P. R. China. E-mail: tangmailbox@126.com; Fax: +86-27-67842752; Tel: +86-27-67842752
First published on 5th December 2016
Abstract
A series of Tb3+ and/or Eu3+ doped Na3La(PO4)2 phosphors were successfully synthesized and their crystal structure and photoluminescence (PL) properties were investigated in detail. Double phosphates with the compositions Na3Tb(PO4)2 and Na3Eu(PO4)2 were obtained by the substitution of Tb or Eu for La in the Na3La(PO4)2 host. XRD pattern analysis indicates that these obtained compounds crystallize in the orthorhombic system with the space group Pbc21. The crystal structure of the Na3RE(PO4)2 (RE = Tb, Eu) is made up of isolated PO4 tetrahedra and of sodium and RE atoms arranged in an ordered way. The REOy polyhedra are isolated from one another, resulting in a high critical concentration of Tb3+ or Eu3+ activators. Under excitation of near-ultraviolet (NUV) irradiation, Tb3+ doped Na3La(PO4)2 shows a blue-greenish emission with a predominant peak at 546 nm, while the emission spectra of Eu3+-doped Na3La(PO4)2 exhibits a reddish orange emission due to the 5D0 → 7FJ transitions of Eu3+ ions. The energy transfer from Tb3+ to Eu3+ in the Na3La(PO4)2 host is demonstrated by the luminescence spectra and fluorescence decay dynamics. Meanwhile, the emission color of Na3La(PO4)2:Tb3+,Eu3+ can be tuned from green to red through tuning the Tb3+/Eu3+ ratio. These results indicate that the Na3La(PO4)2:Tb3+,Eu3+ phosphor exhibits broadband NUV absorption and green-reddish orange tunable emission, which might serve as a down-converting phosphor for NUV light-emitting diodes.
Introduction
Rare earth (RE) ions play an irreplaceable role in the development of lighting and display fields due to their abundant emission colors based on 4f–4f or 5d–4f transitions.1–3 Recently, RE3+ ion doped phosphors based on double phosphate hosts have drawn much attention because of their high luminous efficiency, low sintering temperature, high thermal and chemical stability, and low cost.4,5 Double phosphates of mono- and trivalent cations with the general formula MI3NIII(PO4)2 (MI = Na, K; NIII = Y, Sc, In, Fe, rare earth elements) have high thermal and chemical stability and their host absorption edge locates at a rather short wavelength (about 140–180 nm),6 making them excellent host materials for luminescent materials. MI3NIII(PO4)2 compounds crystallize in a trigonal, orthorhombic or monoclinic structure, depending on the type of MI or NIII cations.7 Among them, Na3RE(PO4)2 (RE = La–Tb) compounds crystallize orthorhombic with the glaserite-type structure. They are built up on isolated REOy polyhedral and PO4 tetrahedra.8 The presence of this particular structure suggests that the lattice can accommodate other cations with similar radii and charges without significant changes to the structural frame.9 Furthermore, this structure can weaken the concentration quenching effect and the critical concentration of activator ions is much higher than that of conventional inorganic phosphors. Therefore, the structure and optical properties of Na3RE(PO4)2-related phosphors have been extensively studied. A great number of glaserite-type phosphors, such as Na3Y(PO4)2:Ce3+,10 Na3La(PO4)2:Er3+,11 Na3Gd(PO4)2:Ce3+,12 and Na3RE(PO4)2:Yb3+ (RE = Y, La, Gd)13 have been reported. Meanwhile, most of the phosphors are single-colored, and combining different phosphors is applied when a multicolor emission is needed. However, this combination suffers from the disadvantages of reabsorption among phosphors and different degradation rates.14 Therefore, great efforts have been devoted to develop single-host phosphors with a multicolor emission to meet the increasing demand of different illumination applications. In order to achieve color tunable emitting in single-phase hosts, several strategies are used, including controlling the temperature,15 band-gap modulation,16 crystal field adjustment,17 the combination of multiple rare ions with various color emissions,18 and codoping ion pairs based on the energy transfer mechanism. Codoping different rare earth ions as sensitizers and activators in a single matrix is one of the most popular methods to control the emission color via energy transfer processes.19 Additional, tunable multicolor emission can be realized in phosphors under a single excitation wavelength. The multicolor tuning of phosphors has been achieved by co-doping RE3+ ion into suitable host lattice, such as Eu3+–Bi3+,20 Tm3+–Dy3+ (ref. 21) and Tb3+–Eu3+.22–24It has been reported that Na3La(PO4)2 crystallizes in the orthorhombic structure.8 Eu3+ and Tb3+ ions are frequently used as red and green activators in luminescent materials.19 However, the luminescence properties of Tb3+ and/or Eu3+ ions in Na3La(PO4)2 host under near ultraviolet (NUV) light excitation have not been reported, and so far the energy transfer phenomenon from Tb3+ to Eu3+. In this contribution, Na3La(PO4)2 was chosen as the host material. The structure, luminescence properties and chromaticity stability of Tb3+ and/or Eu3+ activated Na3La(PO4)2 samples are studied in detail. The energy transfer process between Tb3+ and Eu3+ ions as well as the potential luminescence mechanism has been analyzed in Na3La(PO4)2 host upon the excitation wavelength of 378 nm irradiation.
Experimental
Powder samples of Na3La1−x(PO4)2:xEu3+ (x = 0–1.0), Na3La1−y(PO4)2:yTb3+ (y = 0–1.0), Na3La0.7−xTb0.3(PO4)2:xEu3+ (x = 0–0.7), and Na3La0.95−yEu0.05(PO4)2:yTb3+ (y = 0–0.95) were prepared as follows. Stoichiometric amounts of analytical reagents NaNO3, NH4H2PO4, and 99.99% pure La2O3 were mixed. An appropriate amount of CO(NH2)2 was added as fuel. 99.99% pure Eu2O3 and Tb4O7 were dissolved in HNO3 to convert into nitrate completely. These reagents were dissolved in water and then introduced into a muffle furnace maintained at 600 °C for 5 min. The obtained processor was subsequently ground in an agate mortar and then reacted at 900 °C for 4 h in air atmosphere. Finally, the products were gradually cooled to room temperature and reground for further measurements.The phase purity of the products was checked by powder X-ray diffraction (XRD) using a Bruker D8 X-ray diffractometer (Bruker Co. Ltd., Karlsruhe, Germany) with Cu Kα radiation (λ = 1.5406 Å), operating at 40 kV and 40 mA. Structure refinements of XRD data were performed using the computer software General Structure Analysis System (GSAS) program.25 The luminescence emission and excitation spectra of the samples were measured on a fluorescence spectrophotometer (F-7000, Hitachi, Japan) equipped with a 150 W Xe light source. The luminescence decay data were collected on an Edinburgh FLS920 combined fluorescence lifetime and steady state spectrometer with a 450 W xenon lamp and 60 μF flash lamp. For comparison, all measurements were conducted at room temperature with the identical instrumental parameters.
Results and discussion
Phase identification and crystal structure
The XRD patterns of Tb3+ and/or Eu3+ doped Na3La(PO4)2 samples were measured at room temperature. Fig. 1 shows the powder XRD profiles of some representative samples. No records of Na3La(PO4)2, Na3Tb(PO4)2 and Na3Eu(PO4)2 are available in Joint Committee on Powder Diffraction Standards (JCPDS) or Inorganic Crystal Structure Database (ICSD). As shown in Table 1, the radius Nd3+ is quite close to that of La3+, Eu3+ and Tb3+.26 The compound Na3Nd(PO4)2 is isostructural with Na3RE(PO4)2 (RE = La, Eu and Tb). Therefore, the standard data of Na3Nd(PO4)2 (ICSD no. 100593) serve as a certified reference.27 As presented in Fig. 1a, most of the samples are consistent with the standard file of Na3Nd(PO4)2, indicating that the obtained samples are single phase and heavily doping Tb and/or Eu ions do not change the crystal structure. This is attributed to that Tb3+ or Eu3+ occupies La3+ sites for their similar radii and identical valence. However, as an exceptional case, two additional weak diffraction peaks at 30.95° and 34.27° ascribed to Na6La(PO4)3 as a second phase can be discerned for the Na3La(PO4)2 sample. A small shift of the XRD peaks of the Na3RE(PO4)2 (RE = La, Eu, Tb) samples in comparison to the standard data of Na3Nd(PO4)2 can be observed in Fig. 1b. The characteristic peak (3 4 2) shifts to the higher angle as the RE3+ sites are substituted by the La3+ → Nd3+ → Eu3+ → Tb3+ with the decrease of ionic radii. According to Bragg's diffraction equation, 2d![[thin space (1/6-em)]](https://www.rsc.org/images/entities/char_2009.gif) sin
sin![[thin space (1/6-em)]](https://www.rsc.org/images/entities/char_2009.gif) θ = nλ, in which n is an integer, λ is the X-ray wavelength, d is the spacing between the planes in the atomic lattice, and θ is the angle between the incident ray and the scattering planes. The substitution of the La3+ ions in the crystallographic structure by the smaller Tb3+ or Eu3+ ions reduces the cell dimensions of the crystal, leading to the increase of the 2θ value.
θ = nλ, in which n is an integer, λ is the X-ray wavelength, d is the spacing between the planes in the atomic lattice, and θ is the angle between the incident ray and the scattering planes. The substitution of the La3+ ions in the crystallographic structure by the smaller Tb3+ or Eu3+ ions reduces the cell dimensions of the crystal, leading to the increase of the 2θ value.
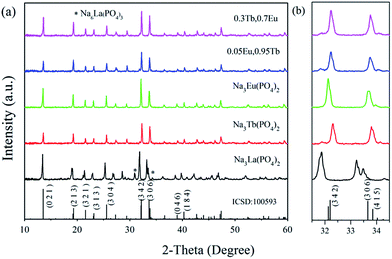 | ||
| Fig. 1 Representative XRD patterns of Na3RE(PO4)2 (RE = La, Tb, Eu) samples and ICSD no. 100593 (a); magnified XRD patterns in the region from 31.5 to 34.5 deg (b). | ||
| y | Ionic radius (Å) | |||
|---|---|---|---|---|
| La3+ | Nd3+ | Eu3+ | Tb3+ | |
| 6 | 1.032 | 0.983 | 0.947 | 0.923 |
| 7 | 1.10 | — | 1.01 | 0.98 |
| 8 | 1.16 | 1.109 | 1.066 | 1.04 |
Reported by Salmon et al.,27 Na3Nd(PO4)2 crystallizes in Pbc21 (no. 29) space group and orthorhombic crystal system (ICSD no. 100593). As shown in Fig. 1, solid solutions of Na3RE(PO4)2 (RE = La, Eu and/or Tb) may exist due the same valence and similar radii of these ions.28 Meanwhile, there are a lot of evidence about the iso-structural of orthorhombic Na3Nd(PO4)2 with other sodium and rare-earth double orthophosphates Na3RE(PO4)2 (RE = Y, La–Er).10,12,29,30 Here the crystal structure data of Na3Nd(PO4)2 is used as a starting model to refine the crystal structure. Fig. 2a and b exhibit the experimental, calculated and difference results from the Rietveld refinement of the two end components Na3Tb(PO4)2 and Na3Eu(PO4)2, respectively. All of the observed peaks can be indexed to the corresponding data. We can conclude that the desired single-phase phosphors with a glaserite-type structure have been synthesized and the patterns have not changed by doping Tb3+ and/or Eu3+ ions. No other phase or impurity can be detected, confirming the formation of a single phase. The low values of Rwp, Rp and χ2 shown in Table 2 indicate that the refined crystal structure data are reliable. Both Na3Tb(PO4)2 and Na3Eu(PO4)2 crystallize in the orthorhombic crystal system with space group Pbc21 and N = 24. Their unit cell parameters differ from that of Na3Nd(PO4)2 (a = 15.874 Å, b = 13.952 Å, c = 18.470 Å, V = 4090.63 Å3), resulted from the substitution of Nd3+ by Tb3+ or Eu3+. The Rietveld analysis shows that the samples are in crystalline phase and no phase mixture was observed. Rietveld plots of Na3Tb0.95Eu0.5(PO4)2 and Na3Tb0.3Eu0.7(PO4)2 are presented in Fig. S1 and S2 (in the ESI†), respectively. All of the observed peaks satisfy the reflection conditions, confirming the formation of a single phase with no impurities. The remarkable good fit between the experimental data and calculated line confirm the phase purity of the as-prepared samples.
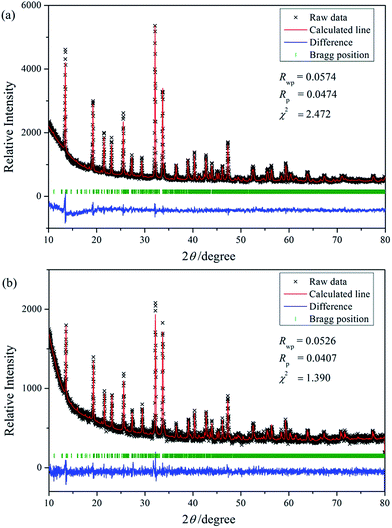 | ||
| Fig. 2 Rietveld analysis patterns for X-ray powder diffraction data of Na3Tb(PO4)2 (a) and Na3Eu(PO4)2 (b) compounds. | ||
| Sample | Na3Tb(PO4)2 | Na3Eu(PO4)2 |
|---|---|---|
| Space group | Pbc21 | Pbc21 |
| Symmetry | Orthorhombic | Orthorhombic |
| a/Å | 15.899 | 15.920 |
| b/Å | 13.950 | 13.936 |
| c/Å | 18.405 | 18.425 |
| V/Å3 | 4082.1 | 4087.8 |
| α = β = γ, deg | 90 | 90 |
| Rwp, % | 5.74 | 5.26 |
| Rp, % | 4.74 | 4.07 |
| χ2 | 2.472 | 1.390 |
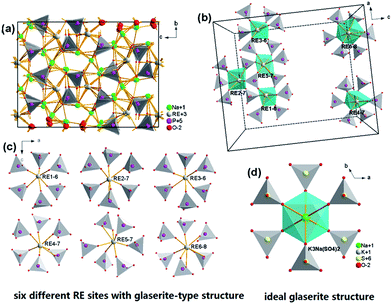
Fig. 3a depicts the crystal structure of the Na3RE(PO4)2 (RE = La, Eu, Tb) unit cell viewed along a-direction from the parallel projection, the coordination environment of RE3+ sites, and the ideal glaserite structure. The Na3RE(PO4)2 framework is made up of isolated PO4 tetrahedron and [REOy] (y = 6, 7, 8) polyhedron that arranged in an ordered way which results in the tunnel. The basic structure units are helical ribbons [REOy] formed by six corner sharing [PO4] tetrahedron that alternate “up” and “down.”. The pinwheels are linked through [PO4] tetrahedra to form layers with alkali atoms located between the layers. Fig. 3b and c demonstrate the six kinds of RE sites in a unit cell along b-direction. The ribbons run along some directions of unit-cell with a period of four or eight tetrahedral. The coordination of the RE atoms is 6-folded for RE1 and RE3, 7-folded for RE2, RE4, RE5 and 8-folded for RE6. The variety in coordination numbers is due to a rotation of the certain [PO4] tetrahedron around one of their edges. The REOy polyhedral are isolated because they do not share any O atom. In addition, the shortest RE–RE distances in Na3Tb(PO4)2 and Na3Eu(PO4)2 are about 4.641 and 4.646 Å (RE2–RE5), respectively, which is a long distance that energy migration of the doped rare earth ions is difficult, similar observation has also been witnessed in some systems such as Na3Gd1−xEux(PO4)2 (ref. 31) and Na3Gd(PO4)2:Ce3+.12
Luminescence properties of Tb3+ and/or Eu3+ doped Na3La(PO4)2 phosphors
Fig. 4 illustrates the UV-vis excitation (PLE, λem = 546 nm) and emission (PL, λem = 378 nm) spectra of Na3La1−x(PO4)2:xTb3+ with x = 0.01–1.0. The PLE spectrum of Na3Tb(PO4)2 involves several sharp lines in the 280–420 nm range. The sharp f–f excitation lines at about 302, 317, 340, 351, 358, 368, 378 and 486 nm are assigned to 7F6–5H6, 7F6–5H7, 7F6–5G2, 7F6–5D2, 7F6–5L10, 7F6–5G6 and 7F6–5D4, respectively.31 Under 378 nm NUV excitation, the PL spectrum of Na3La0.99(PO4)2:0.01Tb3+ presents a group of 5D3,4 → 7FJ transitions: 5D3 → 7F5 (415 nm), 5D3 → 7F4 (437 nm), 5D4 → 7F6 (490 nm), 5D4 → 7F5 (546 nm), 5D4 → 7F4 (586 nm) and 5D4 → 7F3 (623 nm). With the increase of Tb3+ concentration (x), the blue emissions from the 5D3 → 7F5,4 transitions are quenched gradually, while the green emissions from the 5D4 → 7F6,5,4,3 transitions increase continuously. For the Tb3+ ion, the energy gap between the 5D3 and 5D4 levels is about 5915 cm−1, which is quite close to that between 7F6 and 7F0 levels (6000 cm−1).32 Hence, if the Tb3+ concentration (y) is high enough, the emission from the 5D3 level of Tb3+ is much weaker than that from the 5D4 level due to the cross relaxation via the resonant energy transfer process: Tb3+ (5D3) + Tb3+ (7F6) → Tb3+ (5D4) + Tb3+ (7F0) and the green emission of the 5D4 → 7F5 (546 nm) becomes predominant.33 The PL intensity of Tb3+ 5D4 → 7F5 transition increases gradually with its concentration (x) increasing, and reaches a maximum at x = 1. This result indicates that no concentration quenching exists in the Na3La(PO4)2 host among the Tb3+ ions. The Na3Tb(PO4)2 sample shows strong green emission under 378 nm NUV irradiation excitation, which makes it be a potential green phosphor for NUV LED application.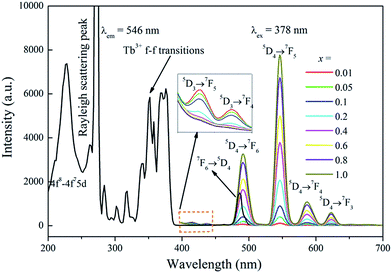 | ||
| Fig. 4 The PLE spectrum of Na3Tb(PO4)2 and the PL spectra of Na3La1−x(PO4)2:xTb3+ (x = 0.01–1.0) samples. | ||
The PLE spectrum of Na3Eu(PO4)2 and PL spectra of Na3La1−y(PO4)2:yEu3+ (y = 0.01–1.0) are shown in Fig. 5. The PLE spectrum consists of a weak broad band assigned to the charge-transfer transition (CTB) between Eu3+ and O2−, some narrow lines in the range of 230–320 nm (the strongest peak located at about 306 nm is due to Rayleigh scattering), and several sharp lines from 360–480 nm. These sharp lines correspond to the characteristic f → f transitions of Eu3+ ions within its 4f6 configuration. They are ascribed to 7F0 → 5D4 (360 nm), 7F0 → 5GJ,5L7 (381 nm), 7F0 → 5L6 (394 nm), 7F0 → 5D3 (414 nm), and 7F0 → 5D2 (464 nm) transitions of Eu3+ ion, respectively. Excitation into the 7F0 → 5L6 transition of Eu3+ at 394 nm yields some characteristic emission lines from the 5D0,1 excited states to the 7FJ ground states, i.e., 5D1 → 7F1 (536 nm), 5D1 → 7F2 (556 nm), 5D0 → 7F1 (594 nm), 5D0 → 7F2 (620 nm), 5D0 → 7F3 (655 nm), and 5D0 → 7F4 (703 nm), respectively.34 However, the 5D0 → 7F0 transition (about 580 nm) is very weak and can hardly be detected.
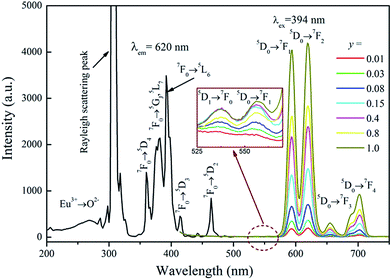 | ||
| Fig. 5 The PLE spectrum of Na3Eu(PO4)2 and the PL spectra of Na3La1−y(PO4)2:yEu3+ (y = 0–1) samples. | ||
The two dominant bands at 594 (5D0 → 7F1 transition) and 620 nm (5D0 → 7F2 transition) confer on the sample an orange-red luminescence upon excitation with 394 nm light. It is known that the magnetic-dipole transition 5D0 → 7F1 is insensitive to the symmetry of the Eu3+ site, while the forced electric dipole transition 5D0 → 7F2 is hypersensitive to the local environment.35,36 Therefore, the intensity ratio (R) of (5D0 → 7F2)/(5D0 → 7F1) gives a measure of the Eu3+ site symmetry in the lattice. A higher value of R (R > 1) suggests that Eu3+ locates at the site without inversion symmetry. Otherwise, Eu3+ ion locates at the site with inversion symmetry, leading to a lower value of R (1 > R > 0).37 As shown in Fig. 3d, Na+ has an inversion symmetric environment in the ideal glaserite structure of K3Na(SO4)2. However, upon substitution of Na+ sites by RE3+, there will be some distortion in NaO6 octahedron. The Na3RE(PO4)2 structure seems to be a distorted glaserite structure. In this structure six different types of REOy polyhedral can be expected. Hence, the Eu3+ ion may occupy six sites in the Na3RE(PO4)2 lattice, as shown in Fig. 3b and c. Here, the intensity of 5D0 → 7F1 is comparable with that of 5D0 → 7F2. The value of R calculated is about 1.02, indicating that the Eu3+ ions occupies a symmetric and a non-symmetric site almost equally. This agrees with the results of Eu3+ doped K3Y(PO4)2 (ref. 34) and Na3Y(PO4)2 (ref. 38) but challenges the results of Eu3+ doped Rb3Y2(PO4)3 and Rb3La(PO4)2.39
The PL intensity (5D0 → 7F2) of Na3La1−y(PO4)2:yEu3+ increases with increasing Eu3+ concentration (y) until a maximum intensity about y = 1.0 is reached. These observations confirm that the concentration quenching of Eu3+ does not occur in Na3La(PO4)2 host, so highly doping concentration samples are performed here.
It is worthy to be noted that both Na3La1−x(PO4)2:xTb3+ and Na3La1−y(PO4)2:yEu3+ phosphors have a much high quenching concentration, actually the complete quenching would not occur even at x or y = 1.0, at which the La3+ sites are replaced by Tb3+ or Eu3+ completely. Taking into account the inherent structural feature of Na3RE(PO4)2 host, in which the Tb3+ or Eu3+ ions occupy the RE3+ sites of polyhedral which isolate from each other by a large spatial distance and join by RE–O–P–O–RE. The large spatial distance between RE3+ ions and the shielding of PO4 tetrahedrons hinders the long range energy transfer between Tb3+ or Eu3+ ions and consequently prevents the occurrence of concentration quenching. Therefore, the high concentration quenching was observed in Na3La1−x(PO4)2:xTb3+ and Na3La1−y(PO4)2:yEu3+ phosphors. The similar phenomenon was also reported by Chen et al. in K3R(PO4)2:Tb3+ (R = Y and Gd) phosphors,40 Ju et al. in Na3Gd1−xEux(PO4)2 phosphors,30 and Jiang et al. in K3Gd(PO4)2:Tb3+,Eu3+ phosphor.41
In order to obtain multicolor tunable luminescence of the Na3La(PO4)2 phosphor, Tb3+ and Eu3+ ions with different relative concentration into the Na3La(PO4)2 host lattice were codoped in our work. The PLE and PL spectra of the Na3La0.65(PO4)2:0.3Tb3+,0.05Eu3+ sample are shown in Fig. 6. For comparison, the PLE and PL spectra of Na3Tb(PO4)2 and Na3Eu(PO4)2 are also presented. The PLE spectrum (Fig. 6c) of the Na3La0.65(PO4)2:0.3Tb3+,0.05Eu3+ by monitoring the emission of Tb3+ at 546 nm is almost identical to that of Na3Tb(PO4)2 (Fig. 6a) within the experimental error. The PLE band/line of Eu3+ is undetectable, implying that Eu3+ cannot transfer energy to Tb3+. The PLE spectrum recorded at the 620 nm of Eu3+ emission is dominated by Tb3+ bands/lines, which are similar to that of monitoring the Tb3+-emission, but shows large difference with that of Eu3+ (Fig. 6b). Only several f–f transition lines of Eu3+ are evidently observed (marked by stars in Fig. 6c). The presence of Tb3+-related PLE bands/lines in the PLE spectrum of Eu3+ emission clearly indicates the occurrence of energy transfer from Tb3+ to Eu3+. Upon 394 nm excitation (7F0 → 5L6 of Eu3+), only emission from Eu3+ is observed, and the positions of all emission peaks are identical to those in Fig. 6b of Na3Eu(PO4)2. Excited at 378 nm UV irradiation (7F6 → 5G6 of Tb3+), the characteristic sharp emissions from both Eu3+ and Tb3+ can be detected, confirming that Tb3+ can partially transfer excitation energy to Eu3+ via its absorption of 4f state. Therefore, the relative intensities of these two emissions can be varied by adjusting the concentrations of the two activators through the principle of energy transfer.
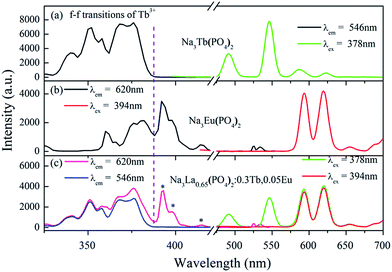 | ||
| Fig. 6 PLE and PL spectra of Na3Tb(PO4)2 (a), Na3Eu(PO4)2 (b), and Na3La0.65(PO4)2:0.3Tb3+,0.05Eu3+ (c). | ||
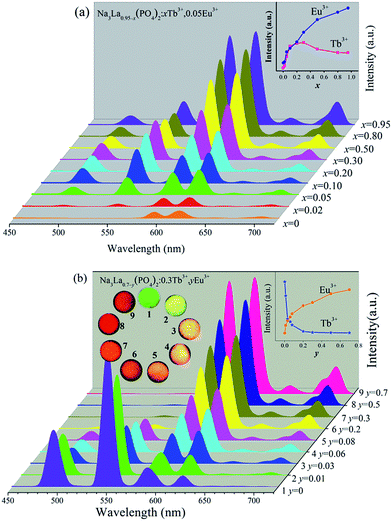
Fig. 7 illustrates the variations of PL spectra and corresponding intensities of Na3La0.95−x(PO4)2:xTb3+,0.05Eu3+ and Na3La0.7−y(PO4)2:0.3Tb3+,yEu3+ phosphors. The emission profile of all the Tb3+/Eu3+ codoped samples contain the characteristic sharp emission peaks of both Tb3+ and Eu3+ under excitation at 378 nm. The increasing concentrations of the Eu3+ or Tb3+ ions bring no obvious alteration in the intensity ratio of (5D0 → 7F2)/(5D0 → 7F1), indicating that the degree of the local symmetry around Eu3+ ions keeps constant. As shown in Fig. 7a, the PL intensities of Eu3+ at 620 nm increase systematically with increasing the Tb3+ concentration (x), because the increase of Tb3+ concentration results in more sensitizers transferring the energy to Eu3+ ions. Meanwhile, the Tb3+ green emission intensity reaches its maximum at x = 0.3, and then decreases due to the concentration quenching effect with further increasing the Tb3+ concentration (x). The inset of Fig. 7a depicts the dependences of the PL intensities ((5D4 → 7F5 transition of Tb3+; 5D0 → 7F2 transition of Eu3+; λex = 378 nm)) on the Tb3+ concentration (y). The Eu3+ PL intensity is enhanced about 11 times by codoping with Tb3+. In Fig. 7b, the PL intensity of Tb3+ decreases monotonously with the increase of Eu3+ concentration from y = 0 to 0.7, while the Eu3+ PL intensity increases to a maximum at y = 0.7. This observation indicates that the energy transfer from Tb3+ to Eu3+ ions can occur in current excitation condition in Tb3+/Eu3+ codoped Na3La(PO4)2 phosphor. Therefore, the relative intensities of these two emissions can be varied by adjusting the concentrations of the two activators through the principle of energy transfer to realize the tunable emission color. The digital emission color photos were depicted in the inset of Fig. 7b, clearly indicating that the emission color can be tuned from green to reddish orange with increasing the Eu3+ concentration (y).
Decay curves and energy transfer mechanism
It has been witnessed that an efficient energy transfer from Tb3+ to Eu3+ occurs in Na3La(PO4)2 host. In order to further investigate the energy transfer between Tb3+ and Eu3+ in Na3La(PO4)2, luminescent decay curves of Tb3+ emission and Eu3+ emission in Na3La0.7−y(PO4)2:0.3Tb3+,yEu3+ (y = 0–0.7) samples have been measured. The decay curves monitored at 546 nm (Tb3+ 5D4 → 7F5 transition) and 620 nm (Eu3+ 5D0 → 7F5 transition) with excitation of 378 nm irradiation are presented in Fig. 8a and b, respectively.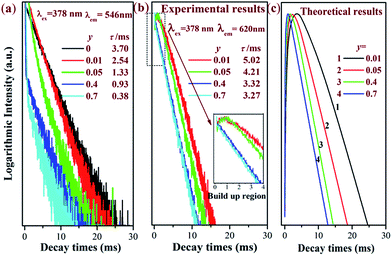 | ||
| Fig. 8 Luminescence decay curves of Tb3+ 546 nm emission (5D4 → 7F5) (a), Eu3+ 620 nm emission (5D0 → 7F5) (b) and the corresponding simulation curves (c). | ||
It is found that the decay curves of Tb3+ emission cannot be fitted in terms of a single-exponential function, but can be well fitted by a double-exponential function:
I = A1![[thin space (1/6-em)]](https://www.rsc.org/images/entities/char_2009.gif) exp(−t/τ1) + A2 exp(−t/τ1) + A2![[thin space (1/6-em)]](https://www.rsc.org/images/entities/char_2009.gif) exp(−t/τ2) exp(−t/τ2)
| (1) |
| τ = (A1τ12 + A2τ22)/(A1τ1 + A2τ2) | (2) |
The values of τTb are calculated to be 3.70, 2.54, 1.33, 0.93 and 0.38 ms for Na3La0.7−y(PO4)2:0.3Tb3+,yEu3+ phosphors with y = 0, 0.01, 0.05, 0.4 and 0.7. As shown in Fig. 9, the effective lifetime of Tb3+ ions decreases with the increase of Eu3+ due to the ETTb→Eu process.
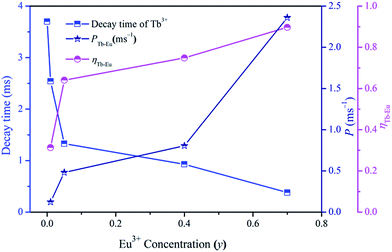 | ||
| Fig. 9 Dependence of Tb3+ decay time, PTb→Eu and ηTb→Eu on Eu3+ concentration (y) in Na3La0.7−y(PO4)2:0.3Tb3+,yEu3+. | ||
For the ETTb→Eu process, the transfer probability (PTb→Eu) can be expressed by eqn (3)42
| PTb→Eu = 1/τ − 1/τ0 | (3) |
| ηTb→Eu = 1 − τ/τ0 | (4) |
The values of PTb→Eu and ηTb→Eu are calculated and are also shown in Fig. 9. Both the values of PTb→Eu and ηTb→Eu increase obviously with increasing the Eu3+ concentration (y), indicating that the energy-transfer process become more efficient with high Eu3+ ion concentration.
Fig. 8b illustrates the decay curves of Eu3+ emission. All the decay curves of Eu3+ emission could be well fitted into singly exponential equation
It = I0![[thin space (1/6-em)]](https://www.rsc.org/images/entities/char_2009.gif) exp(−t/τ) exp(−t/τ)
| (5) |
It is obvious that the Eu3+ decay curves recorded at the 5D0 → 7F5 transition (620 nm) exhibit a rising step. The fluorescence intensity increases with increasing time, then reaching a maximum, and finally decreases until the decay process completes. Therefore, there are two different processes for the emission of Eu3+: decay process and build-up process. In the initial build-up process, the energy absorbed by the 7F6 → 5G6 transition of Tb3+ ions is transferred to Eu3+ ions. This process is significantly influenced by the Eu3+ concentration. As shown in Fig. 8b, with increasing the Eu3+ concentration (y), the initial build-up process becomes faster and faster, suggesting that the ETTb→Eu process becomes more efficient with higher Eu3+ concentration.43 When the Na3La0.7−y(PO4)2:0.3Tb3+,yEu3+ samples are excited by 378 nm irradiation, the rate equations for the population densities in the 5D4 level of Tb3+ and the 5D0 of Eu3+ ion can be expressed as follows,44
| dNTb/dt = −NTb/τTb − KTb–EuNTb | (6) |
| dNEu/dt = −NEu/τEu + KTb–EuNTb | (7) |
 | (8) |
Using the measured values of τTb and τEu, the simulation curves for Na3La0.7−y(PO4)2:0.3Tb3+,yEu3+ samples are obtained as presented in Fig. 8c, which show two process for Eu3+ emission, being similar to the measured curves. That is to say, the theoretical results are consistent with the experimental observations.
In general, the energy transfer between the sensitizer and activator may take place via exchange interaction and multipolar interaction. The energy transfer mechanism can be determined using the following relationship:45
| ln(I0/I) ∝ C and IS0/IS ∝ Cα/3 | (9) |
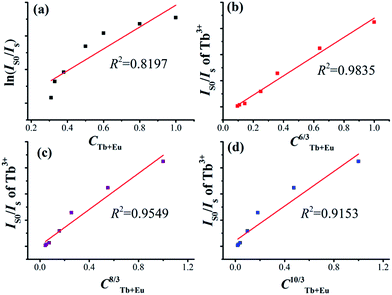 | ||
| Fig. 10 Dependence of ln(IS0/IS) on CTb+Eu (a) and the dependence of IS0/IS on CTb+Eu6/3 (b), CTb+Eu8/3 (c) and CTb+Eu10/3 (d). | ||
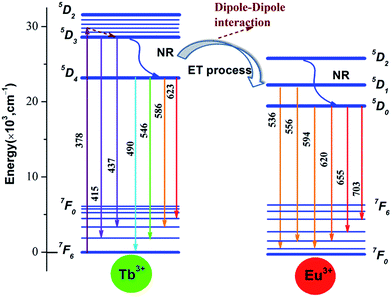
The scheme of energy transfer from Tb3+ to Eu3+ in Na3La(PO4)2 host is demonstrated in Fig. 11. Tb3+ ions absorb the energy from 378 nm irradiation and are excited from the ground state of (7F6) to the excited states of 5DJ (J = 2, 3, 4). Some of the excited Tb3+ radiative transmit from 5D3 to the ground state 7F6 directly with relatively weaker blue light emission of 415 and 437 nm, and other excited Tb3+ relax to the lowest excited state 5D4 through non-radiative transition, then radiative decay to the ground state (7F6) with a strong green emission. When Eu3+ ions are codoped, part of the energy from 5D4 to 7FJ transition of Tb3+ will be transferred to Eu3+ through cross-relaxation due the obvious overlap between the 5D4 → 7FJ emission of Tb3+ and 7F0,1 → 5D0,1,2 absorption of Eu3+, then relax to the ground state 5D0 of Eu3+ and finally radiative decay to the ground state (7F0) with an reddish orange emission.44
CIE chromaticity coordinates of Na3La(PO4)2:Tb3+,Eu3+
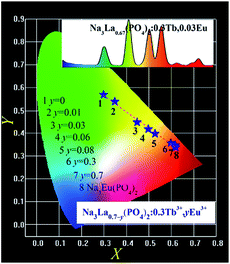
The CIE chromaticity coordinates (X, Y) for Na3La0.7−y(PO4)2:0.3Tb3+,yEu3+ (y = 0–0.7) samples were calculated in the case of 378 nm excitation and the results are shown in Fig. 12. The chromaticity coordinates of Na3Eu(PO4)2 phosphor is also presented. The CIE chromaticity coordinates (X, Y) changes from point 1 (0.2987, 0.5695) to point 7 (0.6203, 0.3505) with the increase of Eu3+ concentration (y). The as formed Na3La0.95−x(PO4)2:xTb3+,0.05Eu3+ (x = 0–0.95) phosphors show typical reddish-orange luminescence. However, their CIE coordinates are too close to be distinguished from each other in a chromaticity diagram with the changes of the Tb3+ ion concentration, so they are not presented.The PL spectrum of Na3La0.67(PO4)2:0.3Tb3+,0.03Eu3+ phosphor shown as inset in Fig. 12 exhibits a green emission of the Tb3+ and the red emission of the Eu3+ ions. These emission lines of Tb3+ and Eu3+ cover the whole visible light region with tunable intensity, resulting in a color-tunable emission. Therefore, it can be expected to achieve color-tunable emission by regulating spectral composition induced by the energy transfer between Tb3+ and Eu3+ ions in the Na3La(PO4)2 host under NUV irradiation excitation. According to Grassman's Laws of additive color mixture,46,47 the emission color of Na3La(PO4)2:Tb3+,Eu3+ can be matched by a linear combination of the emission color of Na3La(PO4)2:Tb3+ and that of Na3La(PO4)2:Eu3+. It is obvious that the coordinate Y changes linearly with the coordinate X as shown in Fig. 12. Plotting y vs. x, a straight line is obtained. The values of intercept, slope, and linear regression coefficient are 0.7782, −0.7037, and 0.9902 respectively. The expression is shown as below:
| Y = 0.7782 − 0.7037X | (10) |
The above equation should mathematically demonstrate the range of chromaticity coordinates that we can obtain by adjusting the Tb3+ and Eu3+ concentrations. It is obvious that the chromaticity coordinates for the Na3La(PO4)2:Tb3+,Eu3+ phosphor falls on a line connecting the two chromaticity coordinates of Na3La(PO4)2:Tb3+ and Na3La(PO4)2:Eu3+, respectively. With increasing the Eu3+ concentration (y), the chromaticity coordinate for Na3La0.7−y(PO4)2:0.3Tb3+,yEu3+ phosphors move from the chromaticity point 1 of Na3La0.7(PO4)2:0.3Tb3+ toward point 8 of Na3Eu(PO4)2 along this straight line. The prepared Na3La(PO4)2:Tb3+,Eu3+ phosphor exhibits efficient tunable emission in the visible-light region upon excitation with NUV irradiation, and might find potential applications in multicolor displays and other optoelectronic devices.
Conclusions
In a conclusion, a series of Tb3+ and/or Eu3+ doped Na3La(PO4)2 phosphors have been successfully synthesized and their luminescence properties have been investigated in detail. The glaserite-like orthorhombic structure provides the Na3La(PO4)2 host the possibility of doping with Tb3+ or Eu3+ ions without substantial luminescence quenching. Tb3+ can efficiently sensitize Eu3+ emission under NUV excitation. The energy transfer mechanism (Tb3+ → Eu3+) was demonstrated to be dominated by a dipole–dipole interaction. The luminescence decay properties of Eu3+ in Na3La(PO4)2:Tb3+,Eu3+ samples under 7F6–5G6 excitation (378 nm) within Tb3+ ions were simulated with the energy transfer theory. The emission color of Na3La0.7−y(PO4)2:0.3Tb3+,yEu3+ phosphors can be tunable from green through yellow and red region by adjusting the Eu3+ concentration. These results indicate that the as-synthesized phosphors may find potential applications as a color-tunable emitting material in solid state lighting.Acknowledgements
This research was financially supported by “the Fundamental Research Funds for the Central Universities”, South-Central University for Nationalities (CZY15002).Notes and references
- S. V. Eliseeva and J. C. G. Bünzli, New J. Chem., 2011, 35, 1165–1176 RSC.
- T. Jüstel, H. Nikol and C. Ronda, Angew. Chem., Int. Ed., 1998, 37, 3084–3103 CrossRef.
- C. Li, J. Yang, P. Yang, H. Lian and J. Lin, Chem. Mater., 2008, 20, 4317–4326 CrossRef CAS.
- T. Katsumata, K. Sasajima, T. Nabae, S. Komuro and T. Morikawa, J. Am. Ceram. Soc., 1998, 81, 413–416 CrossRef CAS.
- W.-R. Liu, C.-H. Huang, C.-W. Yeh, J.-C. Tsai, Y.-C. Chiu, Y.-T. Yeh and R.-S. Liu, Inorg. Chem., 2012, 51, 9636–9641 CrossRef CAS PubMed.
- R. P. Rao, J. Lumin., 2005, 113, 271–278 CrossRef CAS.
- T. Aitasalo, M. Guzik, W. Szuszkiewicz, J. Hölsä, B. Keller and J. Legendziewicz, J. Alloys Compd., 2004, 380, 405–412 CrossRef CAS.
- M. Kloss, B. Finke, L. Schwarz and D. Haberland, J. Lumin., 1997, 72–74, 684–686 CrossRef CAS.
- J. Matt Farmer, L. A. Boatner, B. C. Chakoumakos, C. J. Rawn and J. Richardson, J. Alloys Compd., 2016, 655, 253–265 CrossRef.
- M. Guzik, T. Aitasalo, W. Szuszkiewicz, J. Hölsä, B. Keller and J. Legendziewicz, J. Alloys Compd., 2004, 380, 368–375 CrossRef CAS.
- J. Chékir-Mzali, K. Horchani-Naifer and M. Férid, Superlattices Microstruct., 2015, 85, 445–453 CrossRef.
- H. Liang, Z. Tian, H. Lin, M. Xie, G. Zhang, P. Dorenbos and Q. Su, Opt. Mater., 2011, 33, 618–622 CrossRef CAS.
- A. Matraszek, P. Godlewska, L. Macalik, K. Hermanowicz, J. Hanuza and I. Szczygieł, J. Alloys Compd., 2015, 619, 275–283 CrossRef CAS.
- F. W. Kang, Y. Zhang and M. Y. Peng, Inorg. Chem., 2015, 54, 1462–1473 CrossRef CAS PubMed.
- F. Kang, Y. Zhang, L. Wondraczek, J. Zhu, X. Yang and M. Peng, J. Mater. Chem. C, 2014, 2, 9850–9857 RSC.
- F. Kang, H. Zhang, L. Wondraczek, X. Yang, Y. Zhang, D. Lei and M. Peng, Chem. Mater., 2016, 28, 2692–2703 CrossRef CAS.
- C.-H. Huang, P.-J. Wu, J.-F. Lee and T.-M. Chen, J. Mater. Chem., 2011, 21, 10489–10495 RSC.
- M. Shang, D. Geng, D. Yang, X. Kang, Y. Zhang and J. Lin, Inorg. Chem., 2013, 52, 3102–3112 CrossRef CAS PubMed.
- K. Li, M. Shang, H. Lian and J. Lin, J. Mater. Chem. C, 2016, 4, 5507–5530 RSC.
- F. Kang, Y. Zhang and M. Peng, Inorg. Chem., 2015, 54, 1462–1473 CrossRef CAS PubMed.
- L. Li, Y. Liu, R. Li, Z. Leng and S. Gan, RSC Adv., 2015, 5, 7049–7057 RSC.
- Q. Dan and T. Wanjun, Ceram. Int., 2016, 42, 1538–1544 CrossRef CAS.
- K. Li, S. Liang, M. Shang, H. Lian and J. Lin, Inorg. Chem., 2016, 55, 7593–7604 CrossRef CAS PubMed.
- J. Zhou and Z. Xia, J. Mater. Chem. C, 2014, 2, 6978–6984 RSC.
- A. C. Larson and R. B. Von Dreele, Generalized Structure Analysis System (GSAS), Los Alamos National Laboratory, Los Alamos, NM, 1994, pp. 86–748 Search PubMed.
- R. D. Shannon, Acta Crystallogr., Sect. A: Cryst. Phys., Diffr., Theor. Gen. Crystallogr., 1976, 32, 751–767 CrossRef.
- R. Salmon, C. Parent, M. Vlasse and G. Le Flem, Mater. Res. Bull., 1978, 13, 439–444 CrossRef CAS.
- W. D. Kingery, H. K. Bowen and D. R. Uhlmann, Introduction to Ceramics, Wiley, New York, 1976 Search PubMed.
- W. Liu, D. Wang, Y. Wang, J. Zhang and H. Tao, J. Am. Ceram. Soc., 2013, 96, 2257–2263 CrossRef CAS.
- G. Ju, Y. Hu, L. Chen, X. Wang, Z. Mu, H. Wu and F. Kang, J. Alloys Compd., 2011, 509, 5655–5659 CrossRef CAS.
- C. M. Liu, D. J. Hou, J. Yan, L. Zhou, X. J. Kuang, H. B. Liang, Y. Huang, B. B. Zhang and Y. Tao, J. Phys. Chem. C, 2014, 118, 3220–3229 CAS.
- X. Li, Y. Zhang, D. Geng, J. Lian, G. Zhang, Z. Hou and J. Lin, J. Mater. Chem. C, 2014, 2, 9924–9933 RSC.
- G. Blasse and B. C. Grabmaier, Luminescent Materials, Springer, Berlin, 1994 Search PubMed.
- P. Gupta, A. K. Bedyal, V. Kumar, Y. Khajuria, V. Kumar, E. Coetsee-Hugo, O. M. Ntwaeaborwa and H. C. Swart, Opt. Mater., 2014, 36, 996–1001 CrossRef CAS.
- B. R. Judd, Phys. Rev., 1962, 127, 750–761 CrossRef CAS.
- G. S. Ofelt, J. Chem. Phys., 1962, 37, 511–520 CrossRef CAS.
- G. R. Dillip, S. J. Dhoble, L. Manoj, C. M. Reddy and B. D. P. Raju, J. Lumin., 2012, 132, 3072–3076 CrossRef CAS.
- J. Legendziewicz, M. Guzik and J. Cybińska, Opt. Mater., 2009, 31, 567–574 CrossRef CAS.
- A. Pelczarska, A. Watras, P. Godlewska, E. Radominska, L. Macalik, I. Szczygieł, J. Hanuzaab and P. J. Deren, New J. Chem., 2015, 39, 8474–8483 RSC.
- S. Chen, Y. Wang, J. Zhang, L. Zhao, Q. Wang and L. Han, J. Lumin., 2014, 150, 46–49 CrossRef CAS.
- T. Jiang, X. Yu, X. Xu, H. Yu, D. Zhou and J. Qiu, Opt. Mater., 2014, 36, 611–615 CrossRef CAS.
- Y. C. Li, Y. H. Chang, Y. S. Chang, Y. J. Lin and C. H. Laing, J. Phys. Chem. C, 2007, 111, 10682–10688 CAS.
- J. Zhong, H. Liang, Q. Su, J. Zhou, Y. Huang, Z. Gao, Y. Tao and J. Wang, Appl. Phys. B, 2010, 98, 139–147 CrossRef CAS.
- F. Xie, J. Li, Z. Dong, D. Wen, J. Shi, J. Yan and M. Wu, RSC Adv., 2015, 5, 59830–59836 RSC.
- R. Reisfeld, E. Greenberg, R. Velapoldi and B. Barnett, J. Chem. Phys., 1972, 56, 1698–1705 CrossRef CAS.
- H. Grassman, Philos. Mag., 1854, 7, 254–264 Search PubMed.
- W. Tang and Z. Zhang, J. Mater. Chem. C, 2015, 3, 5339–5346 RSC.
Footnote |
| † Electronic supplementary information (ESI) available: F-7000 instrumental parameters; Fig. S1 Rietveld refinement of the powder XRD pattern of Na3Tb0.95Eu0.5(PO4)2; Fig. S2 Rietveld refinement of the powder XRD pattern of Na3Tb0.3Eu0.7(PO4)2. See DOI: 10.1039/c6ra26164g |
| This journal is © The Royal Society of Chemistry 2017 |

