 Open Access Article
Creative Commons Attribution 3.0 Unported Licence
Effects of graphene oxide on the geopolymerization mechanism determined by quenching the reaction at intermediate states
Shu Yan†
ac,
Peigang He† *ac,
Dechang Jia*abc,
Xiaoming Duanabc,
Zhihua Yangabc,
Shengjin Wangac and
Yu Zhouab
aInstitute for Advanced Ceramics, Harbin Institute of Technology, Harbin 150080, China
bState Key Laboratory of Advanced Welding and Joining, Harbin Institute of Technology, Harbin 150001, Heilongjiang, China
cSchool of Materials Science and Engineering, Harbin Institute of Technology, P. O. Box 433, Harbin 150080, China. E-mail: peiganghe@hit.edu.cn; dcjia@hit.edu.cn; Fax: +86 0451 86414291; Tel: +86 0451 86418792
First published on 28th February 2017
Abstract
The effects of graphene oxide on the geopolymerization reaction products at different times were investigated by quenching the reaction. The phase composition and valence bond structure evolution were investigated systematically. The results show that the ethanol/acetone mixture helps isolate reaction products early in the process (0–24 h). RGO bonded well with the geopolymer matrix during the geopolymerization. The degree of densification increased and the amorphous nature of the material decreased with reaction time. The addition of rGO accelerated the conversion of five and six coordinate Al–O sites into four coordinates and Si atoms forming Q4(3Al) network structure.
1. Introduction
Geopolymers are a class of aluminosilicate materials that have attracted considerable industrial attention as they offer a combination of low densities, low costs, easy processing and environmentally friendly materials.1–5 Geopolymers are synthesized by dissolution of aluminosilicates under highly alkaline conditions, as initially described by Davidovits.1,2 Compared with portland cement, geopolymer slurries can transform to solid state materials after proper setting with better mechanical properties.6,7 However, low strength and brittle nature of geopolymers could not meet the needs in industrial applications.8 Thus, geopolymers composites were produced using particles9,10 and fibers11–14 to overcome the disadvantages.Graphene attracted great interests for its excellent properties (e.g., high specific surface area, unusual thermal, electrical, optical and mechanical properties).15–17 As a new nano filler material, it provided considerable potential in the fabrication of multifunctional polymers and ceramic matrix composites.18–20 In our previous works,9,12,13,21–25 we have investigated Al2O3,9 cenospheres,21 carbon fibers12,13 and graphene oxide (GO)22–25 reinforced geopolymer composites. However, the effects of graphene oxide addition on the geopolymerization mechanism of the rGO/geopolymer (rGO/KGP) during the processing was also not been investigated.
Like cements, much work has been done to study on geopolymerization including theoretical modeling and water removal techniques.26–34 Thus, Xu et al.27 used five-membered alumino-silicate framework ring models in Ab initio calculations. Weng et al.29,30 compared the hydrolysis and condensation reactions between low and high Si/Al ratio geopolymers. The partial charge model predictions and experimental results suggested possible Al and Si monomeric species that might form during the dissolution and condensation process. Mitchell et al.34 reported that polar solvents (acetone or isopropyl alcohol) could help to stop hydration reactions. But aldol reactions can occur by the presence of νC–H during the derivative thermo gravimetric analysis of the reaction products. Chen et al.31 demonstrated a solvent extraction method using a mixture of alcohol and acetone to stop the reaction and acquire samples for nuclear magnetic resonance (NMR) studies. Unfortunately, a detailed understanding of the entire process remains largely elusive.
Since the reaction products of geopolymers depended highly on the raw material, alkali-activated solution and curing conditions,32 the structure changes in the geopolymer matrix used have not been quantitatively characterized especially in the early stages during the geopolymerization process. The reaction products often have considerable water, that interferes with characterization tools, such as Nuclear Magnetic Resonance (NMR) and X-ray diffraction (XRD). Thus, it is quite necessary to develop a method of arresting reaction during the geopolymerization process.
In the present work, we describe such a method and thereafter systematically characterize the effects of graphene oxide on the initial products using micrographs, phase composition, functional group and valence bond structure evolution.
2. Experimental
2.1. Materials
GO powders (Nanjing XFNANO Materials Tech Co., Ltd., Nanjing, China), kaolin (95%, Fengxian Reagent Factory, China), silica sol (40 wt%, Jiangsu Xiagang, Indus, China) and KOH (85%, Tianjin Guangfu Indus., China) were used as starting materials. The metakaolin used for synthesis of geopolymer were obtained from heat treated kaolin at 800 °C for 2 h in air. GO dispersion solutions with the concentration of 16.7 mg mL−1 were prepared by ultrasonically dispersing GO powders in distilled water for 6 h.22 The geopolymer had the following proportions: SiO2/Al2O3 = 4.0, K2O/SiO2 = 0.25 and H2O/K2O = 15 (mole ratio).35,362.2. Preparation of reaction products
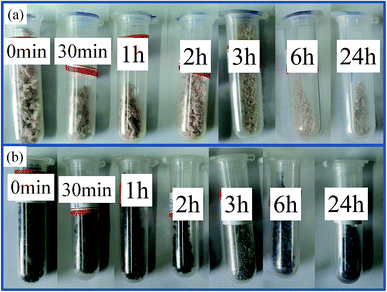
The alkaline mixture was synthesized by mixing silica sol with KOH for 3 days with the help of magnetic stirring. The rGO/geopolymeric alkaline mixture (GO powders/metakaolin 1 wt%) was prepared by dropping the obtained GO dispersion to the alkaline mixture and stirred for 15 min. Thereafter, the rGO/geopolymer slurry was prepared by adding the metakaolin powders into the alkaline mixture and mixing for 45 min using a high-shear mixer and ultrasonication in an ice bath. The continuous stirring under ice bath ensured complete distribution and fully dissolution of both metakaolin particles and rGO powders resulting in a low viscosity, homogeneous slurry. Then, the slurry was casted in plastic containers and cured at 60 °C for different times (0–24 h) to get the reaction products.In order to remove water, some preliminary preparations were carried out. Slurry samples (if they had not set, 0–2 h) were directly added into a 50/50 (vol) ethanol/acetone mixture and stirred hard for round 5 min (around 1 g samples and 100 mL ethanol/acetone mixture), then continued adding new solvent. This procedure was repeated for three times, until the reaction products became particles. Samples (if they had set, 3–24 h) were first divided into micron-sized particles using a mortar and pestle, and then mixed with 50/50 (vol) ethanol/acetone mixture for round 5 min to remove water. Then, taking out and drying the particle samples at room temperature, as can be seen in Fig. 1. Finally, use a mortar and pestle to grind the samples for characterization.
2.3. Characterization
The micrographs of the geopolymer (KGP) and rGO/geopolymer (rGO/KGP) reaction products were observed using scanning electron microscope (SEM, FEI, Helios NanoLab 600i). Fourier-transform infrared (FT-IR) spectra of raw kaolin, metakaolin and reaction products during geopolymerization were obtained on a Nicolet Nexus 6700 Fourier transform infrared spectrometer. The phase compositions of the reaction products were examined by X-ray diffraction (XRD, Rigaku, RINT-2000) with Cu-Kα radiation. The 27Al and 29Si solid state NMR were conducted using Bruker Avance III400 spectrometer with a magnetic field strength of 9.4 T and 4 mm rotor. The relaxation delay times were 2 and 1 s for 27Al and 29Si NMR spectra, respectively. The spectrometers were 5 kHz for Al and 12 kHz for Si. The chemical shifts of 27Al and 29Si nuclei were referenced to AlNO3 and tetramethylsilane, respectively.3. Results and discussions
Micrographs of particles for reaction products of both the KGP and rGO/KGP samples formed at various reaction times are shown in Fig. 2. After stirring for 45 min, the reaction products exhibit a porous and spongy morphology, with many irregular surface voids (Fig. 2(a) and (h)). The rGO bonded well with the reaction products of KGP matrix. The voids decreased significantly as time increased. At 3 h, the reaction products became dense, without obvious voids (Fig. 2(e) and (l)). It could be found that the rGO was wrapped around by the particles of KGP matrix. After 24 h, both the KGP and rGO/KGP offers a relatively homogeneous and dense microstructure (Fig. 2(g) and (n)).Fig. 3 shows XRDs of the KGP and rGO/KGP products formed at various times. There was no obvious difference between the two type samples. The patterns samples displayed typical geopolymer broad amorphous humps around 17–32° 2θ. The amorphous content decreased with the reaction time. The minor α-quartz remained.
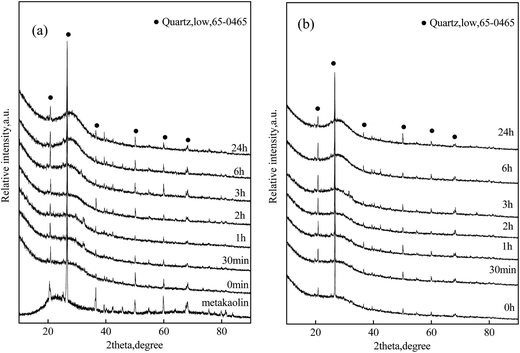 | ||
| Fig. 3 XRD patterns of the reaction products of (a) KGP and (b) rGO/KGP formed at various reaction times in geopolymerization process. | ||
Fig. 4 and 5 show the FT-IR spectra of kaolin, metakaolin and reaction products of KGP and rGO/KGP formed at various reaction times. As for the kaolin samples in Fig. 4, the bands at 3694, 3670, 3654 and 3620 cm−1 are associated with νO–H in kaolinite structure.37,38 The bonds at 1115, 1099, 1032 and 1008 cm−1 corresponded to νSi–O from SiO4. Sharp bands located at 937 and 913 cm−1 were attributed to νAl–OH vibrations.38 The IR peaks at 795 and 755 cm−1 are assigned to νSi–O–Al. The bands located at 696, 539 and 470 cm−1 was attributed to the Si–O, Si–O–Al and Si–O vibrations from AlO6, respectively.39 After treating at 800 °C for 2 h, the transformation to metakaolin removes most of these bands, leaving three obvious peaks located at 1090, 803 and 463 cm−1, which attributed to the νSi–O from SiO4, νAl–O from AlO4 and Si–O vibrations, respectively. It can be concluded that the Si–O and Al–O bonds hydrolyze during geopolymerization.32
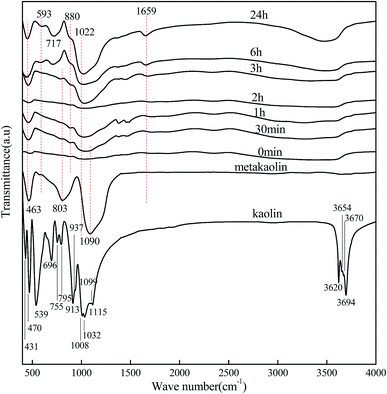 | ||
| Fig. 4 FT-IR spectras of kaolin, metakaolin and reaction products of KGP formed at various reaction times in geopolymerization process. | ||
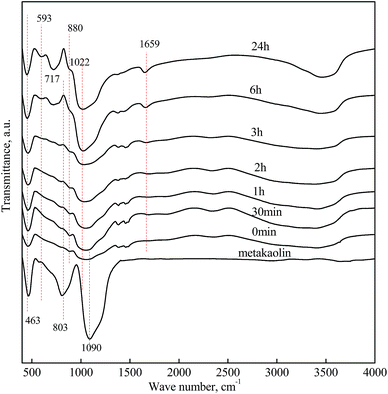 | ||
| Fig. 5 FT-IR spectras of metakaolin and reaction products of rGO/KGP formed at various reaction times in geopolymerization process. | ||
The FT-IR spectras during geopolymerization over 24 h are also shown in Fig. 4 and 5. There was no obvious difference between the FT-IR spectra of the KGP with and without rGO. The bands positioned at 3500 and 1659 cm−1 were attributed to νO–H, indicating that adsorbed atmospheric water existed in the molded geopolymer sample.40 The intensity of the band located at 463 cm−1 increased with reaction time, suggesting formation of a greater number of Si–O–Si units. At 6 h, the intensity of the bands at 593 and 717 cm−1 increased, related to increases in Si–O–Al and the four-coordinated AlO4 structure units in the reaction product. These represent the structural changes and rearrangement occurring during geopolymerization of Al units. Different from the FT-IR spectrum of the metakaolin, a weak shoulder located at 880 cm−1 appeared and increased with time, which was corresponding to the carbonate from atmospheric air.
The intense band related to νSi–O shifts from 1090 to 1022 cm−1 after 24 h, caused by the presence of Al–O bonds owing to silicon substitution by aluminum in the second coordination sphere and the generation of the Si(Al)–O units.41 The Al–O band at 803 cm−1 decreases with the reaction time and disappears after 6 h, confirming the dissolution of metakaolin and the disruption of the Al environment during the geopolymerization process.
It is difficult to distinguish the characteristic rGO peaks from the FT-IR spectra of the rGO/KGP products due to their small content. Further influence of rGO on the reaction products could be detected by the 27Al and 29Si solid state NMR.
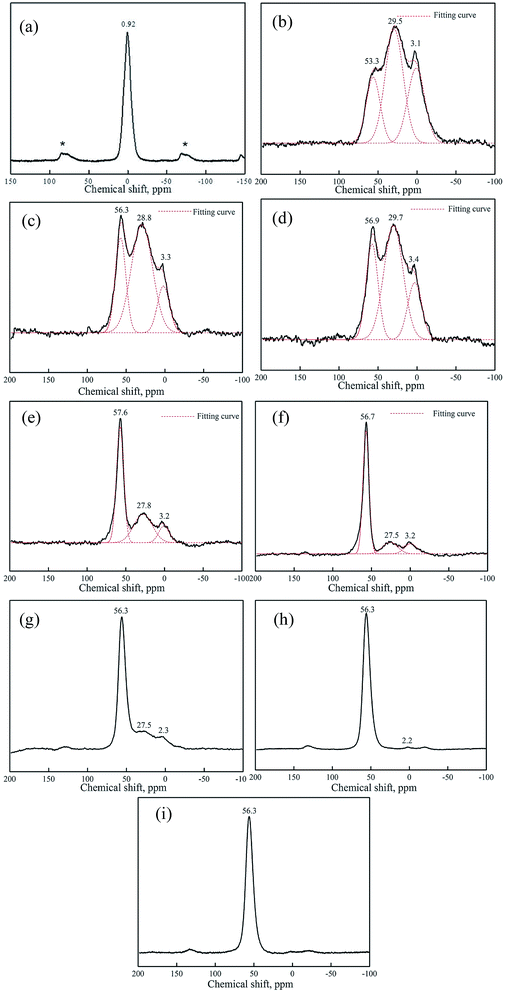
Fig. 6, 7 and Table 1 show the 27Al NMR spectra and the Gaussian fit of raw kaolin, metakaolin and reaction products of KGP and rGO/KGP formed at various times. As shown in Fig. 6(a), the 27Al chemical shift of raw kaolin is 0.92 ppm, corresponding to six-coordinated aluminum. The three peaks at 53.3, 29.5 and 3.1 ppm in the 27Al NMR spectrum of metakaolin Fig. 6(b), can be attributed to 4-, 5- and 6-coordinate Al. The 5-coordination accounts for 48% of total Al atoms, the major species in metakaolin.
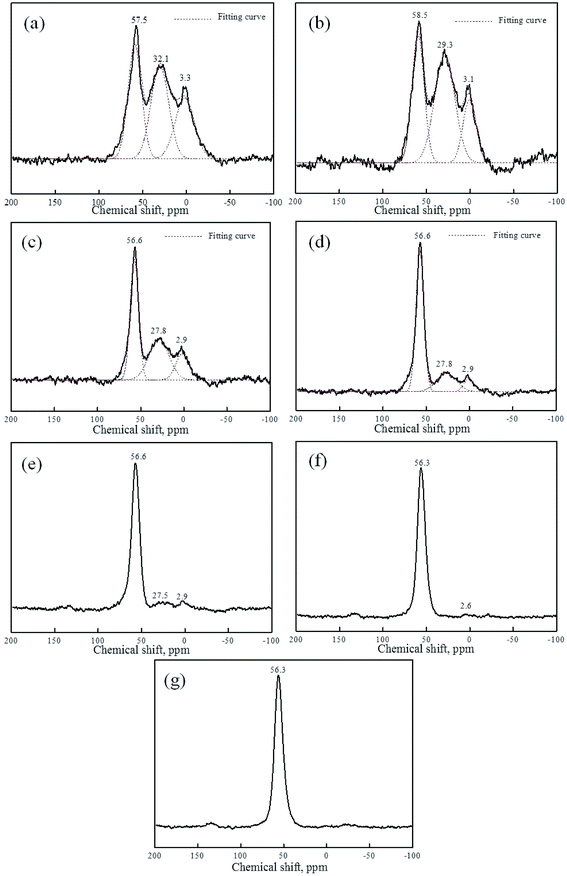 | ||
| Fig. 7 27Al NMR spectras of reaction product of rGO/KGP formed at various reaction times in geopolymerization process: (a)–(g) corresponding 0 min, 30 min, 1 h, 2 h, 3 h, 6 h and 24 h, respectively. | ||
| Sample | Coordination of Al atom | Chemical shift (ppm) | Relative area | Percentage (%) |
|---|---|---|---|---|
| MK | 4 | 53.3 | 2.37 | 21.6 |
| 5 | 29.5 | 5.28 | 48.3 | |
| 6 | 3.1 | 3.29 | 30.1 |
| KGP | rGO/KGP | KGP | rGO/KGP | KGP | rGO/KGP | KGP | rGO/KGP | |
|---|---|---|---|---|---|---|---|---|
| 0 min | 4 | 4 | 56.3 | 57.5 | 3.06 | 3.16 | 25.8 | 35.2 |
| 5 | 5 | 28.8 | 32.1 | 7.09 | 3.41 | 59.6 | 37.8 | |
| 6 | 6 | 3.3 | 3.3 | 1.73 | 2.43 | 14.6 | 27.0 | |
| 30 min | 4 | 4 | 56.9 | 58.5 | 5.86 | 2.25 | 27.6 | 34.3 |
| 5 | 5 | 29.7 | 29.3 | 11.28 | 3.13 | 53.1 | 47.6 | |
| 6 | 6 | 3.4 | 3.1 | 4.10 | 1.19 | 19.3 | 18.1 | |
| 1 h | 4 | 4 | 57.6 | 56.6 | 2.41 | 2.33 | 54.3 | 46.8 |
| 5 | 5 | 27.8 | 27.8 | 1.52 | 1.87 | 34.2 | 37.5 | |
| 6 | 6 | 3.2 | 2.9 | 0.51 | 0.78 | 11.5 | 15.7 | |
| 2 h | 4 | 4 | 56.7 | 56.6 | 3.61 | 4.34 | 71.7 | 69.8 |
| 5 | 5 | 27.5 | 27.8 | 0.82 | 1.39 | 16.5 | 22.3 | |
| 6 | 6 | 3.2 | 2.9 | 0.60 | 0.49 | 11.8 | 7.9 | |
| 3 h | 4 | 4 | 56.3 | 56.6 | — | — | — | — |
| 5 | 5 | 27.5 | 27.5 | — | — | — | — | |
| 6 | 6 | ∼2.3 | 2.9 | — | — | — | — | |
| 6 h | 4 | 4 | 56.3 | 56.3 | 10 | 10 | 100 | 100 |
| 6 | 6 | ∼2.2 | 2.6 | — | — | — | — | |
| 24 h | 4 | 4 | 56.3 | 56.3 | 10 | 10 | 100 | 100 |
The broad peaks arise due to highly distorted geometry at aluminum sites.32 After metakaolin reacts with alkaline solution for 0–30 min, the Al coordination states of both the KGP (Fig. 6(c) and (d)) and the rGO/KGP (Fig. 7(a) and (b)) show no obvious change. The three peaks in the 27Al NMR spectrum were attributed to 4-, 5- and 6-coordinate Al. The 4-coordinate Al in the reaction products of rGO/KGP was relatively more than the KGP matrix (Table 1), which may be attributed to the acceleration of rGO on the initial products early in the geopolymerization process.
The 5- and 6-coordinated Al atoms in the KGP samples appear to transform to 4 coordination gradually during geopolymerization over 1–3 h. The relative content of 4-coordinated Al atoms increased to 71.7% within 2 h (Fig. 6(f)). However, as for the rGO/KGP samples, the relative content of 4-, 5- and 6-coordinate Al atoms was 46.8%, 37.5% and 15.7% within 1 h, respectively (Table 1). The species of the Al atoms were not changed, whereas, the 4-coordinated Al atoms increased to 69.8% within 2 h (Fig. 7(d)). When the reaction time was longer than 3 h, the 4-coordinated Al atoms (56.6 ppm) became the mainly species (Fig. 7(e)). However, at the same time, the five-coordinated Al in the KGP and rGO/KGP products was disappeared after 6 h (Fig. 6(h) and 7(f)).
After 24 h, the peaks of both the KGP and rGO/KGP products at 56.3 ppm became sharper, indicating the coordination of Al–O in final geopolymer converts to four coordinate (Fig. 6(i) and 7(g)). The shift to 4-coordinated Al (from 53.3 to 56.3 ppm) likely arises because of extensive formation of Si–O–Al links.29,32 Compared with the KGP matrix products, the addition of rGO accelerated the conversion of 4-coordinated Al in the rGO/KGP products at the early stage (0–30 min) during the geopolymerization process. While, the effects of rGO was not obvious at the later stage (1–24 h). This was due to the KGP particles likely priority formed, attached and grown on the surface of the rGO sheets. However, the geopolymer matrix was solidificated, surface of the rGO was all parceled with the geopolymerization products. Thus, the geopolymerization promotion was not obvious.
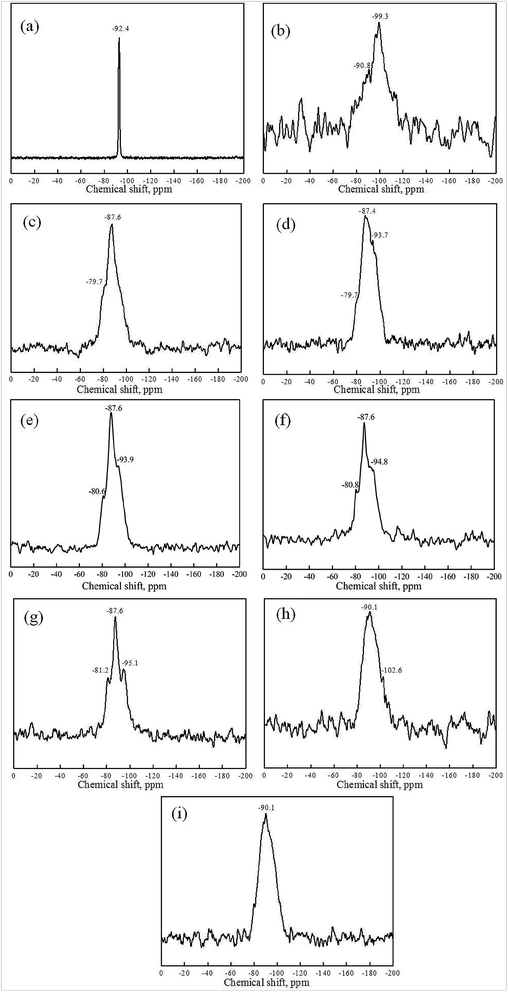
29Si NMR spectra of kaolin, metakaolin and reaction products of both the KGP and rGO/KGP formed at various reaction times are given in Fig. 8, 9 and Table 2. The 29Si MAS NMR spectrum of raw kaolin consists of a single resonance centered at −92.4 ppm assigned to Si–O–Si linkages only (Fig. 8(a)).42 According to previous studies of aluminosilicate materials,29,30,32 the broad 29Si NMR spectra peak could be divided into five possible silicon Q4(mAl) species. Two peaks at −99.3 and −90.8 ppm correspond to tetra-coordinated Si atom, (Q4(1Al) and Q4(3Al)). Q4(1Al) is the major species in the metakaolin (Fig. 8(b)).
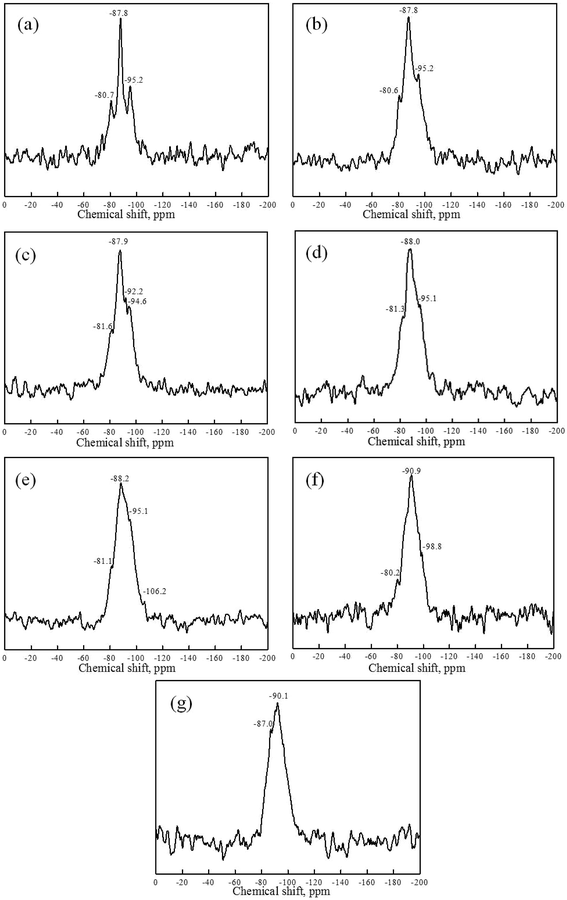 | ||
| Fig. 9 29Si NMR spectras of reaction product of rGO/KGP formed at various reaction times in geopolymerization process: (a)–(g) corresponding 0 min, 30 min, 1 h, 2 h, 3 h, 6 h and 24 h, respectively. | ||
| Sample | Chemical shift (ppm) | Coordination of Si atom |
|---|---|---|
| MK | −90.8 | Q4(3Al) |
| −99.3 | Q4(1Al) |
| KGP | rGO/KGP | KGP | rGO/KGP | |
|---|---|---|---|---|
| 0 min | −79.7 | −80.7 | Q4(4Al) | Q4(4Al) |
| −87.6 | −87.8 | Q4(3Al) | Q4(3Al) | |
| — | −95.2 | — | Q4(2Al) | |
| 30 min | −79.7 | −80.6 | Q4(4Al) | Q4(4Al) |
| −87.4 | −87.8 | Q4(3Al) | Q4(3Al) | |
| −93.7 | −95.2 | Q4(2Al) | Q4(2Al) | |
| 1 h | −80.6 | −81.6 | Q4(4Al) | Q4(4Al) |
| −87.6 | −87.9 | Q4(3Al) | Q4(3Al) | |
| −93.9 | −92.2 | Q4(2Al) | Q4(2Al) | |
| — | −94.6 | — | Q4(2Al) | |
| 2 h | −80.8 | −81.3 | Q4(4Al) | Q4(4Al) |
| −87.6 | −88.0 | Q4(3Al) | Q4(3Al) | |
| −94.8 | −95.1 | Q4(2Al) | Q4(2Al) | |
| 3 h | −81.2 | −81.1 | Q4(4Al) | Q4(4Al) |
| −87.6 | −88.2 | Q4(3Al) | Q4(3Al) | |
| −95.1 | −95.1 | Q4(2Al) | Q4(2Al) | |
| — | −106.2 | — | Q4(1Al) | |
| 6 h | — | −80.2 | — | Q4(4Al) |
| −90.1 | −90.9 | Q4(3Al) | Q4(3Al) | |
| −102.6 | −98.8 | Q4(1Al) | Q4(1Al) | |
| 24 h | — | −87.0 | — | Q4(3Al) |
| −90.1 | −90.1 | Q4(3Al) | Q4(3Al) |
On initiation of geopolymerization of KGP (Fig. 8(c)), the 29Si NMR spectra shifts and two 29Si resonances at −79.9 and −87.6 ppm appear, assigned to Q4(4Al) and Q4(3Al) structure units. Three peaks at −80.7, −87.8 and −95.2 ppm are seen for the rGO/KGP products, which were assigned to Q4(4Al), Q4(3Al) and Q4(2Al), respectively (Fig. 9(a)). After 30 min, three peaks at −79.7, −87.4 and −93.7 ppm (or −80.6, −87.8 and −95.2 ppm) were seen indicating the coordination of Q4(4Al), Q4(3Al) and a new Q4(2Al) species in the KGP (Fig. 8(d)) (or rGO/KGP (Fig. 9(b)). The 29Si chemical shifts of the KGP products showed no obvious change within 1–2 h, while the relative intensity of −80.6 ppm increased regularly (Fig. 8(e) and (f)). The peaks shift to lower position coincident with increases in Si–O–Al species forming. As the reaction progress, Q4(1Al) appear at −106.2 ppm in the rGO/KGP samples when the reaction came to 3 h (Fig. 9(e)). At 6 h in the rGO/KGP products (Fig. 9(f)), 29Si resonances at −80.2, −90.9 and −98.8 ppm, assigned to Q4(4Al), Q4(3Al) and Q4(1Al) species appear, respectively.
However, after 24 h, only one broad 29Si NMR peak of KGP at −90.1 ppm is seen (Fig. 8(i)). The peaks at −87.0 and −90.1 ppm of rGO/KGP are observed (Fig. 9(g)), indicating that Si is present mainly as Q4(3Al) structural units. Compared with the pure KGP, the addition of rGO accelerated the conversion of Si structure unit from Q4(1Al) to Q4(4Al), Q4(3Al), Q4(2Al) and Q4(1Al) species. Thus, the addition of rGO affects the Si structure during the geopolymerization and has an positive influence on the generation of Q4(3Al) species.
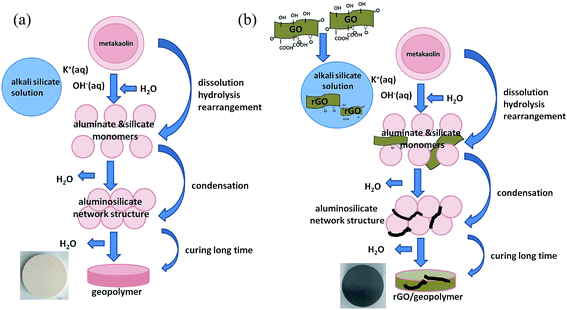
To sum up, the effects of GO on the geopolymerization of the rGO/KGP could be illustrated in Fig. 10. For the KGP (Fig. 10(a)), the geopolymerization mechanism can be rationally expressed according to the experimental analysis as follows. First, metakaolin particles dissolve from the surface after mixing with alkaline silicate solutions; the Si–O bond and Al–O bond hydrolyze; Si and Al monomers diffuse; polycondense and rearrange; five and six coordinate Al–O sites convert to four coordination, condensing Si species with Al species mainly in the form of Q4(3Al) and Al in four coordinate.
GO can be in situ reduced to rGO in alkaline silicate solutions and have positive effects on the geopolymerization during the reaction process.22 As described in Fig. 10(b), the rGO accelerates the conversion of Al–O sites into four coordinates and Si atoms in the form of Q4(3Al), but has not changed the final network structure of the rGO/KGP. The reaction products bond well with the rGO sheets and show denser microstructure and lower amorphous degree with the increased in reaction time. Based on the above analyses, the addition of GO is proper in preparing rGO/KGP composites. Meanwhile, the presence of rGO contributed to the enhancement of mechanical performance of geopolymer. As reported in our previous studies,23,24 compared with pure geopolymer, improvements in mechanical properties were achieved through rGO reinforcement of 0.05–1 wt% at room temperature. With 1 wt% GO addition, the fracture toughness and flexural strength of rGO/geopolymer composites increased by approximately 30% and 7%, respectively, attributing to the proper interface bonding, crack deflection and propagation and rGO pull-out.
4. Conclusions
In the present study, the method to stop geopolymerization reaction was provided and the effects of graphene oxide on the geopolymerization mechanism of geopolymer based on natural metakaolin were investigated systematically.(1) The reaction products of KGP and rGO/KGP in the geopolymerization process (0–24 h) can be isolated by introducing ethanol/acetone mixtures. The voids in the reaction products decrease significantly with the geopolymerization time. The products display typical broad amorphous humps around 17–32° 2θ and the amorphous degree decrease with the reaction time.
(2) During geopolymerization, the metakaolin dissolved in the alkaline silicate solutions, and Si–O bond and Al–O bond hydrolyzed, five and six coordinates of Al–O sites converted into four coordinates, condensing the network structure in which Si mainly in the form of Q4(3Al) and Al in four coordinate.
(3) The addition of GO accelerated the conversion of Al–O sites into four coordinates and Si atoms in the form of Q4(3Al). The reaction products of geopolymer matrix bonded well with the rGO sheets and showed denser microstructure and lower amorphous degree with the increase in reaction time.
Acknowledgements
This work was supported by the National Natural Science Foundation of China (NSFC No. 51502052, 51402068, 51372048, 51321061, 51225203) and Fundamental Research Funds for the Central Universities (Grant No. HIT. NSRIF. 20165). We would like to thank Dr Richard M. Laine (University of Michigan, USA) for the help with science and language.References
- J. Davidovits, Geopolymers and geopolymeric materials, J. Therm. Anal., 1989, 35, 429–441 CrossRef CAS.
- J. Davidovits, 30 Years of Successes and Failures in Geopolymer Applications. Market: Trends and Potential Breakthroughs, Geopolymer Conference, 2002, vol. 10, pp. 1–16 Search PubMed.
- W. K. Part, M. Ramli and C. B. Cheah, An overview on the influence of various factors on the properties of geopolymer concrete derived from industrial by-products, Construct. Build. Mater., 2015, 77, 370–395 CrossRef.
- M. B. M. Salahuddin, M. Norkhairunnisa and F. Mustapha, A review on thermophysical evaluation of alkali-activated geopolymers, Ceram. Int., 2015, 41, 4273–4281 CrossRef.
- J. L. Provis, Geopolymers and other alkali activated materials: why, how, and what?, Mater. Struct., 2014, 47, 11–25 CrossRef CAS.
- P. Duxson, J. L. Provis and G. C. Lukey, et al., Understanding the relationship between geopolymer composition, microstructure and mechanical properties, Colloids Surf., A, 2005, 269, 47–58 CrossRef CAS.
- J. Tailby and K. J. D. MacKenzie, Structure and mechanical properties of aluminosilicate geopolymer composites with Portland cement and its constituent minerals, Cem. Concr. Res., 2010, 40, 787–794 CrossRef CAS.
- P. He, D. Jia and T. Lin, et al., Effects of high-temperature heat treatment on the mechanical properties of unidirectional carbon fiber reinforced geopolymer composites, Ceram. Int., 2010, 36, 1447–1453 CrossRef CAS.
- T. S. Lin, D. C. Jia and P. G. He, et al., Thermo-mechanical and Microstructural Characterization of Geopolymers with α-Al2O3 Particle Filler, Int. J. Thermophys., 2009, 30, 1568–1577 CrossRef CAS.
- T. Kovářík, L. Kullová and D. Rieger, Production of refractory chamotte particle-reinforced geopolymer composite, IOP Conf. Ser.: Mater. Sci. Eng., 2016, 123, 012041 CrossRef.
- T. Alomayri, F. U. A. Shaikh and I. M. Low, Synthesis and Mechanical Properties of Cotton Fabric Reinforced Geopolymer Composites, Composites, Part B, 2014, 60, 36–42 CrossRef CAS.
- T. S. Lin, D. C. Jia and P. G. He, et al., Effects of fiber length on mechanical properties and fracture behavior of short carbon fiber reinforced geopolymer matrix composites, Mater. Sci. Eng., A, 2008, 497, 181–185 CrossRef.
- T. S. Lin, D. C. Jia and M. R. Wang, et al., Effects of fibre content on mechanical properties and fracture behaviour of short carbon fibre reinforced geopolymer matrix composites, Bull. Mater. Sci., 2009, 32, 77–81 CrossRef CAS.
- P. Timakul, W. Rattanaprasit and P. Aungkavattana, Improving compressive strength of fly ash-based geopolymer composites by basalt fibers addition, Ceram. Int., 2016, 42, 6288–6295 CrossRef CAS.
- A. K. Geim and K. s. Novoselov, The rise of graphene, Nat. Mater., 2007, 6, 183–191 CrossRef CAS PubMed.
- A. H. C. Neto, F. Guinea and N. M. R. Peres, et al., The electronic properties of graphene, Rev. Mod. Phys., 2009, 81, 109 CrossRef.
- W. Choi, I. Lahiri and R. Seelaboyina, et al., Synthesis of graphene and its applications: a review, Crit. Rev. Solid State Mater. Sci., 2010, 35, 52–71 CrossRef CAS.
- S. Stankovich, D. A. Dikin and G. H. B. Dommett, et al., Graphene-based composite materials, Nature, 2006, 442, 282–286 CrossRef CAS PubMed.
- J. Du and H. M. Cheng, The fabrication, properties, and uses of graphene/polymer composites, Macromol. Chem. Phys., 2012, 213, 1060–1077 CrossRef CAS.
- H. Porwal, S. Grasso and M. J. Reece, Review of graphene–ceramic matrix composites, Adv. Appl. Ceram., 2013, 112, 443–454 CrossRef CAS.
- M. R. Wang, D. C. Jia and P. G. He, et al., Microstructural and mechanical characterization of fly ash cenosphere/metakaolin-based geopolymeric composites, Ceram. Int., 2011, 37, 1661–1666 CrossRef CAS.
- S. Yan, P. He and D. Jia, et al., In situ fabrication and characterization of graphene/geopolymer composites, Ceram. Int., 2015, 41, 11242–11250 CrossRef CAS.
- S. Yan, P. He and D. Jia, et al., Effect of reduced graphene oxide content on the microstructure and mechanical properties of graphene–geopolymer nanocomposites, Ceram. Int., 2016, 42, 752–758 CrossRef CAS.
- S. Yan, P. He and D. Jia, et al., In Situ Processing of Graphene/Leucite Nanocomposite Through Graphene Oxide/Geopolymer, J. Am. Ceram. Soc., 2016, 99, 1164–1173 CrossRef CAS.
- S. Yan, P. He and D. Jia, et al., In situ preparation of fully stabilized graphene/cubic-leucite composite through graphene oxide/geopolymer, Mater. Des., 2016, 101, 301–308 CrossRef CAS.
- H. Xu and J. S. J. Van Deventer, The geopolymerisation of alumino-silicate minerals, Int. J. Miner. Process., 2000, 59, 247–266 CrossRef CAS.
- H. Xu and J. S. J. Van Deventer, Ab initio calculations on the five-membered alumino-silicate framework rings model: implications for dissolution in alkaline solutions, Comput. Chem., 2000, 24, 391–404 CrossRef CAS PubMed.
- C. E. White, J. L. Provis and T. Proffen, et al., Molecular mechanisms responsible for the structural changes occurring during geopolymerization: multiscale simulation, AIChE J., 2012, 58, 2241–2253 CrossRef CAS.
- L. Weng and K. Sagoe-Crentsil, Dissolution processes, hydrolysis and condensation reactions during geopolymer synthesis: Part I-Low Si/Al ratio systems, J. Mater. Sci., 2007, 42, 2997–3006 CrossRef CAS.
- K. Sagoe-Crentsil and L. Weng, Dissolution processes, hydrolysis and condensation reactions during geopolymer synthesis: Part II. High Si/Al ratio systems, J. Mater. Sci., 2007, 42, 3007–3014 CrossRef CAS.
- X. Chen, A. Meawad and L. J. Struble, Method to Stop Geopolymer Reaction, J. Am. Ceram. Soc., 2014, 97, 3270–3275 CrossRef CAS.
- P. Duxson, A. Fernández-Jiménez and J. L. Provis, et al., Geopolymer technology: the current state of the art, J. Mater. Sci., 2007, 42, 2917–2933 CrossRef CAS.
- E. Knapen, O. Cizer and K. Van Balen, et al., Effect of free water removal from early-age hydrated cement pastes on thermal analysis, Construct. Build. Mater., 2009, 23, 3431–3438 CrossRef.
- L. D. Mitchell and J. C. Margeson, The effects of solvents on C–S–H as determined by thermal analysis, J. Therm. Anal. Calorim., 2006, 86, 591–594 CrossRef CAS.
- P. He, D. Jia and M. Wang, et al., Thermal evolution and crystallization kinetics of potassium-based geopolymer, Ceram. Int., 2011, 37, 59–63 CrossRef CAS.
- T. Lin, D. Jia and P. He, et al., Thermal-mechanical properties of short carbon fiber reinforced geopolymer matrix composites subjected to thermal load, J. Cent. South Univ. Technol., 2009, 16, 881–886 CrossRef CAS.
- C. T. Johnston, J. E. Kogel and D. L. Bish, et al., Low-temperature FTIR study of kaolin-group minerals, Clays Clay Miner., 2008, 56, 470–485 CrossRef CAS.
- R. L. Frost, The structure of the kaolinite minerals; a FT-Raman study, Clay Miner., 1997, 32, 65–77 CAS.
- D. Akolekar, A. Chaffee and R. F. Howe, The transformation of kaolin to low-silica X zeolite, Zeolites, 1997, 19, 359–365 CrossRef CAS.
- H. Wang, H. Li and F. Yan, Synthesis and mechanical properties of metakaolinite-based geopolymer, Colloids Surf., A, 2005, 268, 1–6 CrossRef CAS.
- G. M. Nasab, F. Golestanifard and K. J. D. MacKenzie, The Effect of the SiO2/Na2O Ratio in the Structural Modification of Metakaolin-Based Geopolymers Studied by XRD, FTIR and MAS-NMR, Journal of Ceramic Science and Technology, 2014, 5, 185–192 Search PubMed.
- H. Yang, M. Liu and J. Ouyang, Novel synthesis and characterization of nanosized γ-Al2O3 from kaolin, Appl. Clay Sci., 2010, 47, 438–443 CrossRef CAS.
Footnote |
| † Co-first authors, these authors contributed equally to this study and share first authorship. |
| This journal is © The Royal Society of Chemistry 2017 |

