
 Open Access Article
 This Open Access Article is licensed under a Creative Commons Attribution-Non Commercial 3.0 Unported Licence
Bio-ethanol production by Zymomonas mobilis using pretreated dairy manure as a carbon and nitrogen source
Yang Youa,
Song Liua,
Bo Wua,
Yan-Wei Wanga,
Qi-Li Zhua,
Han Qina,
Fu-Rong Tana,
Zhi-Yong Ruanb,
Ke-Dong Mac,
Li-Chun Daia,
Min Zhanga,
Guo-Quan Hua and
Ming-Xiong He *a
*a
aBiomass Energy Technology Research Centre, Key Laboratory of Development and Application of Rural Renewable Energy (Ministry of Agriculture), Biogas Institute of Ministry of Agriculture, Section 4-13, Renmin Nanlu, Chengdu 610041, P. R. China. E-mail: hemingxiong@caas.cn; Fax: +86-28-85242281
bKey Laboratory of Microbial Resources (Ministry of Agriculture, China), Institute of Agricultural Resources and Regional Planning, CAAS, Beijing 100081, P. R. China
cCollege of Environmental and Chemical Engineering, Dalian University, Dalian 116622, P. R. China
First published on 13th January 2017
Abstract
Dairy manure contains high levels of cellulose, hemicellulose and a nitrogen source. These properties make dairy manure a potential biomass source for ethanol production. In this study, a dilute NaOH pretreatment and enzymatic hydrolysis were carried out for the degradation of lignocellulose from dairy manure. The response surface method and Box–Behnken design were first applied in order to optimize the NaOH pretreatment. Under the optimization conditions, 21.14 g L−1 of glucose and 9.48 g L−1 of xylose were obtained from continuous enzymolysis. The maximum ethanol concentration achieved reached 10.55 g L−1 when using ethanologenic Zymomonas mobilis without an additional nitrogen source. This produced a 71.91% ethanol yield from manure hydrolysate medium. These results demonstrate the economic benefits of using nitrogen from a dairy manure source for balancing the C/N ratio, without the need for an additional nitrogen source. The results from this study could extend beyond cellulosic ethanol for the production of other chemicals.
Introduction
With the emerging environmental issues surrounding the use of fossil fuels in addition to the fossil energy crisis that has developed, a greater interest in the use of alternative renewable energies, such as bio-ethanol, has emerged. Interestingly, dairy manure has been demonstrated to contain high levels of carbon and nitrogen nutrients, which has enabled their use as an effective fertilizer or feedstock for anaerobic digester (AD) to generate biogas. Dairy manure is a cellulose-rich biomass that contains high levels of cellulose and hemicellulose. In addition, dairy manure has been shown to have a suitable C/N ratio that enables easy digestion under anaerobic conditions.1 In the past few decades, the production of biogas from manure has risen as an economically attractive method for renewable energy production, and has gained interest worldwide. However, during the process of AD, the majority of the nitrogen, ammonia, phosphate, and potassium from the manure were found to be present in the biogas residues or biogas slurry. In fact, up to 50% of the organic N was found to be converted to ammonium (NH4–N) during the process of AD, while the phosphate content in the digestate was unaffected.2 While these biogas residues or the biogas slurry may function as an effective fertilizer for the growth of crops, the concentration of nutrients in the digestate is low, making the cost of transportation relatively high in comparison to conventional fertiliser. Additional significant costs include investments in the storage capacity, which is required due to environmental regulations in numerous countries, including Denmark, Germany, and France. In these countries, not only is the nutrient input per-hectare restricted, but the period of application is also limited to the growing season.2Recent studies have been carried out in an attempt to identify other value-added chemicals that are produced from manure. For example, Yao et al. used dairy manure as a nitrogen source, combined with glucose as carbon source. With this mixture, they were able to produce 29.1% of L-(+)-lactic acid via fermentation by Rhizopus oryzae.3 Using pretreated dairy manure as a carbon and nitrogen source, Sun et al. were able to obtain an L-(+)-lactic acid yield of 40.09% via fermentation by Rhizopus oryzae.4 In addition, a three step fermentation process that effectively utilized the nitrogen and the carbohydrate in manure to obtain a fumaric acid yield of 31% was developed in 2008.5 Wang et al. also reported a methodology where digested dairy manure was used as a nutrient supplement for the cultivation of the oil-rich green microalgae, Chlorella sp.6 Dairy manure has also been shown to be used for the production of cellulase by Trichoderma reesei or a mixed culture containing both T. Reesei and Aspergillus phoenicis.7,8
The production of value-added chemicals from dairy manure requires three basic processes. These include pretreatment, enzymatic hydrolysis, and fermentation. Prior to enzymatic hydrolysis, several pretreatment methods have been investigated to identify a method to alter the crystalline structure of the lignocellulose materials for the production of bioethanol and biogas. The alkaline pretreatment of lignocelluloses with NaOH has been demonstrated to result in the removal or modification of the lignin and increase the biomass porosity. This pretreatment method was found to result in a significant reduction of the crystallinity of cellulose, which could be responsible for improving the activity of enzymatic hydrolyses.9 Chen et al. demonstrated that NaOH loading was the most prevalent variable in enzymatic digestibility.10 The statistical optimization by Box–Behnken design of wheat straw pretreated with alkali showed that a 2.5% NaOH concentration was very effective in both improving the cellulosic contents and also efficiently disrupting the structure.11 NaOH pretreatment has been considered to be an efficient method for the removal of lignin and the enhancement of the cellulose content. These aspects could be beneficial for the release of greater amounts of fermentable sugar for the production of bio-based materials.
The production of ethanol from a continuously stirred tank reactor (CSTR) anaerobic digester was also investigated. These studies showed CSTR AD fiber to be a suitable biorefining feedstock in comparison to switch grass or corn stover.12 Although cellulosic ethanol production has gained popularity recently, with the introduction of several commercial facilities in the last few years, the price of cellulosic ethanol remains an obstacle which limits its global large-scale production. To address this issue, a great deal of research has been focused on developing ways to reduce production costs through the development of a low-cost pretreatment method,13,14 increased hydrolysis efficiency, robust fermentative microorganisms, and other methods.15–17 The addition of nutrients required for microbial cell growth has been demonstrated to be crucial for the efficient fermentation of cellulosic ethanol, which could significantly increase the cost of large-scale production.18,19 In order to further reduce the cost of cellulosic ethanol production, studies may focus on ways to reduce the amount of chemical nutrients added throughout the fermentation process. In addition to seeking cheaper nutrient sources as a substitute for expensive yeast extract, employing biomass enriched in nutrients for ethanol fermentation should also be considered as a potential strategy. Because dairy manure contains cellulose, hemicellulose, nitrogen, ammonia, potassium, phosphorus, and other nutrients, it could be considered as a potential feedstock for bioethanol or other value-added products without any extra nitrogen nutrients added.
While dairy manure contains high levels of cellulose, hemicellulose, and nitrogen, little attention has been paid to utilizing dairy manure as both the nitrogen and carbon source for bioethanol production. Few studies exist which focus on ethanol production from manure, i.e., the process of making alcohol through the fermentation of animal manure mixed with active yeast (EP 0085810 A2).20 In addition, few studies have focused on the potential of bio-ethanol production from poultry manure using dilute H2SO4 hydrolyzed.21 In addition, the degradation profiling of manure cellulose and the transforming rule of ammonia nitrogen are also unclear. Because dairy manure is a nutrient enriched material, the potential of its use in bioethanol production is worth considering. This is especially true for the degradation profile of manure cellulose and nitrogen resources utilized during ethanol fermentation.22
Zymomonas mobilis possesses numerous valuable characteristics for its special Entner–Doudoroff (ED) pathway, making it an ideal ethanologenic strain to be used for ethanol production.17,23 Extensive fundamental studies carried out over the past 30 years have focused on Z. mobilis and have demonstrated the promise of this ethanologenic organism for large scale bio-ethanol production.17 Recent studies have also demonstrated that Z. mobilis can use N2 as a nitrogen source via its N2 fixation pathway.22 Therefore, the current work presented here will investigate the feasibility of ethanol production from dairy manure by Z. mobilis. Dilute NaOH pretreatment and enzymatic hydrolysis were performed, followed fermentate by ethanologenic Z. mobilis, in the absence of any additional nitrogen resources. This work will not only enable the development of a deeper understanding of the degradation profile of manure cellulose and nitrogen resources utilized during ethanol fermentation, but will also provide a novel Z. mobilis based technology for ethanol production using pretreated dairy manure as a carbon and nitrogen source, without further addition of any additional nutrients. Importantly, preliminary studies regarding the utilization of ammonia nitrogen will also provide insight into nitrogen utilization in the metabolic pathway of Z. mobilis. The results from these studies could make Z. mobilis a candidate ethanologenic for ethanol production using cheaper nitrogen sources.
Materials and experiments
Material and preparation
Fresh dairy manure was obtained from Zheng long farm in Sichuan province and was stored at 4 °C. The original manure was dried at 105 °C and smashed into tiny particles. These were then passed through a sieved with a 40-mesh screen, blended and packed. The neutral detergent fiber (NDF), acid detergent fiber (ADF), and acid detergent lignin (ADL) of the original manure and pretreated manure were determined by Fibertec 2010 using quartz sand as filter acid.24 The content changes of cellulose, hemicellulose and acid detergent lignin reflected the effects of NaOH pretreatment. Data showing results from the original manure and pretreated manure are shown in Table 1.| Original manure | Pretreated manure | |
|---|---|---|
| a All data are the average of triplicates with standard deviations of the means (n = 3) at α = 0.05. | ||
| Dry matter, % | 20.04 ± 1.36 | 25.08 ± 1.11 |
| NDF, % dry matter | 56.39 ± 0.76 | 65.91 ± 2.15 |
| ADF, % dry matter | 33.53 ± 0.91 | 52.67 ± 2.15 |
| ADL, % dry matter | 8.95 ± 0.66 | 7.89 ± 1.50 |
| Cellulose (=ADF − ADL), % dry matter | 24.57 ± 1.55 | 44.78 ± 1.48 |
| Hemicellulose (=NDF − ADF), %dry matter | 22.87 ± 0.31 | 13.24 ± 1.26 |
| Lignin (=ADL), % dry matter | 8.95 ± 0.66 | 7.89 ± 1.50 |
| N, % dry matter | 2.83 ± 0.33 | 1.82 ± 0.28 |
| C, % dry matter | 48.00 ± 0.76 | 40.07 ± 0.68 |
Bacterial strains and fermentation conditions
Z. mobilis ZMT2![[thin space (1/6-em)]](https://www.rsc.org/images/entities/char_2009.gif) 25 (CGMCC11888, from our lab, stored at China General Microbiological Culture Collection Center) was cultured in Rich media (RM)26 at 30 °C without shaking. Cultures were maintained on glucose agar (20.0 g L−1 glucose, 10.0 g L−1 yeast extract and 15.0 g L−1 agar). Organisms were subcultured to fresh inoculum media for 24 h at 30 °C prior to being inoculated into the fermentation medium. Inoculum medium (g L−1) was comprised of 10.0 g yeast extract, 1.0 g MgCl2, 1.0 g (NH4)2SO4, 1.0 g KH2PO4, and 20.0 g glucose.
25 (CGMCC11888, from our lab, stored at China General Microbiological Culture Collection Center) was cultured in Rich media (RM)26 at 30 °C without shaking. Cultures were maintained on glucose agar (20.0 g L−1 glucose, 10.0 g L−1 yeast extract and 15.0 g L−1 agar). Organisms were subcultured to fresh inoculum media for 24 h at 30 °C prior to being inoculated into the fermentation medium. Inoculum medium (g L−1) was comprised of 10.0 g yeast extract, 1.0 g MgCl2, 1.0 g (NH4)2SO4, 1.0 g KH2PO4, and 20.0 g glucose.
Dilute NaOH pretreatment
:10 solid–liquid ratio. Following pretreatment, the solid–liquid slurry was transferred into a 50 mL centrifuge tube and was centrifuged at 4500 rpm min−1 for 3 minutes to separate the liquid from solid. The contents of the supernatant reducing sugar was determined using the 3,5-dinitrosalicylic acid colorimetry method (DNS).27 Glucan and xylan contents were calculated based on glucose and xylose concentrations, using anhydro corrections of 0.9.28 The reducing sugar yield was calculated as follows:
Response surface method design for pretreatment optimization
From the single factor experiment results, the NaOH concentration, reaction time and temperature were found to have different degrees of effects on the reducing sugar yield. Under the fixed pretreatment system, high substrate concentration was found to lead to a deficiently mixed solid–liquid due to the hygroscopicity of the dried matter, and the substrate concentration was not taken as a single factor experiment. Three appreciable impact points were selected from the results of each single factor experiment as a response to surface optimization. A three-level-four-factor response surface methodology (RSM) based on the central point replicate was utilized to both measure the reducing sugar yield and optimize the dilute NaOH pretreatment process.29,30 NaOH concentration (1%, 2%, 3%), reaction time (2 h, 4 h, 6 h), temperature (100 °C, 120 °C, and 140 °C, respectively), and substrate concentration (100 g L−1, 200 g L−1, and 300 g L−1, respectively) were confirmed respectively. A total of 29 experiments were carried out according to the Box–Behnken design as shown in Tables 2 and 3.31 As with the dilute NaOH pretreatment, the reducing sugar content was measured using the DNS method. For the analysis of these measurements, the statistical model was based on the RSM by linear regression using Design Expert software, version 8.0.6. The solid part was dried at 105 °C for 5 h for the subsequent enzymatic hydrolysis reaction.| Factors | Levels | ||
|---|---|---|---|
| −1 | 0 | 1 | |
| Reaction time (h) | 2 | 4 | 6 |
| Temperature (°C) | 100 | 120 | 140 |
| NaOH concentration (%, m/v) | 1 | 2 | 3 |
| Substrate concentration (g L−1) | 100 | 200 | 300 |
| Standard | Run | Reaction time X1 (h) | Temperature X2 (°C) | Con. of NaOH X3 (%) | Con. of substrate X4 (g L−1) | Response reducing sugar yield (%) | |
|---|---|---|---|---|---|---|---|
| Actual value | Predicted value | ||||||
| 22 | 1 | 4 | 140 | 2 | 100 | 3.76 | 3.74 |
| 26 | 2 | 4 | 120 | 2 | 200 | 2.79 | 2.79 |
| 21 | 3 | 4 | 100 | 2 | 100 | 3.14 | 3.15 |
| 2 | 4 | 6 | 100 | 2 | 200 | 2.71 | 2.66 |
| 19 | 5 | 2 | 120 | 3 | 200 | 2.6 | 2.51 |
| 27 | 6 | 4 | 120 | 2 | 200 | 2.74 | 2.79 |
| 17 | 7 | 2 | 120 | 1 | 200 | 2.00 | 2.21 |
| 8 | 8 | 4 | 120 | 3 | 300 | 2.51 | 2.37 |
| 15 | 9 | 4 | 100 | 3 | 200 | 2.68 | 2.77 |
| 1 | 10 | 2 | 100 | 2 | 200 | 2.33 | 2.51 |
| 12 | 11 | 6 | 120 | 2 | 300 | 2.36 | 2.48 |
| 5 | 12 | 4 | 120 | 1 | 100 | 3.19 | 3.24 |
| 20 | 13 | 6 | 120 | 3 | 200 | 2.97 | 2.85 |
| 11 | 14 | 2 | 120 | 2 | 300 | 2.25 | 2.11 |
| 6 | 15 | 4 | 120 | 3 | 100 | 3.24 | 3.17 |
| 3 | 16 | 2 | 140 | 2 | 200 | 2.74 | 2.70 |
| 4 | 17 | 6 | 140 | 2 | 200 | 3.55 | 3.29 |
| 18 | 18 | 6 | 120 | 1 | 200 | 2.45 | 2.62 |
| 29 | 19 | 4 | 120 | 2 | 200 | 2.86 | 2.79 |
| 24 | 20 | 4 | 140 | 2 | 300 | 2.34 | 2.42 |
| 13 | 21 | 4 | 100 | 1 | 200 | 2.27 | 1.94 |
| 14 | 22 | 4 | 140 | 1 | 200 | 2.99 | 2.91 |
| 16 | 23 | 4 | 140 | 3 | 200 | 2.28 | 2.61 |
| 9 | 24 | 2 | 120 | 2 | 100 | 3.37 | 3.25 |
| 10 | 25 | 6 | 120 | 2 | 100 | 3.49 | 3.63 |
| 28 | 26 | 4 | 120 | 2 | 200 | 2.66 | 2.79 |
| 7 | 27 | 4 | 120 | 1 | 300 | 1.78 | 1.76 |
| 23 | 28 | 4 | 100 | 2 | 300 | 2.09 | 2.19 |
| 25 | 29 | 4 | 120 | 2 | 200 | 2.90 | 2.79 |
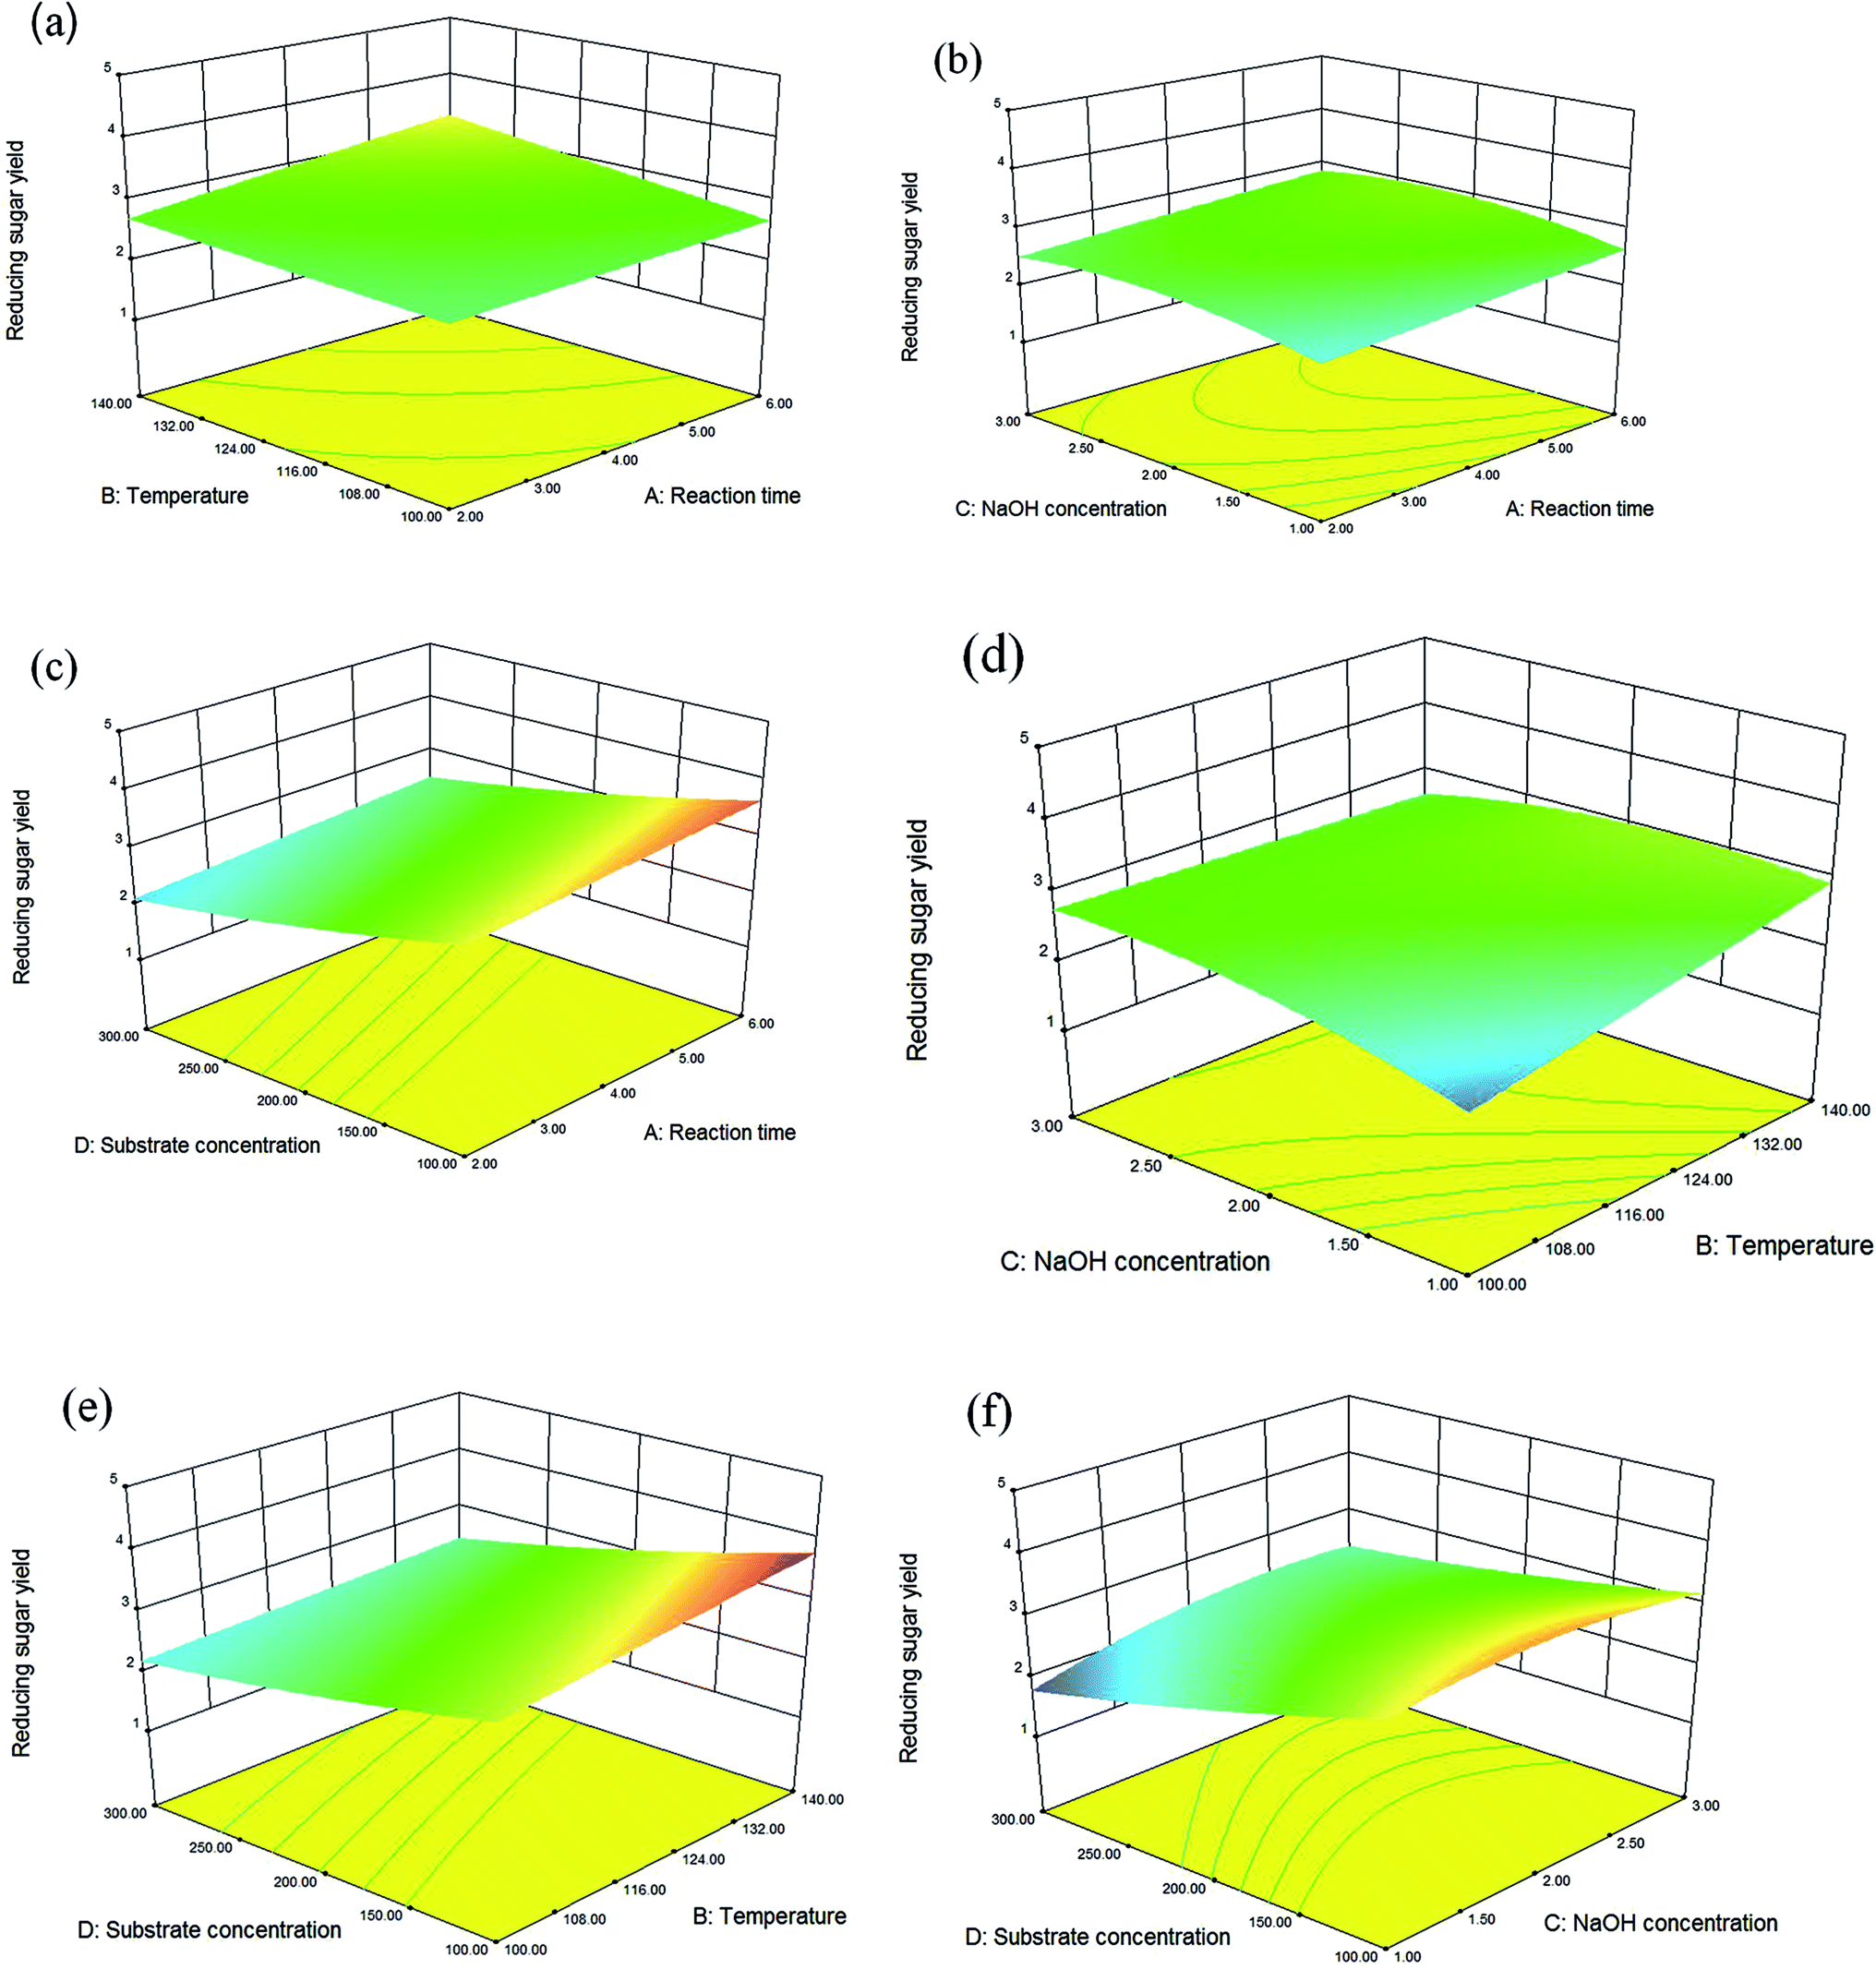
Tabletop scanning electron microscope analysis
During the pretreatment process, the structural property of the dairy manure was found to be altered. The TM-1000 was found to be an effective instrument to use for the measurement of this change. It was found that changes observed reached a magnification of 20–10000. Both the original manure and pretreated manure were dried at 105 °C for 5 h. These samples were then mounted on conductive double-sided tape and placed on the specimen stub. An image was displayed following the completion of the automatic function with an accelerating voltage of 15 kV.32 The different structural changes that were observed between the original manure and pretreated manure will be shown.
Enzymatic hydrolysis
Ethanol fermentation
In order to estimate the fermentation potential of the continuous enzymatic hydrolysate, Z. mobilis ZMT2 was chosen as the fermentation strain for ethanol production.25 Before inoculation, the continuous enzymatic hydrolysate was sterilized using as eptic membrane filtration. In addition, the RM medium was used as a control for the comparison of utilizing carbon and nitrogen during ethanol fermentation. Using a 10% inoculation concentration, the fermentation experiment was carried out at 30 °C without shaking. HPLC was used to analyze the glucose consumption and ethanol yield using the following equation:33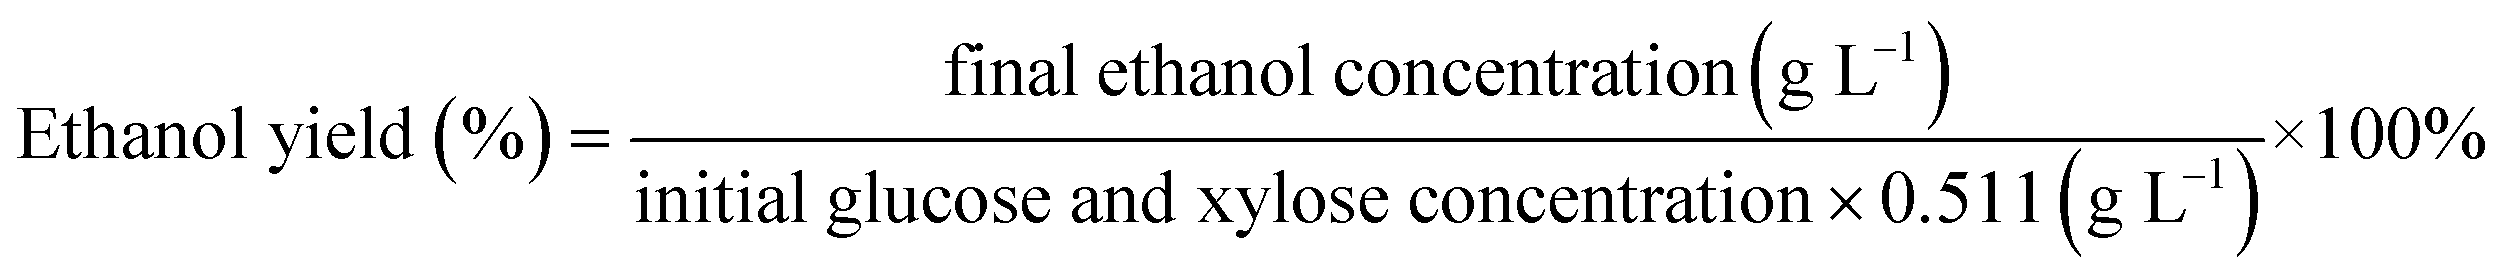
Analysis of nitrogen content
The nitrogen content in pretreated, enzymatic hydrolysis, and fermentation solutions were analyzed by a spectrophotometric method, using an auto analyzer (AA3, Bran + Luebbe, Norderstedt, Germany).34Results and discussion
Characterization of raw manure
The characterization of raw manure and NaOH-pretreated manure solids are presented in Table 1. Lignocellulosics (hemicellulose, cellulose and lignin) were found to account or 56.39% of the raw manure dry matter. Following NaOH pretreatment, the cellulose fraction was found to increase by 20%, from 24.57% to 44.78%. This observed increase is higher than the previous report of 35.67%.35 On the other hand, we observed a slight decrease in lignin and a significant decrease of hemicellulose. This indicates that the NaOH pretreatment efficiently disrupted the manure structure, reducing its crystallinity. The cellulose degradation process produces glucose, while the degradation of hemicellulose produces xylose. A high proportion of cellulose indicates that the protocol can be further optimized to produce more glucose.Dilute NaOH pretreatment
 | ||
| Fig. 1 Effects of (a) NaOH concentration, (b) reaction time and (c) temperature on reducing sugar. Data presented as the mean of replicates with standard deviation. | ||
The single factor experiment examining the effect of NaOH concentration was carried out first at 120 °C for 2 h, with an initial 100 g L−1 substrate concentration used, as shown in Fig. 1(a). Under conditions with 1% NaOH (w/v), the reducing sugar yield was calculated to be 2.90% (76.5 mg reducing sugar/5 g dry manure), which was nearly twice that of the 1.57% calculated with pure water pretreatment conditions. The maximum reducing sugar yield of 3.37% (88.8 mg reducing sugar/5 g dry manure) was achieved when a 6% NaOH concentration was used. Any further increase in alkali concentration provided only a minor influence on the reducing sugar recovery. For economical considerations, three different NaOH concentrations (1%, 2%, and 3%, w/v) were selected for response surface optimization.
Next, the effect of the reaction time on sugar recovery was examined. In these experiments, the reaction time ranged from 0.5 h to 8 h, with a fixed substrate concentration of 100 g L−1, a fixed temperature of 120 °C, and a fixed 4% NaOH concentration. As shown in Fig. 1(b), the reducing sugar yield was observed to rapidly increase from 2.70% (71 mg reducing sugar/5 g dry manure) at 0.5 h to 4.08% (107.5 mg reducing sugar/5 g dry manure) at 4 h. From 0.5 h to 4 h, the reducing sugar yield was found to increase to 1.38%, where it then stabilized. Only a 0.03% increase was observed when the reaction time was increased from 4 h to 8 h, with a reducing sugar yield of 4.11% (108.5 mg reducing sugar/5 g dry manure) at 8 h. These results demonstrate that NaOH treatment within 4 h was sufficient for reducing sugar recovery from dairy manure.
Finally, the effect of temperature on reducing the sugar yield was studied by examining six different temperatures, ranging from 90 °C to 140 °C. These experiments were carried out with a 4 h reaction time, a 100 g L−1 substrate concentration, and a 4% NaOH concentration. The trend of reducing sugar yield changes with temperature was similar to that observed with changes in the reaction time. As shown in Fig. 1(c), the reducing sugar yield was raised from 3.21% (84.5 mg reducing sugar/5 g dry manure) at 90 °C to 4.08% (107.5 mg reducing sugar/5 g dry manure) at 120 °C. However, when the temperature was increased from 120 °C to 140 °C, the reducing sugar yield was found to increase by only 0.10%. This suggests that the browning reaction occurred slowly at high temperatures. Higher temperature pretreatment combined with NaOH solution were found to effectively eliminate fiber crystallization.
| Reducing sugar yield (%) = −1.04667 − 0.19750X1 + 0.034917X2 + 2.46167X3 − 0.068333X4 + 2.68750 × 10−3X1X2 − 0.010000X1X3 − 1.25000 × 10−4X1X4 − 0.014000X2X3 − 4.62500 × 10−4X2X4 + 0.017000X3X4 − 1.14583 × 10−3X12 + 7.29167 × 10−6X22 − 0.23708X32 + 8.29167 × 10−4X42. |
| Source | Sum of squares | df | Mean square | F-Value | P-Value Prob > F | |
|---|---|---|---|---|---|---|
| Model | 6.04 | 14 | 0.43 | 10.37 | <0.0001 | Significant |
| X1-Reaction time | 0.42 | 1 | 0.42 | 10.05 | 0.0068 | |
| X2-Temperature | 0.50 | 1 | 0.50 | 11.92 | 0.0039 | |
| X3-NaOH concentration | 0.21 | 1 | 0.21 | 5.13 | 0.0400 | |
| X4-Substrate concentration | 3.92 | 1 | 3.92 | 94.25 | <0.0001 | |
| X1X2 | 0.046 | 1 | 0.046 | 1.11 | 0.3097 | |
| X1X3 | 0.0016 | 1 | 0.0016 | 0.038 | 0.8474 | |
| X1X4 | 0.000025 | 1 | 0.000025 | 0.0006008 | 0.9808 | |
| X2X3 | 0.31 | 1 | 0.31 | 7.54 | 0.0158 | |
| X2X4 | 0.034 | 1 | 0.034 | 0.82 | 0.3798 | |
| X3X4 | 0.12 | 1 | 0.12 | 2.78 | 0.1178 | |
| X12 | 0.0001363 | 1 | 0.0001363 | 0.003275 | 0.9552 | |
| X22 | 0.00005518 | 1 | 0.00005518 | 0.001326 | 0.9715 | |
| X32 | 0.36 | 1 | 0.36 | 8.76 | 0.0103 | |
| X42 | 0.045 | 1 | 0.045 | 1.07 | 0.3181 | |
| Residual | 0.58 | 14 | 0.042 | |||
| Lack of fit | 0.55 | 10 | 0.055 | 6.00 | 0.0495 | Significant |
| Pure error | 0.036 | 4 | 0.0091 | |||
| Cor total | 6.62 | 28 |
 | ||
| Fig. 2 Three dimension surface plot analysis of the effect of different treatment combination on reducing sugar yield. (a) Reaction time and temperature, (b) reaction time and NaOH concentration, (c) reaction time and substrate concentration, (d) temperature and NaOH concentration, (e) temperature and substrate concentration and (f) NaOH concentration and substrate concentration. | ||
Where, X1, X2, X3, and X4 refer to the reaction time, temperature, NaOH concentration, and substrate concentration, respectively.
On the basis of CCD from Box–Behnken and the theory of response surface analysis, the optimal conditions were determined to be a 6 h reaction time, 140 °C, a 1.34% NaOH concentration, and a 100 g L−1 substrate concentration. Under these optimal conditions, a reducing sugar yield of 4.15% (109.4 mg reducing sugar/5 g dry manure) was achieved. A verification test demonstrated similar results, with a reducing sugar yield of 4.14% (109.1 mg reducing sugar/5 g dry manure). These results demonstrate that the response surface method is both feasible and suitable for reducing sugar yield analysis under these conditions.
 | ||
| Fig. 3 Tabletop microscope of daily manure (500×). (a) Original daily manure and (b) pretreated manure (6 h, 140 °C, 1.34% NaOH and 100 g L−1 substrate concentration). | ||
Enzymatic hydrolysis
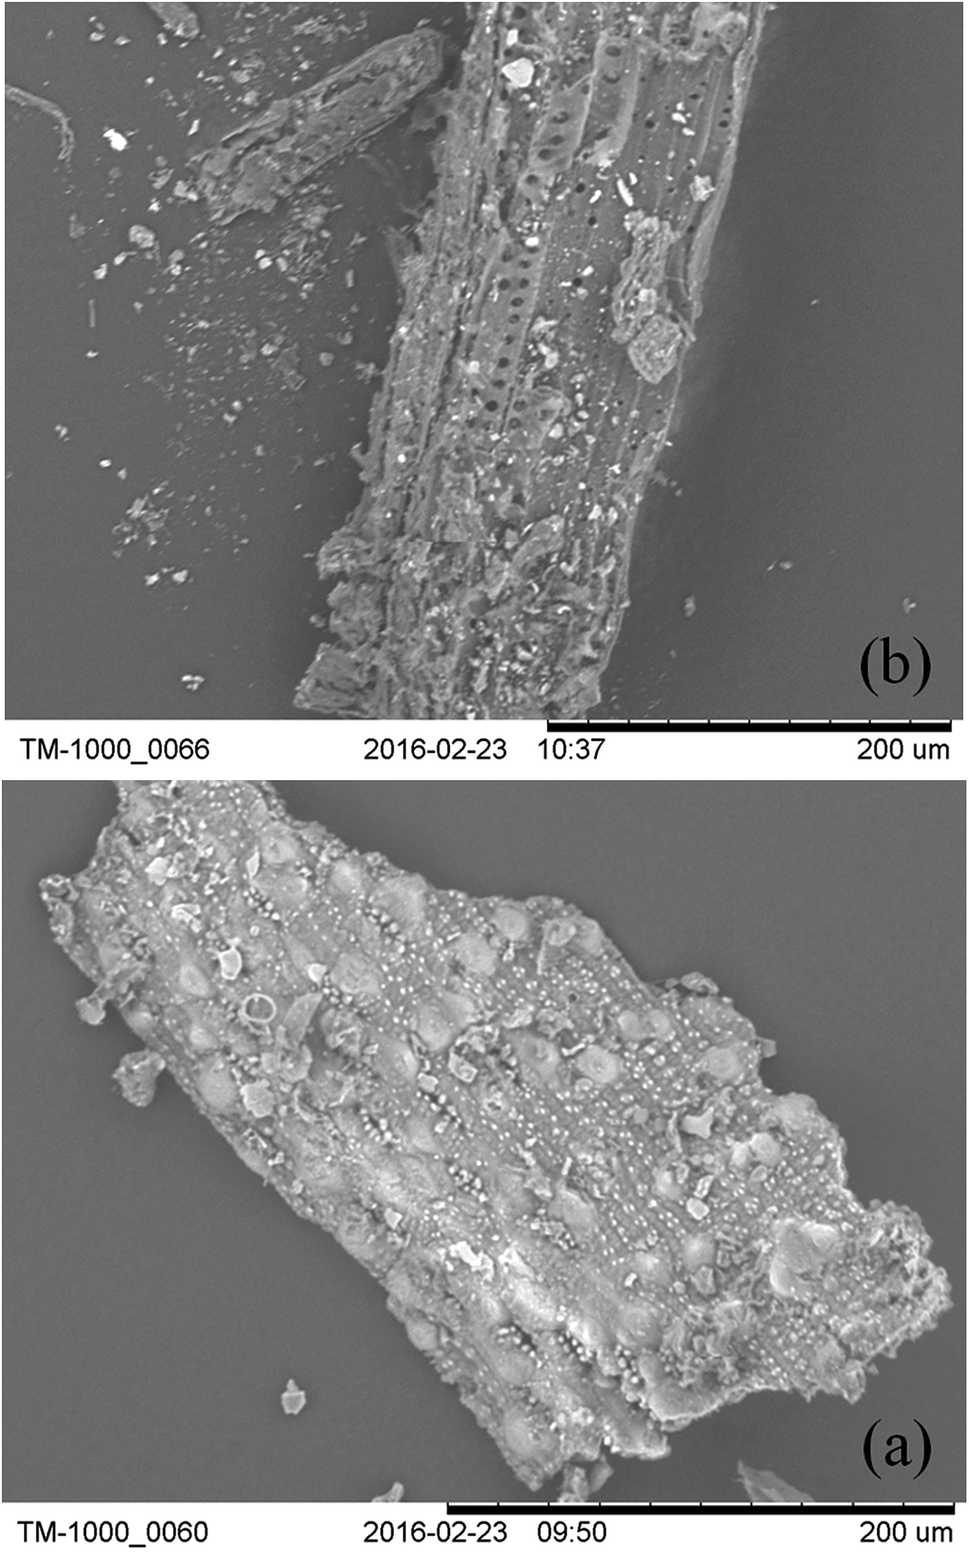
 | ||
| Fig. 4 Effects of (a) substrate concentration, (b) enzymolysis time and (c) enzyme dosage on reducing sugar yield. Data showed as the mean of replicates with standard deviation. | ||
Fig. 4(b) shows the effect of enzyme reaction time on sugar yield. The reducing sugar yield was found to increase from 27.1% (52.5 mg reducing sugar/0.3 g pretreated manure) to 53.1% (102.9 mg reducing sugar/0.3 g pretreated manure). The increase in the enzyme reaction time was found to result in a clear increase in the yield of reducing sugar. However, a further increase in the reaction time was found to have no obvious effect on the reducing sugar yield. After 72 h, the reducing sugar yield trend stabilized. These results indicate that a 72 h reaction time enables the concentration of reducing sugar to reach 3.4 g L−1, with longer reaction times not providing any further sugar release.
Cellulase was found to play a key role in the enzymatic hydrolysis reaction that influences the reducing sugar yield. The effect of enzyme dosage on reducing sugar yield is shown in Fig. 4(c). Under conditions where a 10 g L−1 substrate concentration was used, an increased dosage of enzyme (from 84 U to 196 U cellulase per g pretreated manure) was found to increase cellulose degradation, increasing the reducing sugar yield from 35.3% (68.5 mg reducing sugar/0.3 g pretreated manure) to 55.5% (107.5 g reducing sugar/0.3 g pretreated manure). However, when the cellulase dosage was greater than 196 U g−1 pretreated manure, the reducing sugar yield was found to have only a small decrease of 2.55%. This observation could be potentially explained by end-product inhibition. With lower enzyme dosages, the sugar concentration did not reach the maximum. However, when the enzyme dosage was higher than 196 U cellulase per g pretreated manure, the high concentration of sugars were found to have an inhibitory effect on cellulase activity.
Based on results from the single factor experiment analysis, the ideal enzymatic hydrolysis conditions were determined to be the following: a 10 g L−1 substrate concentration, a 72 h enzyme reaction time, and a 196 U g−1 pretreated manure cellulase dosage.
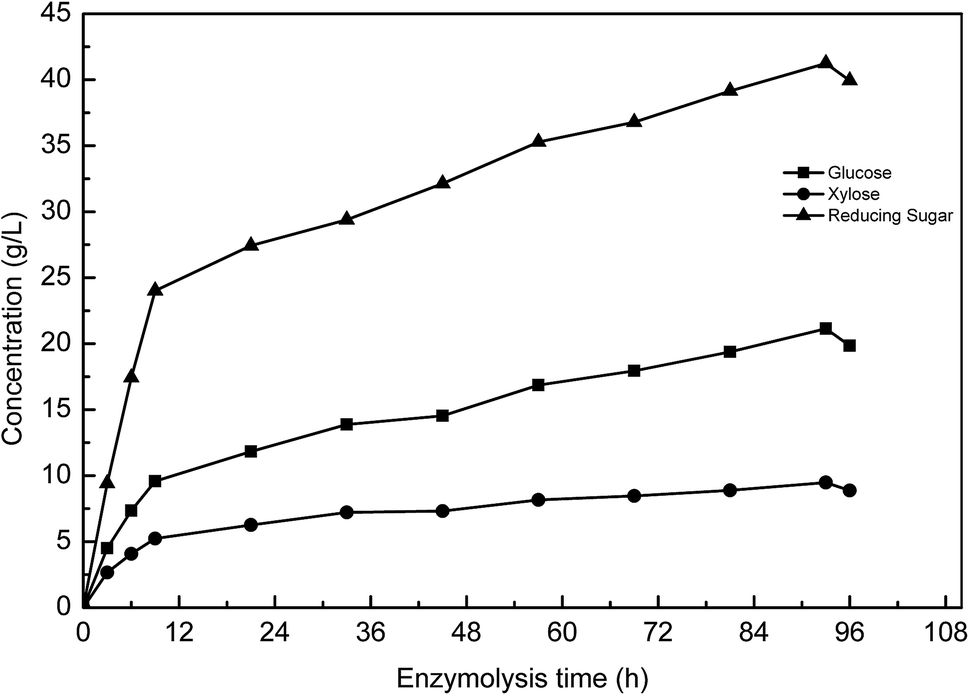 | ||
| Fig. 5 Changes of reducing sugar, glucose and xylose in the continuous enzymolysis process. | ||
 | ||
| Fig. 6 Ethanol fermentation using continuous enzymatic hydrolysate by Z. mobilis ZMT2. (a) Continuous enzymatic hydrolysate fermentation, and (b) RM medium control. | ||
Microbial growth and metabolism require an adequate nitrogen source. In our fermentation experiments, the nitrogen content in pretreated manure hydrolysate was reduced from 108.2 mg L−1 to 57.0 mg L−1, indicating that 47.3% of the nitrogen source had been consumed by Z. mobilis ZMT2 for cell growth and metabolism (as shown in Fig. 7). In comparison with results shown in Fig. 6(a), Z. mobilis ZMT2 was found to be able to ferment manure hydrolysate for ethanol production in the absence of an additional nitrogen source. This indicates that the nitrogen content in the enzymatic hydrolysate was sufficient for Z. mobilis growth and metabolism. While previous studies have reported the ability to produce ethanol from animal manure,20,21 the transforming rule of ammonia nitrogen was unclear in these studies. In our current work, we first show that some ammonia nitrogen resources exist in manure, which may be utilized as a nitrogen source for ethanol production. Following fermentation, 47.3% of the nitrogen source was found to be consumed by Z. mobilis. The preliminary study regarding ammonia nitrogen utilization in Z. mobilis will provide insight into the nitrogen utilization metabolic pathway.
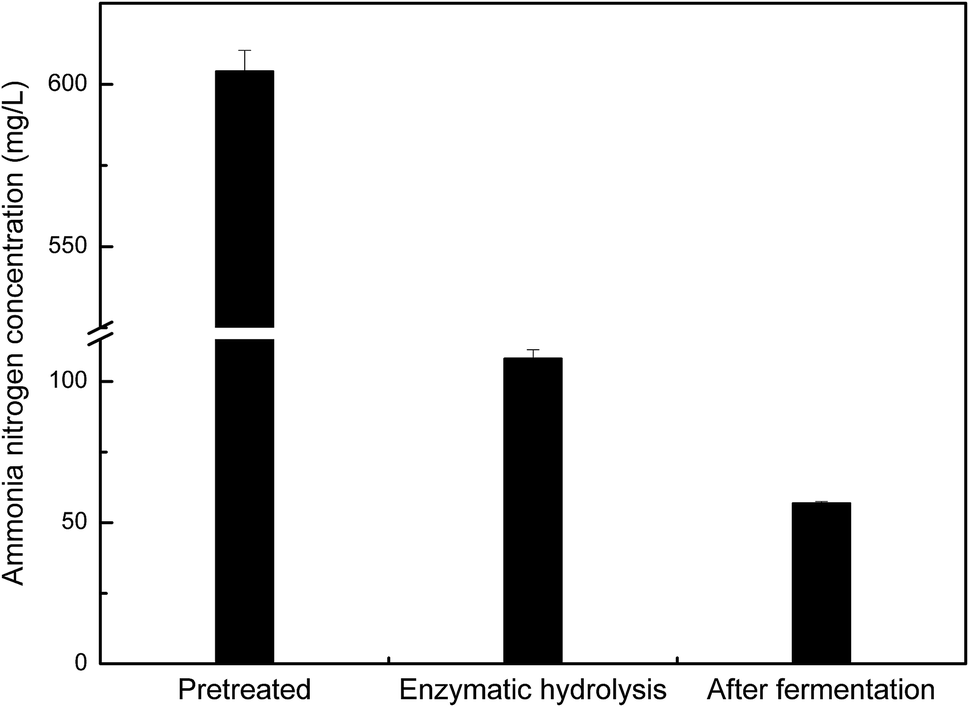 | ||
| Fig. 7 The nitrogen content in the pretreated, enzymatic hydrolysis, and fermentation solution. | ||
It is important to note that other industrial nitrogen sources used for cellulosic ethanol, i.e. corn steep liquor (CSL), diammonium phosphate (DAP), have been estimated to incur costs between $1.7 and 2.2 million per year in a 200 million liter ethanol plant.18,19 Thus, a sustainable alternative nitrogen source is desirable. In our current study, dairy manure was shown to provide not only a fermentable sugar, but also an adequate nitrogen source for ethanol production. This source will provide a new candidate biomass resource for the production of ethanol or other chemicals in the future. Furthermore, we also speculate that the addition of dairy manure could also be used in the process of cellulosic ethanol production for balancing the C/N ratio, without the need for any additional nitrogen source. Thus, the economic benefits of nitrogen from dairy manure could extend beyond cellulosic ethanol to the production of other chemicals.
Interestingly, previous studies have also indicated that Z. mobilis could utilize N2 as a nitrogen source via the N2 fixation pathway.22 In a cellulosic feedstock-derived medium, Z. mobilis was demonstrated to achieve a similar cell density and a slightly higher ethanol yield when provided with N2 instead of the industrial nitrogen supplement.22 Genomic evidence also demonstrates the presence of a N2 fixation pathway in Z. mobilis, with the identification of some genes that are potentially involved in nitrogenase function and regulation including nifH (ZMO1823), nifK (ZMO1824), and nifD (ZMO1825). The gene (ZMO0493), which encodes glutamine synthetase, along with two genes (ZMO1116 and ZMO1117) that encode glutamate synthase have also been identified in Z. mobilis, and could play a role in the conversion of ammonia to L-glutamine. Thus, the current study regarding N2 fixation along with our study regarding ammonia nitrogen utilization from manure in Z. mobilis will provide advantages for ethanol production through the utilization of a cheaper nitrogen source.
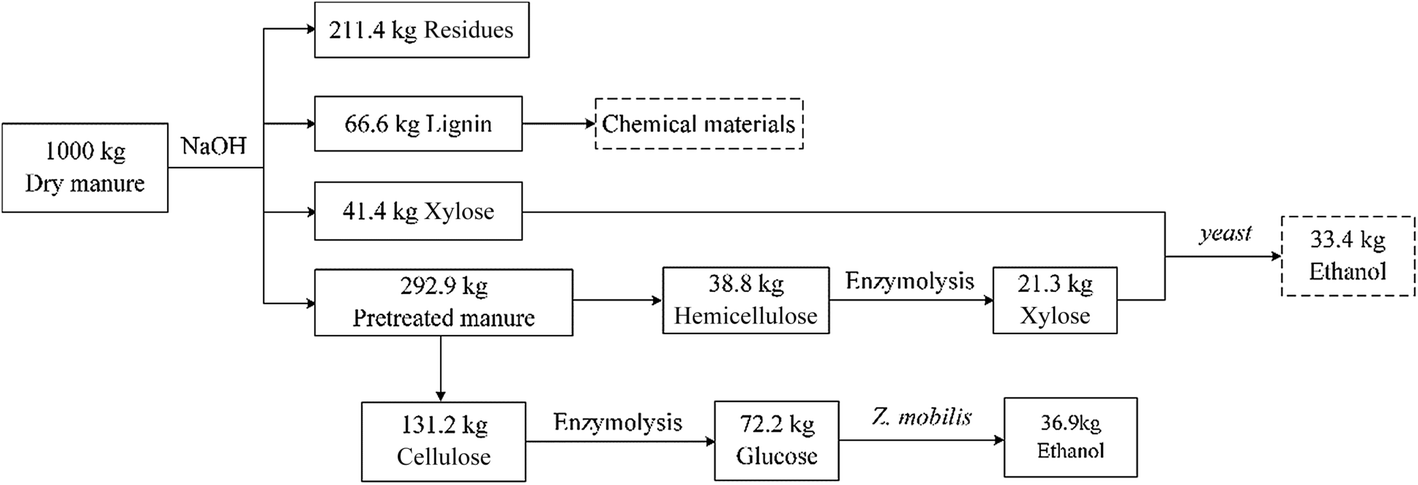 | ||
| Fig. 8 Laboratory scale mass balance of dairy manure-to-ethanol conversion process. | ||
Conclusions
In this study, we show that NaOH pretreatment can efficiently remove the barrier of lignocellulose, exposing cellulose and hemicellulose. Response surface method analysis determined the optimal conditions for the NaOH pretreatment were using a 6 h reaction time, a 140 °C temperature, a 1.34% NaOH concentration, and a 100 g L−1 substrate concentration. Enzymatic hydrolysis was determined to be a key step in the transformation of cellulose and hemicellulose into soluble monosaccharides, such as glucose and xylose. Continuous enzymolysis was found to increase the glucose concentration to 19.84 g L−1, resulting in a good fermentation performance of 10.5 g L−1 ethanol and a 71.9% yield. Based on the results of the NaOH pretreatment, enzymatics, and ethanol fermentation, we also determined the degradation profile of manure cellulose and nitrogen resources that were utilized during ethanol fermentation. Taken together, these results demonstrate that dairy manure contains a suitable amount of carbon and nitrogen source for microbial growth. These results demonstrate the great potential of pretreatment, enzymatics and the fermentation process on ethanol production. Further research should be directed towards pentose fermentation and broadening the scope sugars that can be used.Conflicts of interest
The authors declare that they have no competing interests.Authorship
Mr YY carried out all experiments, participated in the study design and wrote the draft manuscript with the help of the other authors. MXH designed the whole study and improved the final manuscript. SL, YWW, BW, FRT, HQ, and QLZ participated in ethanol fermentation and mass balance. BW and FRT helped in the draft manuscript editing. ZYR, KDM, LCD, MZ and GQH participated in the discussion and helped in the manuscript editing. All authors read and approved the final manuscript.Funding information
This research was financially supported by Sichuan Key Technology R&D Program (Grant No. 2014NZ0045), the National Natural Science Foundation of China (Grant No. 31570055), Youth Science and Technology Foundation of Sichuan Province (Grant No. 2015JQO047) and National Key Technology R&D Program of China (Grant No. 2014BAD02B06-03) to Ming-Xiong He.This research was partially supported by Special Fund for Agro-scientific Research in the Public Interest (201403019) and New Energy Program of Rural and Pastoral Areas from Science & Technology Department of Qinghai Province (Grant No. 2015-NN-E01) to Guo-Quan Hu.
Availability of supporting data
The strain Z. mobilis ZMT2 has been deposited at China General Microbiological Culture Collection Center (CGMCC) under the accession number CGMCC11888.Acknowledgements
This research was financially supported by Youth Science and Technology Foundation of Sichuan Province (Grant No. 2015JQO047), the National Natural Science Foundation of China (Grant No. 31570055). Partially supported by Sichuan Key Technology R&D Program (Grant No. 2014NZ0045), Special Fund for Agro-scientific Research in the Public Interest (201403019), New Energy Program of Rural and Pastoral Areas from Science & Technology Department of Qinghai Province (Grant No. 2015-NN-E01) and National Key Technology R&D Program of China (Grant No. 2014BAD02B06-03).References
- J. L. Rico, H. Garcia, C. Rico and I. Tejero, Bioresour. Technol., 2007, 98, 971–979 CrossRef CAS PubMed.
- B. Drosg, W. Fuchs, T. A. Seadi, M. Madsen and B. Linke, Nutrient Recovery by Biogas Digestate Processing, IEA Bioenergy, 2015, pp. 7–11 Search PubMed.
- W. Yao, X. Wu, J. Zhu, B. Sun and C. Miller, Trans. ASABE, 2009, 52, 2047–2054 CrossRef CAS.
- J. Sun, J. Zhu and W. Li, Biomass Bioenergy, 2012, 47, 442–450 CrossRef CAS.
- W. Liao, Y. Liu, C. Frear and S. Chen, Bioresour. Technol., 2008, 99, 5859–5866 CrossRef CAS PubMed.
- L. Wang, Y. Li, P. Chen, M. Min, Y. Chen, J. Zhu and R. R. Ruan, Bioresour. Technol., 2010, 101, 2623–2628 CrossRef CAS PubMed.
- Z. Wen, W. Liao and S. Chen, Bioresour. Technol., 2005, 96, 491–499 CrossRef CAS PubMed.
- Z. Wen, W. Liao and S. Chen, Process Biochem., 2005, 40, 3087–3094 CrossRef CAS.
- K. Mirahmadi, M. M. Kabir, A. Jeihanipour, K. Karimi and M. J. Taherzadeh, BioResources, 2015, 5, 928–938 Search PubMed.
- Y. Chen, M. A. Stevens, Y. Zhu, J. Holmes and H. Xu, Biotechnol. Biofuels, 2013, 6, 1–10 CrossRef PubMed.
- M. Irfan, U. Asghar, M. Nadeem, R. Nelofer, Q. Syed, H. A. Shakir and J. I. Qazi, Waste Biomass Valorization, 2016, 1–8, DOI:10.1007/s12649-016-9540-2.
- C. Teater, Z. Yue, J. MacLellan, Y. Liu and W. Liao, Bioresour. Technol., 2011, 102, 1856–1862 CrossRef CAS PubMed.
- X. Zhang, J. Xu and J. J. Cheng, Energy Fuels, 2011, 25, 4796–4802 CrossRef CAS.
- J. Xu, X. Zhang and J. J. Cheng, Bioresour. Technol., 2012, 111, 255–260 CrossRef CAS PubMed.
- S. Chovau, D. Degrauwe and B. Van der Bruggen, Renewable Sustainable Energy Rev., 2013, 26, 307–321 CrossRef CAS.
- M. X. He, J. L. Wang, H. Qin, Z. X. Shui, Q. L. Zhu, B. Wu, F. R. Tan, K. Pan, Q. C. Hu, L. C. Dai, W. G. Wang, X. Y. Tang and G. Q. Hu, Carbohydr. Polym., 2014, 111, 645–654 CrossRef CAS PubMed.
- M. X. He, B. Wu, H. Qin, Z. Y. Ruan, F. R. Tan, J. L. Wang, Z. X. Shui, L. C. Dai, Q. L. Zhu, K. Pan, X. Y. Tang, W. G. Wang and Q. C. Hu, Biotechnol. Biofuels, 2014, 7, 101 CrossRef PubMed.
- C. Chapple, M. Ladisch and R. Meilan, Nat. Biotechnol., 2007, 25, 746–748 CrossRef CAS PubMed.
- H. Li, N.-J. Kim, M. Jiang, J. W. Kang and H. N. Chang, Bioresour. Technol., 2009, 100, 3245–3251 CrossRef CAS PubMed.
- R. R. Patterson and D. D. Morgan, Europen Patent: EP 0085810 A2, 1982.
- A. G. Woldesenbet, G. Shiferaw and B. S. Chandravanshi, Afr. J. Environ. Sci. Technol., 2013, 7, 435–440 CrossRef CAS.
- T. A. Kremer, B. LaSarre, A. L. Posto and J. B. McKinlay, Proc. Natl. Acad. Sci. U. S. A., 2015, 112, 2222–2226 CrossRef CAS PubMed.
- P. S. Panesar, S. S. Marwaha and J. F. Kennedy, J. Chem. Technol. Biotechnol., 2006, 81, 623–635 CrossRef CAS.
- H. K. Goering and P. J. Van Soest, Usda Agr Handb, 1970 Search PubMed.
- J.-L. Wang, B. Wu, H. Qin, Y. You, S. Liu, Z.-X. Shui, F.-R. Tan, Y.-W. Wang, Q.-L. Zhu, Y.-B. Li, Z.-Y. Ruan, K.-D. Ma, L.-C. D. Dai, G.-Q. Hu and M.-X. He, Microb. Cell Fact., 2016, 15, 1 CrossRef PubMed.
- A. E. Goodman, P. L. Rogers and M. L. Skotnicki, Appl. Environ. Microbiol., 1982, 44, 496–498 CAS.
- G. L. Miller, Anal. Chem., 1959, 31, 426–428 CrossRef CAS.
- Y.-C. He, Y. Ding, Y.-F. Xue, B. Yang, F. Liu, C. Wang, Z.-Z. Zhu, Q. Qing, H. Wu, C. Zhu, Z.-C. Tao and D.-P. Zhang, Bioresour. Technol., 2015, 193, 324–330 CrossRef CAS PubMed.
- T. Ponrasu, B. Manohar and S. Divakar, Process Biochem., 2009, 44, 251–255 CrossRef CAS.
- J. Wang, D. Q. Lu, Z. Hui, X. Q. Ling, B. Jiang and P. K. Ouyang, Afr. J. Biotechnol., 2009, 8, 1416–1424 CAS.
- Y. Ding, J. Zheng, X. Xia, T. Ren and J. Kan, LWT–Food Sci. Technol., 2016, 67, 206–213 CrossRef CAS.
- K. Wilkinson, J. Lundkvist, G. Seisenbaeva and V. Kessler, Environ. Pollut., 2011, 159, 311–318 CrossRef CAS PubMed.
- Y. Koike, M. Z. An, Y. Q. Tang, T. Syo, N. Osaka, S. Morimura and K. Kida, J. Biosci. Bioeng., 2009, 108, 508–512 CrossRef CAS PubMed.
- D. Yang, L. Deng, D. Zheng, L. Wang and Y. Liu, J. Environ. Manage., 2016, 168, 87–93 CrossRef CAS PubMed.
- W. Liao, Y. Liu, C. Liu and S. Chen, Bioresour. Technol., 2004, 94, 33–41 CrossRef CAS PubMed.
- L. Tan, Z.-Y. Sun, S. Okamoto, M. Takaki, Y.-Q. Tang, S. Morimura and K. Kida, Biomass Bioenergy, 2015, 81, 265–272 CrossRef CAS.
| This journal is © The Royal Society of Chemistry 2017 |