
 Open Access Article
 This Open Access Article is licensed under a
 Creative Commons Attribution 3.0 Unported Licence
An activity-calibrated chemical standardization approach for quality evaluation of Salvia miltiorrhiza Bge.†
Zhen-jie Liu‡
abc,
Zhi-long Shi‡ab,
Can Tuab,
Hai-zhu Zhangab,
Dan Gaob,
Chun-yu Lib,
Qin Heb,
Rui-sheng Lib,
Yu-ming Guob,
Ming Niub,
Cong-en Zhangb,
Yong-shen Reng,
Han-shen Zhen*af,
Jia-bo Wang *be and
Xiao-he Xiao*dg
*be and
Xiao-he Xiao*dg
aCollege of Pharmacy, Chengdu University of Traditional Chinese Medicine, Chengdu 610075, China. E-mail: 8zhen@163.com
bChina Military Institute of Chinese Medicine, 302 Military Hospital, Beijing 100039, China. E-mail: pharm_sci@126.com
cGuangxi Botanical Garden of Medicinal Plants, Nanning 530023, China
dIntegrative Medical Center, 302 Military Hospital, Beijing 100039, China. E-mail: pharmacy302xxh@126.com; 8zhen@163.com
eState Key Laboratory Breeding Base of Systematic Research, Development and Utilization of Chinese Medicine Resources, Chengdu University of Traditional Chinese Medicine, Chengdu 610075, China
fCollege of Pharmacy, Guangxi University of Traditional Chinese Medicine, Nanning 530001, China
gSchool of Pharmaceutical Sciences, South-Central University for Nationalities, Wuhan, Hubei 430074, China
First published on 17th January 2017
Abstract
Due to the inherent nature of the heterogeneity and complexity in the chemical composition of medicinal plants, there are significant challenges in the characterization and quantification of all active chemical constituents of botanicals, such as those used in traditional Chinese medicines (TCMs) and botanical drugs (BDs). The selection of one or even multiple marker chemical compounds for quality control may often be inadequate, as those marker compounds may not be associated with or fully represent the clinical effects of the botanical products. In this study, we proposed a novel activity-associated chemical analysis approach, named the effect-constituents index (ECI), to evaluate the quality of TCMs, using Salvia miltiorrhiza Bge. (SM), a commonly used TCM herb, as an example. The ECI is not only a quantitative analysis of multiple chemical constituents, but also includes an effect-based calibration of the relative bioactivity coefficient of each chemical constituent to express “the whole biological/pharmacological effect” of a TCM. Our chemical assay results showed significant variations in the contents (Ci) of nine main constituents, including cryptotanshinone and salvianolic acid B, in the SM samples. In addition, neither the concentrations of the individual constituents nor the sum of those constituents in the tested SM samples had good associations (r < 0.81) with the biopotency of SM itself, based on the activity data from an antiplatelet aggregation test. To calculate the ECI, cryptotanshinone and the other five constituents of high biopotency (above 660 U mmol−1) were selected, and their biopotency values were set as the calibration weight of each constituent; then, the sum of the products of content (Ci) and biopotency weight (Fi) were calculated as the ECI. By regression analysis, the ECI had either the highest correlation coefficient (r = 0.92, p < 0.001) with the biopotency of SM or the lowest residual compared to the chemical contents. Moreover, the ECI showed a good ability to distinguish and predict the biopotency-based quality grade, while the chemical markers alone did not. In conclusion, our study indicates that this effect-calibrated quantitative approach is a useful tool to associate the “quality” with the potential clinical effects of TCMs and BDs consisting of multiple active constituents or known chemical marker compounds.
Introduction
Despite the rapid expansion of the consumption of traditional Chinese medicines (TCMs) and botanical drugs (BDs) worldwide,1,2 there are still significant challenges in controlling the quality of such products,3,4 particularly in achieving the ultimate purpose of quality control – to determine batch-to-batch consistency in terms of quality.5–7 It is well known that known chemical markers in a TCM herb are not always associated with its clinical effects. In addition, there are inherent difficulties in recognizing all of the chemical constituents in TCMs and BDs, let alone active constituents. Most recently, the U.S. Food and Drug Administration issued a document titled ‘Botanical Drug Development Guidance for Industry’ that noted the necessity of biological assays for measuring the biopotency of TCMs and BDs in quality control.8Our group had established several biological assay methods for the quality control of TCMs, such as purgative activity assays, cardiac activity assays, antiviral activity assays, and antiplatelet aggregation assays.8–18 Despite the potential advantage of being able to show close association with clinical efficacy, biological assays still have some limitations, such as limited operability, high cost, low precision, and animal ethics issues, when live animals are used in some instances.2,19–22 However, those limitations are usually not limitations for chemical analyses. Hence, it might be attractive if we can combine the two types of approaches, chemical determination and biological assays, to form a novel methodology with added ability to control the quality of TCMs and BDs and demonstrate consistency.
As a result, we propose a novel efficacy-associated approach, named the effect-constituents index (ECI), to evaluate the quality of TCMs.2 The ECI is not only a determination of multiple chemical constituents but also an effect-based calibration using the relative bioactivity coefficient of each chemical constituent to express the whole effect of a TCM. To form the ECI, the chemical constituents of high biopotency are selected, and the biopotency values are set as the calibration weight of each constituent; then, the sum of the products of constituent content (Ci) and the biopotency weight (Fi) is calculated as the ECI, which equates to the “total bioactivity” of those constituents in a TCM or BD. Thus, the ECI would have a good association with clinical efficacy similar to a biological assay. Moreover, when the ECI has been constructed for a specific TCM or BD, the only instrumental analysis needed is the chemical determination of given constituents.
ECI was only clarified in theory, but it was not validated in practice. To test the proposed ECI approach, we chose the commonly used TCM Salvia miltiorrhiza Bge. (SM or Danshen in Chinese) as an example. SM is widely used in Asia, the United States and European countries for the prevention and treatment of cardiovascular and cerebrovascular diseases.23,24 The beneficial actions are attributable to anti-coagulant, anti-thrombotic, and especially anti-platelet aggregation effects.25,26 Platelet aggregation is one of the essential contributors to the onset and development of cardiovascular diseases. Some constituents isolated from SM, such as salvianolic acid B and cryptotanshinone, were proven to have antiplatelet aggregation activity.27–30 At present, quality control for SM is performed routinely with multi-constituent determination by high performance liquid chromatography, as stipulated in the China Pharmacopeia (ChP), United States Pharmacopeia (USP), and European Pharmacopeia (EP). For example, four chemicals, salvianolic acid B, tanshinone, tanshinone IIA, and cryptotanshinone, were determined as quality markers of SM in the ChP. However, we found that the sum of those four constituents could not distinguish the bioactivity-based quality grade of SM, indicating its limited ability to control the real quality associated with clinical efficacy. Therefore, there is an obvious need to establish a new quality control method for SM. The experimental flow chart of this study is shown in Fig. 1.
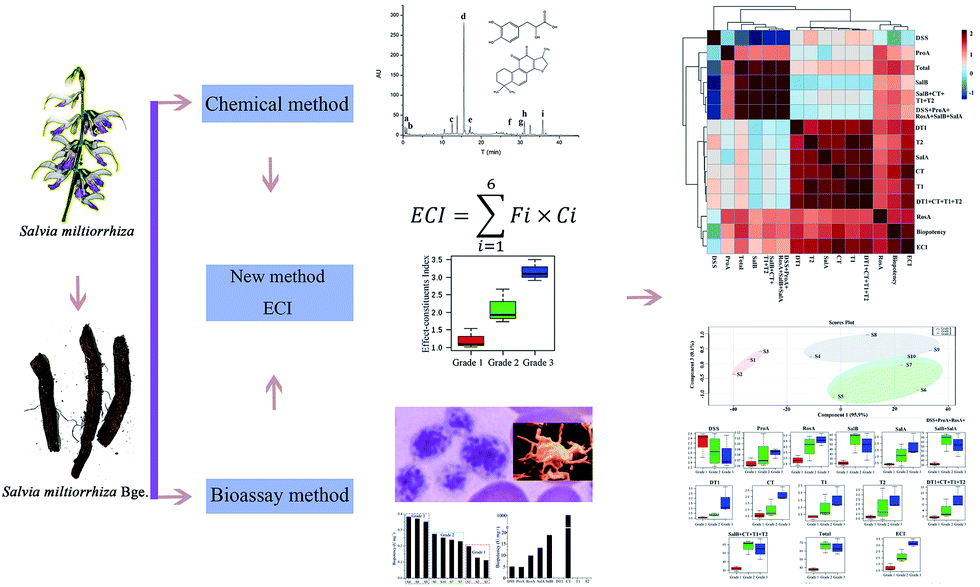 | ||
| Fig. 1 The experimental flow chart. | ||
Results
Content of components of SM
Ten batches of SM samples from various sources, which were authenticated by Professor Xiao-He Xiao (Integrative Medical Center, 302 Military Hospital of China), were numbered and listed as follows: S1 from Qingyang, Gansu Province (lot 20150601); S2 from Mengzhou, Henan Province (lot 20150602); S3 from Luoyang, Henan province (lot 20150603); S4 from Tai-hang Mountains (lot 20150604); S5 from Linyi, Shandong province (lot 20150605); S6 from Yuncheng, Shanxi Province (lot 20150606); S7 from Baoding, Hebei Province (lot 20150607); S8 from Sangluo, Shanxi Province (lot 20150608); S9 from Shijiazhuang, Hebei Province (lot 20150609); and S10 from Zhongjiang, Sichuan Province (lot 201506010). The standards, test solutions and HPLC-DAD fingerprint of SM are shown in Fig. 2. The results of the chemical assay show that there was large difference between the contents of the nine chemical constituents in SM, and the fingerprints of the 10 batches of SM were also variable.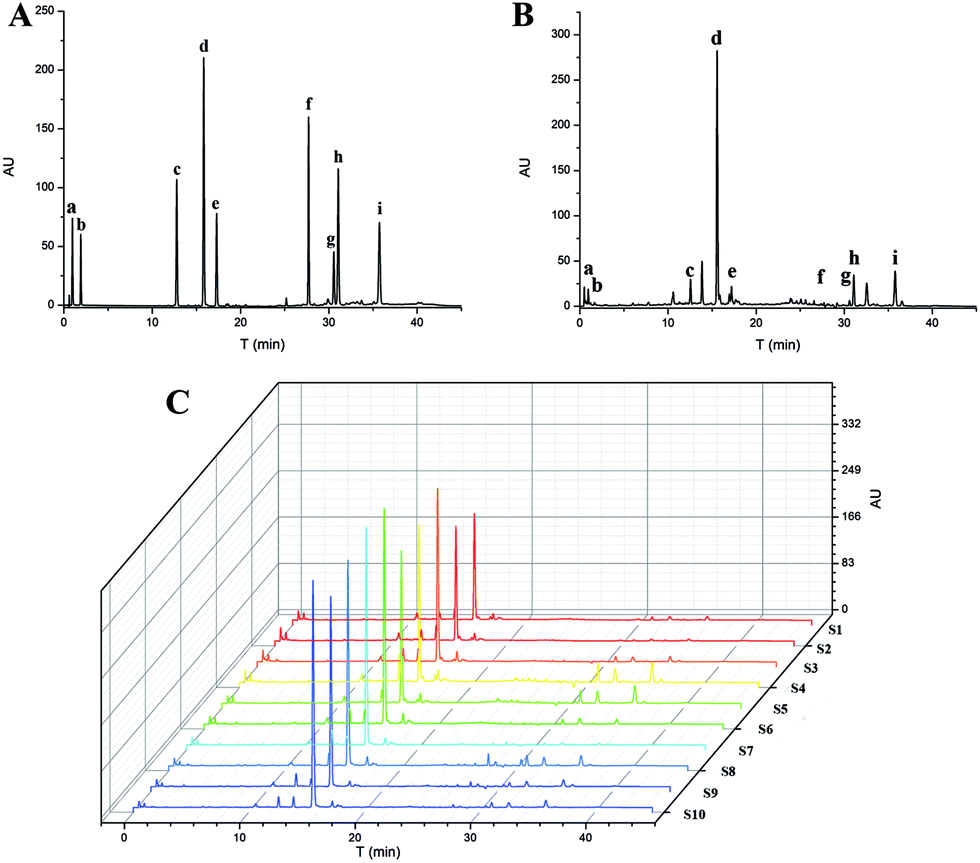 | ||
| Fig. 2 HPLC of standards (A), test solutions (B) and fingerprints recorded for extracts from several batches (C). Nine peaks were identified by comparison with standard substances: danshensu, DSS (a); protocatechuic aldehyde, ProA (b); rosemary acid, RosA (c); salvianolic acid B, SalB (d); salvianolic acid A, SalA (e); dihydrotanshinone I, DT1 (f); cryptotanshinone, CT (g); tanshinone I, T1 (h); and tanshinone IIA, T2 (i). | ||
Clustering analysis was a statistic method used for determining the natural structure of object in multidimensional profiles. The clustering analysis can divide objects or individuals into specific clusters in a way that maximizes homogeneity within each cluster while also maximizing heterogeneity between clusters.31,32 We introduce the concept of cluster analysis to distinguish the difference of SM from various sources. The inherent characteristics of SM from various source could not be directly reflected by the data of contents. Hence, we introduced the concept of cluster analysis to dig the difference of chemical profile or to find out the rule of variation. Furthermore, it was suitable for us to compare chemical profile and biopotency of SM. Results of the cluster analysis showed that the SM separated into five clusters, as shown in Fig. 3. Cluster 1 included S04 and S05; cluster 2 included S01, S02, and S03; cluster 3 included S07 and S10; cluster 4 contained only S06; and cluster 5 contained S08, S09. The samples in cluster 1 were batches of SM with high liposoluble tanshinone and SalA contents. The samples in cluster 2 were batches of SM with low contents of all. The samples in cluster 3 had high contents of SalB. The S06 sample in cluster 4 was different from the others; it contained the highest content of ProA. The samples in cluster 5 had higher content of all the components except DSS. Although the SM were divided into 5 groups using chemical contents (Fig. 3), the groups were still different with biopotency grades of SM (Fig. 4D). Therefore, chemical profile could not accurately reflect bioactivity of SM.
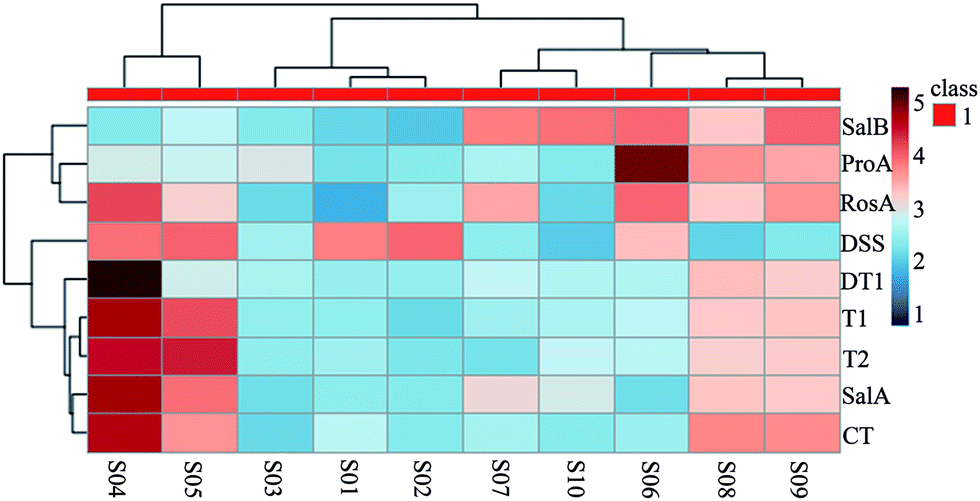 | ||
| Fig. 3 Heatmaps of nine constituent contents in Salvia miltiorrhiza Bge. from different sources. | ||
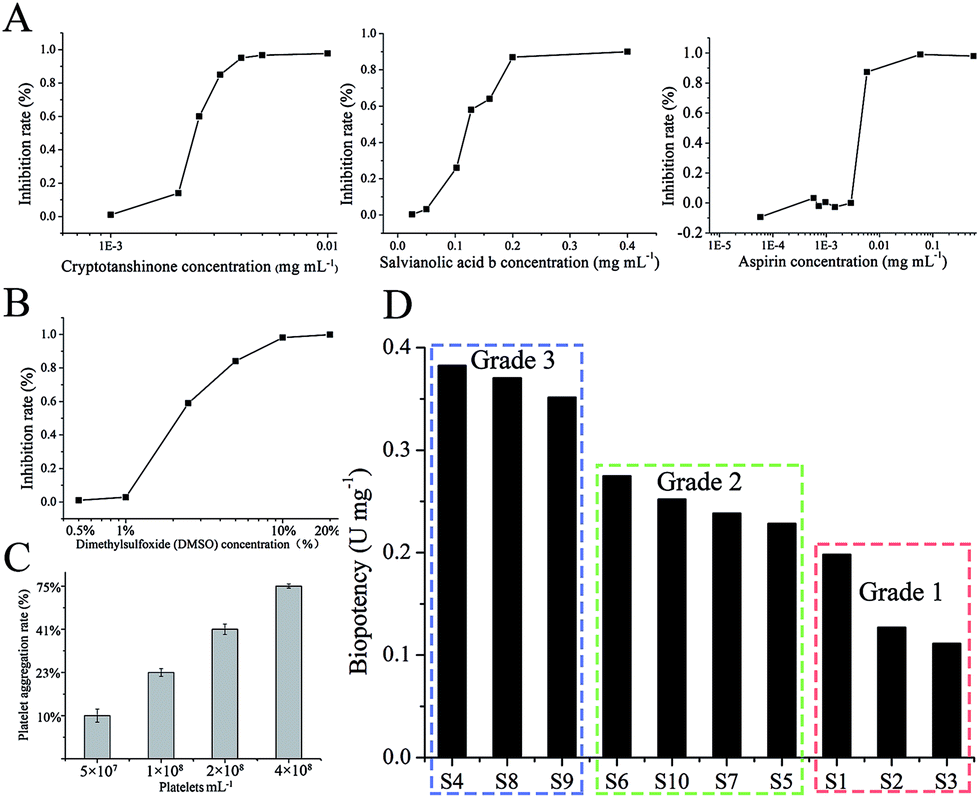 | ||
| Fig. 4 Standardization of the constituents cryptotanshinone, CT, salvianolic acid B, SalB and aspirin (A); influence of dimethylsulfoxide (DMSO) in different concentrations on anti-platelet aggregation (B); results of maximum platelet aggregation rate of platelet rich plasma (PRP) on different platelets concentration (C); biopotency of ten SM (D). | ||
Biopotency test
In order to choose a standard substance for bioassay, the biopotency of three constituents (SalB, CT, aspirin) were measured (Fig. 4A), and the appropriate constituent would be selected as standard substance. The dose-dependent graphs of SalB, CT, and aspirin are shown in Fig. 4A. The order of biopotency was as follows: CT, aspirin, and SalB. CT has a significant dose-dependent relation and the strongest efficacy, so we selected CT as the standard for this bioassay and defined 1 mg of CT as 1000 units (U).The investigation results on the influence of DMSO in different concentrations are shown in Fig. 4B. The 0.5% DMSO solution appears to have no influence on platelet aggregation (Fig. 4B). To have a high maximum platelet aggregation rate of vehicle-treated platelet-rich plasma (PRP), the PRP should be adjusted to 4 × 10⁸ platelets per mL (Fig. 4C). The anti-platelet aggregation effects of SM were examined using rat PRP, and the inhibition was calculated into biopotency. As shown in Fig. 4D, the measured biopotency was divided into 3 groups. The low group (S1, S2, S3) had a biopotency of 0.1–0.2 U; the middle group (S5, S6, S7, S10) had a biopotency of 0.2–0.3 U; and the high group (S4, S8, S9) had a biopotency of 0.3–0.4 U. The feasible limit of this bioassay was below 58.31%.
The correlation analysis results of the contents and biopotency are shown in Fig. 5. According to the results, all the contents and sum of contents in SM had different correlations (R = 0.2398–0.8046) with the biopotency of SM.
 | (1) |
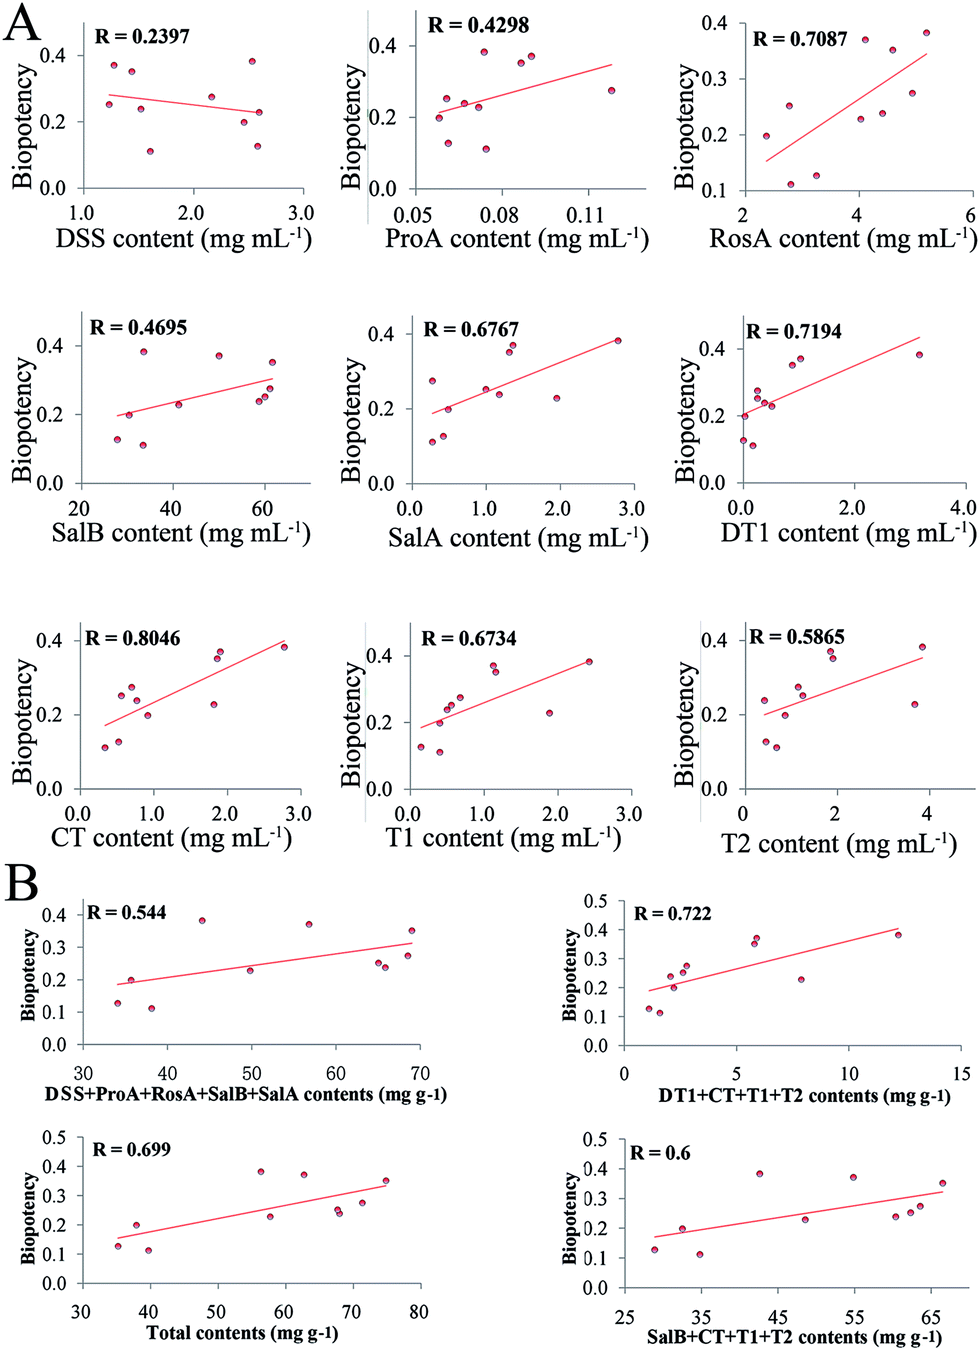 | ||
| Fig. 5 Correlation analysis results of the content of each constituent and biopotency (A). Correlation analysis results of the sum of contents and biopotency (B). | ||
Effect-constituents index
The structure of the nine standard constituents are shown in Fig. 6A. The inhibition rate on anti-platelet aggregation of the nine components was examined using rat PRP, then it was calculated into biopotency. As shown in Fig. 6B and C, CT inhibited platelet aggregation significantly and had a 50 times higher biopotency than the others. The biopotency of CT was around 1000 U mg−1, while the other constituents showed a biopotency of 4–20 U mg−1. After translating the biopotency of mass (U mg−1) into biopotency of molecular weight (U mmol−1), the biopotency results were DSS = 990, ProA = 661, RosA = 3556, SalA = 6570 SalB = 13![[thin space (1/6-em)]](https://www.rsc.org/images/entities/char_2009.gif) 596 and CT = 296350.
596 and CT = 296350.
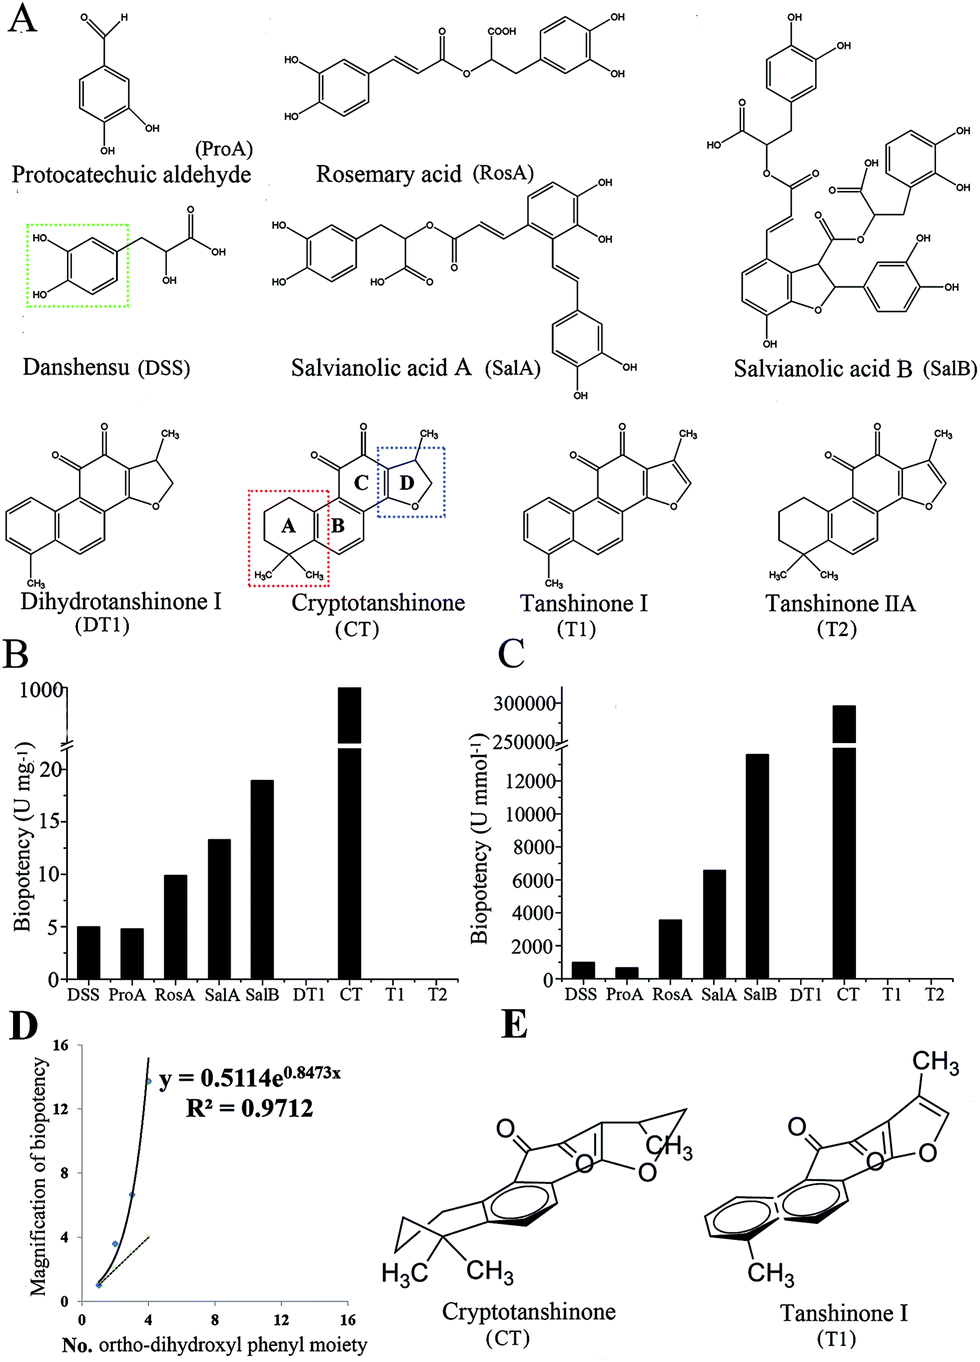 | ||
| Fig. 6 Structure of nine standard substances: protocatechuic aldehyde, (ProA); danshensu, (DSS); rosemary acid, (RosA); salvianolic acid A, (SalA); salvianolic acid B, (SalB); dihydrotanshinone I, (DT1), cryptotanshinone, (CT), tanshinone I, and (T1), tanshinone IIA, (T2) (A). Biopotency of nine standard constitutes (B) and (C). Relationship between biopotency and the number of ortho-dihydroxyl phenyl moiety (D). Space structure of cryptotanshinone (E). The green broken circle is the ortho-dihydroxyl phenyl moiety; the red broken circle is ring A and the blue one is ring D. | ||
Although the biopotency of the nine major constituents were measured and provided in Fig. 6, biopotency of the three constituents (DT1, T1, T2) were zero (Fig. 6B). Thus, we selected biopotency of 6 constituents (DSS, ProA, RosA, SalB, SalA, CT) to calculate ECI (Table 1). The ECI of SM was calculated by the formula in eqn (1). As shown in Table 1, the ECIs of SM were divided into 3 groups: the low group (S1, S2, S3) had ECI values of 1.0–1.6; the middle group (S5, S6, S7, S10) had ECI values of 1.7–2.7; and the high group (S4, S8, S9) had ECI values of 0.3–0.4. The ECI-based grades of SM were almost the same as the bio-based grades.
| Samples | Fi ×Ci | ECI | |||||
|---|---|---|---|---|---|---|---|
| DSS | ProA | RosA | SalB | SalA | CT | ||
| S1 | 0.0123 | 0.0003 | 0.0234 | 0.5739 | 0.0065 | 0.9147 | 1.5310 |
| S2 | 0.0129 | 0.0003 | 0.0320 | 0.5257 | 0.0056 | 0.5206 | 1.0971 |
| S3 | 0.0080 | 0.0004 | 0.0276 | 0.6316 | 0.0036 | 0.3367 | 1.0079 |
| S4 | 0.0126 | 0.0004 | 0.0511 | 0.6350 | 0.0369 | 2.7722 | 3.5083 |
| S5 | 0.0130 | 0.0003 | 0.0397 | 0.7791 | 0.0259 | 1.8137 | 2.6718 |
| S6 | 0.0108 | 0.0006 | 0.0486 | 1.1550 | 0.0036 | 0.6969 | 1.9156 |
| S7 | 0.0076 | 0.0003 | 0.0435 | 1.1107 | 0.0156 | 0.7689 | 1.9465 |
| S8 | 0.0064 | 0.0004 | 0.0405 | 0.9456 | 0.0181 | 1.9023 | 2.9133 |
| S9 | 0.0072 | 0.0004 | 0.0452 | 1.1656 | 0.0174 | 1.8595 | 3.0953 |
| S10 | 0.0062 | 0.0003 | 0.0273 | 1.1350 | 0.0132 | 0.5556 | 1.7375 |
Regression analysis
Results of the correlation analysis are shown in Fig. 7A. DSS had a negative correlation with the others, while RosA had a positive correlation with the others. Most constituents had a different correlation with biopotency, and the ECI had the highest correlation with biopotency. All of the methods were separated into four clusters. The ECI and biopotency were included in the first cluster, cluster 2 included liposoluble constituents (DT1, CT, T1, T2) and SalA, cluster 3 included most of water-soluble constituents, and cluster 4 contained only DSS.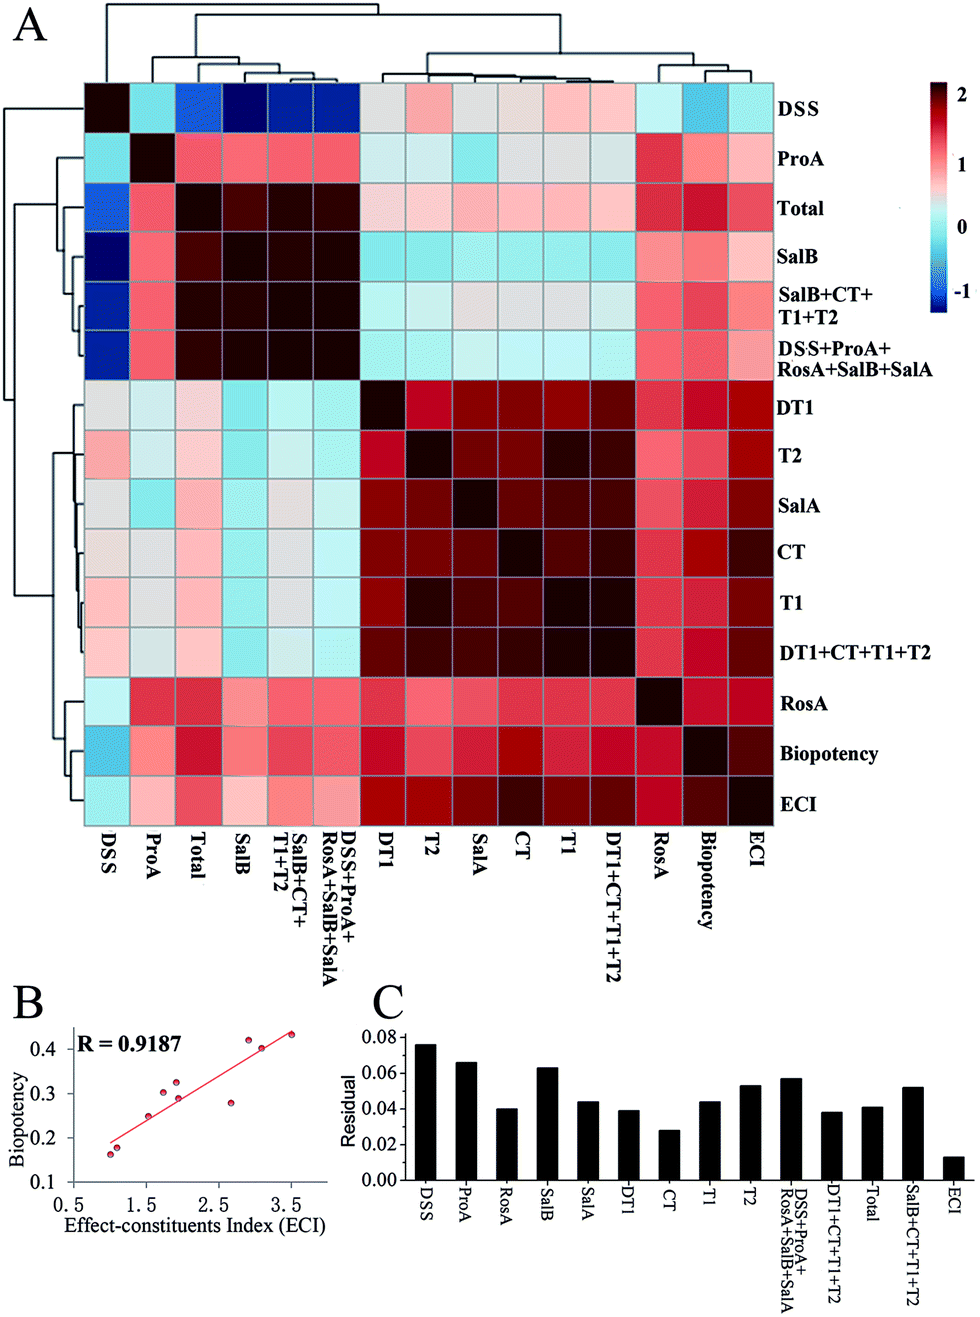 | ||
| Fig. 7 Results of the correlation analysis (A); correlation analysis results of ECI and biopotency (B); residual of contents and residual of the effect-constituents index (ECI) (C). | ||
Results of the correlation analysis between the ECI and biopotency are shown in Fig. 7B. The ECI of SM has a high correlation (R = 0.9187) with biopotency.
The results of the residual analysis for all the contents and the ECI of SM are shown in Fig. 7C. The residual of the ECI was less than the others. The highest residual value was more than 0.06, and CT had a residual value of 0.028. However, the ECI only had a 0.013 residual value.
Results of PLS-DA and PCA
The partial least squares discriminant analysis (PLS-DA) results for SM from different sources and the principal component analysis (PCA) results are shown in Fig. 8. The different sources of SM were divided into three grades by their biopotency as follows: grade 1 (S1, S2, S3); grade 2 (S5, S6, S7, S10); and grade 3 (S4, S8, S9). The three grades are separated from each other in Fig. 8A. The nine constituents (DSS, ProA, RosA, SalB, SalA, DT1, CT, T1, T2), the sum of water-soluble constituents (DSS + ProA + RosA + SalB + SalA), the sum of liposoluble constituents (DT1 + CT + T1 + T2) or the sum of nine constituents could not fully distinguish the bioactivity-based quality grade significantly. Grade 1 was distinguished via pharmacopeia methods (SalB + CT + T1 + T2), but the other two grades could not be distinguished by pharmacopeia methods. In contrast, all three grades of SM were separated significantly by the ECI method, as shown in Fig. 8B.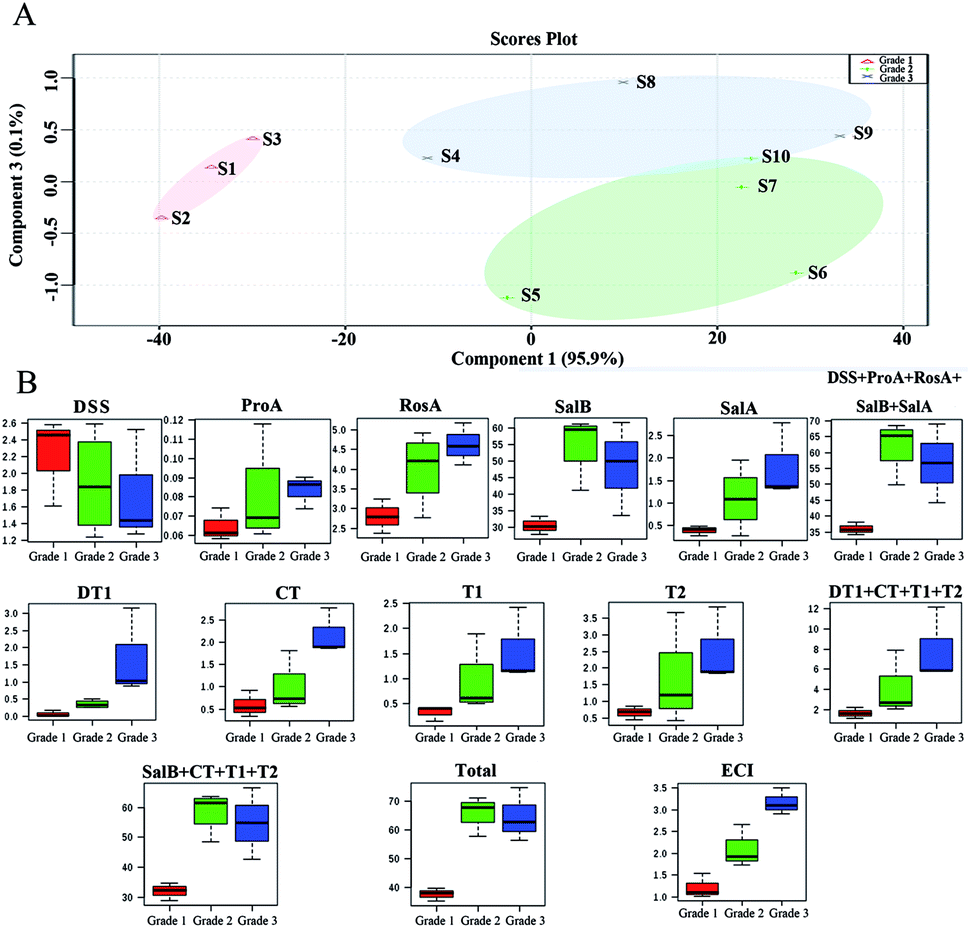 | ||
| Fig. 8 Partial Least Squares Discriminant Analysis (PLS-DA) results of Salvia miltiorrhiza Bge. from different sources (A). Principal Component Analysis (PCA) results of contents (B). | ||
Discussion
The chemical assay results showed great variation between SM samples in their contents (Ci) of the nine main constituents (Fig. 3). However, neither individual constituents (Fig. 5A) nor the sum of those constituents (Fig. 5B) had a high association with the biopotency of SM regarding antiplatelet aggregation activity. The quality grades of SM could be separated into three grades based on bioactivity (Fig. 4D). Under the supervision of the biopotency (grade 1, grade 2, grade 3), the SM could be divided into three groups using all the different chemical constituents (Fig. 8A). However, the four marker constituents of SM officially listed in the ChP could not distinguish bioactivity-based quality grade (Fig. 8B, SalB + CT + T1 + T2). In contrast, results showed that the bioactivity-based quality grade could be clearly distinguished via the ECI (Fig. 8B, ECI). Furthermore, the ECI had the highest correlation coefficient (r = 0.92, p < 0.001) with biopotency of SM and the lowest residual (Fig. 7). As noted above, the ECI could more accurately reflect bioactivity and potentially also clinical efficacy than the chemical assay of several marker compounds which have been considered as the active constituents of SM.In addition, the ECI could overcome the limitations of the biological assay by providing good operability, high precision and low cost. The ECI, which is closely related to bioactivity, which in turn may indicate correlation with clinical efficacy, can be implemented by chemical assays after initial bioassay data were collected. The ECI was formed with the sum of products of the biopotency weight (Fi) of the six constituents and their content (Ci). In the present study, two types of constituents, water-soluble and liposoluble chemicals, were evaluated for anti-platelet aggregation effects, and the results were calculated into biopotency (Fi). Notably, CT, a liposoluble constituent, inhibited platelet aggregation significantly and had more than 50–200 folds higher biopotency than the water-soluble constituents (DSS, ProA, RosA, SalB and SalA) (Fig. 6B). Despite the Ci value of CT was approximately 30–80 folds lower than that of the water-soluble constituent SalB (Table S1†), the biopotency (Fi, U mg−1) of CT was over 50 times higher than that of SalB (Fig. 6B). Thus, the active constituents, e.g. CT, with lower concentrations but higher activity levels would contribute considerably to the total bioactivity of SM as the other active constituents with high concentrations but lower activity, e.g. SalB, did. This result indicated the necessity of activity-based calibration for the low concentration but highly active constituents in quality evaluation of SM and the other TCMs or BDs.
The value of Fi is reflected by the differences of the structure–activity relationships of the constituents. There was an obvious relationship between the molecular structure and the biological activity of these constituents. For water-soluble constituents, the ortho-dihydroxyl phenyl moiety (indicated in Fig. 6A) seems important to the anti-platelet aggregation activity. ProA or DSS has one ortho-dihydroxyl phenyl moiety, so biopotency of them were rough equal. Moreover, RosA, SalA and SalB have two, three and four of such moieties, respectively; and the biopotency of these three compounds rises consequently. However, the biopotency of these compounds rise exponentially with the numbers of ortho-dihydroxyl phenyl moiety (Fig. 6D). The results indicated that the higher degree of polymerization has, the stronger biopotency exhibits. For liposoluble constituents, there might be two structural domains, ring A and ring D (Fig. 6A), of close relationship with activity. When ring A is an unsaturated ring, these compounds have no activity, such as DT1 and T1. Meanwhile, as ring D is an unsaturated ring, such as T1 and T2, these components have no activity else. In contrast, CT has both unsaturated ring A and unsaturated ring D, and CT has strong activity. In addition, three-dimensional structure of these compounds was influenced by the factor that whether ring A and ring D were unsaturated or not (Fig. 6E). Therefore, these three-dimensional structures may affect the efficacy of compound by altering combining ability of the compound with target protein. The activity of tanshinone compounds were influenced by three-dimensional structure, and those examples were also found in evaluation of angiogenesis activity. For instance, CT could inhibit angiogenesis in vitro but T2 had no effect.29 Therefore, the results of the structure–activity relationship provides insights into the development of antiplatelet agents with improved effect to prevent platelet hyperactivity-related cardiovascular diseases.
The ECI, establishment based on data from bioassays and chemical assays, was an effect-calibrated quantitative approach and was essentially equivalent to bioassays in predicting clinically relevant activities, and yet using chemical assays only as the routine tests. Thus, this method will have better applicability and can be easily adopted by other research groups, industry, and regulatory agencies for evaluation of herbal products. The ECI is suitable for TCMs or BDs with multiple known active constituents that are also researched for their bioactivities. In this paper, nine constituents were selected, because they were either active constituents on anti-platelet aggregation, or quality markers of SM. After the bioassay, six chemicals, DDS, ProA, RosA, SalB, SalA and CT, were proven to have antiplatelet aggregation activity. Thus, we chose biopotency of the six constituents as calibration factors for calculating ECI. But once new active constituents of anti-platelet aggregation are found in SM, biopotency of them would be used as new calibration factors. Although the ECI is suitable for evaluating TCMs or BDs with multiple active constituents, it also has limitations regarding constituents with multiple activities, which require several bioassays to predict their overall activities and interactions of the whole products. Therefore, it is necessary to characterize the interactive antagonistic or synergistic effects of constituents, as well as applying multiple bioassays to study the whole extracts of the herbs and herbal combinations, to decipher their clinical effects. Based on the activities of the multiple active constituents, and their interactive effects from biological and pharmacological assays, the TCM herbs, and herbal preparations should be further evaluated with updated or new calibration factors for improved quality control of those herbal products.
Experimental
Animals
Male SD rats (SPF grade, weighing 240–260 g) were supplied by the Laboratory Animal Center of the Military Medical Science Academy of the PLA (Permission No. SCXK-(A) 2012-0004). Animals were used for all the experiments and were kept under standard conditions, with food and water ad libitum and maintained in a 12 h/12 h light/dark cycle at 22 ± 1 °C. The study was approved by Experimental Animal Center of 302 Military Hospital, Beijing, China. The experiment complies with the animal welfare and ethics and it is approved. All procedures on animals and their care complied with the Guiding Principles for the Care and Use of Laboratory Animals of China and Institutional Animal Care and Use Committee of 302 hospital of PLA. And all procedures on animals and their care also complied with the ARRIVE guidelines produced by The National Centre for the Replacement, Refinement and Reduction of Animals in Research (NC3Rs). All efforts were made to minimize animal suffering and to reduce their number.Chemicals
Nine reference compounds salvianolic acid B (SalB) (lot 150720), salvianolic acid A (SalA) (lot 141228), sodium danshensu (DSS) (lot 150401), protocatechuic aldehyde (ProA) (lot 150422), rosemary acid (RosA) (lot 141129), tanshinone IIA (T2) (lot 140602), tanshinone I (T1) (lot 150202), dihydrotanshinone I (DT1) (lot 140920) and cryptotanshinone (CT) (lot 141022) were purchased from Chengdu Pufei De Biotech Co. Ltd, Chengdu, PR China. Their purities were all determined to be over 98% by HPLC-UV. Acetonitrile and formic acid of chromatographic grade and dimethyl sulfoxide (DMSO) were obtained from Sigma-Aldrich Co. (Pittsburg, PA, USA). Arachidonic acid (AA) was purchased from AggRAM; Helena Laboratories Inc, (Beaumont, TX, USA). Methanol of analytical grade was purchased from Beijing Chemical Factory (Beijing, China).Chemical analysis
An Agilent 1200 (Agilent, USA) liquid chromatograph equipped with a binary gradient pump, a 10 μL sample loop and a diode array detector (DAD) system was used. The separation was carried out on a Zorbax Extend C-18 column (1.7 μ, 3.5 mm × 150 mm). For the HPLC analysis, a 5 μL sample was injected into the column and eluted at room temperature with a constant flow rate of 0.6 mL min−1. For the mobile phase, 0.1% phosphoric acid in water (solvent A) and acetonitrile (solvent B) were used. The gradient program was optimized as the following: 0–20 min, 10–28% B; 20–25 min, 28–48% B, 25–40 min, 48–60% B; and 40–45 min, 60–10% B. The detection wavelength was set to 285 nm.Each standard was accurately weighed and dissolved in 70% methanol to produce a 0.2 mg mL−1 standard solution of RosA, SalB and a 0.05 mg mL−1 standard solution of DSS, ProA, SalA, DT1, CT, T1, and T2. Each solution was filtered through a 0.22 μm microporous membrane.
Dry powder (3 g) of SM was extracted with ultrasonication in 0.5 liters of 70% methanol. After 1 hour of extraction, the solution was filtered through filter paper (Whatmann filter 1), and the filtrate was filtered through a 0.22 μm microporous membrane before injection.
Clustered heatmaps were another very popular visualization tool in analyst. MetaboAnalyst 3.0 statistics software (MetaboAnalyst 3.0, Xia Lab@McGill University, Canada) was used to conduct the cluster heatmaps. The contents of the constituents were determined by HPLC using the chromatographic conditions. Based on the results, the contents in SM from different sources were selected for cluster analysis by the software MetaboAnalyst 3.0.
Anti-platelet aggregation biological assay
The reference standards were accurately weighed and dissolved in 0.5% DMSO diluting water to produce a 0.05 mg mL−1 standard stock solution. This stock solution was stored at 4 °C and diluted to the appropriate concentration as the standard solution on the day of the assay.The SM test sample was extracted with 70% methanol. The extraction solution was concentrated to one-hundredth of its original volume in a rotary evaporator at 50 °C as stock solution, and this extract was diluted to the appropriate concentration with physiological saline as the test solution. Before the assay, each solution was filtered through a 0.22 μm microporous membrane.
To improve the precision and reliability of the bioassay, the effects of the experimental conditions relating to the experimental inducing agent, standard, platelet concentration, and DMSO concentration were investigated. The standardized bioassay was established based on the optimized experimental conditions.
After a preliminary screen and after considering the maximal platelet aggregation ratio and the response potency of the constituents by induction of adenosine diphosphate, arachidonic acid, collagen, and thrombin, we chose arachidonic acid as the test inducing agent of platelet aggregation for this bioassay. In addition, standard, platelet concentration and the influence of DMSO concentration were also investigated.
A quadra-channel aggregometer (AggRAM, Corporation, Helena, USA) was used to measure platelet aggregation in vitro according to the turbidimetric method. Blood, anticoagulated with 3.8% sodium citrate (1:9 citrate/blood, v/v), was withdrawn from male SD rats (anesthetized by sodium pentobarbital) from the abdominal aorta. Platelet-rich plasma (PRP) was obtained by centrifugation at 800 rpm for 15 min at 25 °C. Platelet-poor plasma (PPP) was prepared from the precipitated fraction of PRP by centrifugation at 3000 rpm for 10 min at 25 °C. The PRP was adjusted to 4 × 10⁸ platelets per mL. Next, 175 μL of PRP was incubated at 37 °C for 1 min in a cuvette with 50 μL of test solution at a final concentration. 0.5% DMSO in distilled water was used as control. After incubation, platelet aggregation was induced by the addition of 25 μL of AA (250 μM). The maximum platelet aggregation rate was recorded within 5 min with continuous stirring at 37 °C. The light transmittance was calibrated with PPP. The percentage (%) of inhibition of platelet aggregation was calculated using eqn (2).
| I% = [(X − Y)/X] × 100% | (2) |
The nine standard constituents were accurately weighed and respectively dissolved in 0.5% DMSO diluting water to produce a maximal concentration of solution. Then this solution was diluted to the appropriate concentration with physiological saline as the test solution. Then, the inhibition rate of nine constituents was measured on anti-platelet aggregation, and the method was the same as test of SM which was previously mentioned. Finally, the biopotencies of the nine standard constituents were calculated by the inhibition rate of anti-platelet aggregation.
The bioassay statistical method was established according to the inhibition rate of test samples and the reference. Constituents and SM were test samples, and CT was defined as reference. The biopotency was calculated according to the qualitative response parallel method. In the drug biological inspection, the dose was converted to logarithm, and the inhibition rate was converted into a probability unit, which made the logarithm dose and the reaction function appear in parallel. According to this principle, in the experiment, the dose and the inhibition rate of the reference group and the test group were transformed, as shown in Fig. S1.† The biopotency of CT was defined as 1000 U mg−1 (296350 U mmol−1). The biopotency was calculated according to the qualitative response parallel method.33
Establishment of ECI
According to the determination method in Section 2.4, the nine constituents (DSS, ProA, RosA, SalB, SalA, DT1, CT, T1, T2) were determined to assess their effect differences. The biopotency was determined for the nine constituents.We estimated the effect calibration coefficient for each ingredient using the biopotency. The ECI computing formula is listed in eqn (2).
Regression analysis
The standardized bioassay potency was applied to measure the biopotency of 9 constituents and 10 samples of SM. The results were compared with those obtained from the chemical analysis. SPSS statistics software (SPSS for Windows 13.0, SPSS Inc., USA) was used for linear regression and used to conduct the residual of contents and ECI. Partial Least Squares Discriminant Analysis (PLS-DA) of SM and Principal Component Analysis (PCA) of the contents were analyzed with the software MetaboAnalyst 3.0.Conclusions
This work established an ECI for the quality evaluation of a TCM herb, SM. The ECI was an effect-calibrated quantitative approach and closely related to the bioactivity and likely also the clinical efficacy of the herb. We could distinguish the bioactivity-based quality grade via the ECI. Moreover, the ECI could avoid routine use of bioassays overcome some of their limitations, such as good operability, high precision and low cost. Therefore, our study indicates that this effect-calibrated quantitative approach is a useful tool to determine the quality to potentially serve as an indicator of clinical efficacy of TCMs or BDs, which typically consist multiple active constituents. The ECI for a particular product should be revised when additional active constituents are identified and more data from biological/pharmacological assays are becoming available. The same concept may be used to evaluate toxic herbs for their concentrations and relative toxicity levels.Acknowledgements
This study was supported by the National Natural Science Foundation of China (No. 81274026), the National Industry Science & Technology Foundation (201507002) and the Open Research Fund of the State Key Laboratory Breeding Base of Systematic Research, Development and Utilization of Chinese Medicinal Resources.Notes and references
- Y. Ren, P. Zhang, D. Yan, J. Wang, X. Du and X. Xiao, J. Pharm. Biomed. Anal., 2011, 56, 436–442 CrossRef CAS PubMed.
- Y. Xiong, X. H. Xiao, D. Yan, J. B. Wang and Y. H. yan, Chin. Herb. Med., 2014, 45, 1–7 CAS.
- A. Tungtrongchitr, N. Sookrung, W. Chaicumpa, N. Indrawattana, T. Meechan, U. Thavara, N. Visitsunthorn and C. Bunnag, Asian Pac. J. Allergy Immunol., 2012, 30, 231–238 Search PubMed.
- H. Z. Zhang, X. H. Xiao, J. B. Wang and J. Wang, Chin. Herb. Med., 2015, 46, 1571–1575 Search PubMed.
- V. Thangam Sudha, N. Arora, S. Sridhara, S. N. Gaur and B. P. Singh, Biologicals, 2007, 35, 131–137 CrossRef CAS PubMed.
- Y. Xiong, D. Yan, J.-b. Wang and X.-h. Xiao, Chin. Herb. Med., 2014, 256–264 CrossRef.
- X. H. Xiao, C. Jin, Z. Z. Zhao, P. G. Xiao and Y. Y. Wang, China J. Chin. Mater. Med., 2007, 32, 1377–1381 Search PubMed.
- F. D. A. U.S. Department of Health and Human Services, Botanical Drug Development Guidance for Industry (DRAFT GUIDANCE), 2015, pp. 1–49 Search PubMed.
- H. Li, J. Wang, Y. Qu and X. Xiao, China J. Chin. Mater. Med., 2012, 37, 302–304 Search PubMed.
- D. Yan, J. Y. Luo, Y. M. Han, C. Peng, X. P. Dong, S. L. Chen, L. G. Sun and X. H. Xiao, PLoS One, 2013, 8, e55854 CAS.
- L. Zhang, L. Ma, W. Feng, C. Zhang, F. Sheng, Y. Zhang, C. Xu, G. Dong, X. Dong, X. Xiao and D. Yan, Anal. Bioanal. Chem., 2014, 406, 5009–5018 CrossRef CAS PubMed.
- M. Alper, R. Meyer, C. Dekkers, D. Ezcurra, J. Schertz and E. Kelly, Reprod. Biol. Endocrinol., 2008, 6, 31 CrossRef PubMed.
- G. Y. Chen, Q. N. Wu, X. S. Wang, Q. L. Liang and X. X. He, China J. Chin. Mater. Med., 2012, 37, 2913–2916 Search PubMed.
- Y. Hou, X. Cao, L. Dong, L. Wang, B. Cheng, Q. Shi, X. Luo and G. Bai, J. Chromatogr. A, 2012, 1227, 203–209 CrossRef CAS PubMed.
- X. Feng, D. Yan, K. J. Zhao, J. Y. Luo, Y. S. Ren, W. J. Kong, Y. M. Han and X. H. Xiao, Pharm. Biol., 2011, 49, 348–353 CrossRef CAS PubMed.
- H. F. Li, J. B. Wang, Y. Qu, C. Jin, Q. Wang, X. H. Xiao and Z. L. Li, China J. Chin. Mater. Med., 2008, 33, 1309–1312 Search PubMed.
- Y. Zhao, J. Wang, X. Sun, L. Jia, J. Li, L. Shan, R. Li, H. Liu, R. Wang, X. Song, Y. Li and X. Xiao, Appl. Microbiol. Biotechnol., 2014, 98, 437–444 CrossRef CAS PubMed.
- Q. Zheng, Y. Zhao, J. Wang, T. Liu, B. Zhang, M. Gong, J. Li, H. Liu, B. Han, Y. Zhang, X. Song, Y. Li and X. Xiao, J. Ethnopharmacol., 2014, 153, 615–623 CrossRef CAS PubMed.
- J. B. Wang, C. Jin, H. F. Li, H. B. Li, X. H. Xiao and Y. Qu, Acta Pharmacol. Sin., 2009, 44, 500–505 Search PubMed.
- P. A. Behnisch, K. Hosoe and S. Sakai, Environ. Int., 2001, 27, 495–519 CrossRef CAS PubMed.
- X. Xiao, J. Wang, D. Yan and Y. Lv, China J. Chin. Mater. Med., 2012, 37, 1513–1516 Search PubMed.
- D. K. Zhang, R. S. Li, X. Han, C. Y. Li, Z. H. Zhao, H. Z. Zhang, M. Yang, J. B. Wang and X. H. Xiao, Front. Pharmacol., 2016, 7, 164 Search PubMed.
- Q. Yang, X. L. Zhang, X. Y. Li, W. K. Tang, J. X. Zhang, C. X. Fang and C. Y. Zheng, Anal. Chim. Acta, 2007, 589, 231–238 CrossRef CAS PubMed.
- S. Zeng, L. Wang, T. Chen, Y. Wang, H. Mo and H. Qu, Anal. Chim. Acta, 2012, 733, 38–47 CrossRef CAS PubMed.
- H. Y. Fan, F. H. Fu, M. Y. Yang, H. Xu, A. H. Zhang and K. Liu, Thromb. Res., 2010, 126, e17–22 CrossRef CAS PubMed.
- L. Liu, J. Li, Y. Zhang, S. Zhang, J. Ye, Z. Wen, J. Ding, S. P. Kunapuli, X. Luo and Z. Ding, Thromb. Res., 2014, 134, 866–876 CrossRef CAS PubMed.
- F. Maione, V. Cantone, M. G. Chini, V. De Feo, N. Mascolo and G. Bifulco, Fitoterapia, 2015, 100, 174–178 CrossRef CAS PubMed.
- D. Yang, X. Du, X. Liang, R. Han, Z. Liang, Y. Liu, F. Liu and J. Zhao, PLoS One, 2012, 7, e46797 CAS.
- J. M. Hur, J. S. Shim, H. J. Jung and H. J. Kwon, Exp. Mol. Med., 2005, 37, 133–137 CrossRef CAS PubMed.
- X. H. Ma, Y. Ma, J. F. Tang, Y. L. He, Y. C. Liu, X. J. Ma, Y. Shen, G. H. Cui, H. X. Lin, Q. X. Rong, J. Guo and L. Q. Huang, Molecules, 2015, 20, 16235–16254 CrossRef CAS PubMed.
- G. Kavadar, D. T. Demircioglu, H. Can, T. Y. Emre, E. Civelek and A. Senyigit, Journal of Back and Musculoskeletal Rehabilitation, 2016 DOI:10.3233/bmr-150470.
- J. Xia, I. V. Sinelnikov, B. Han and D. S. Wishart, Nucleic Acids Res., 2015, 43, W251–W257 CrossRef PubMed.
- H. j. Zhou, Drug Biological Inspection, People's Medical Publishing House, Beijing, 2005 Search PubMed.
Footnotes |
| † Electronic supplementary information (ESI) available: Tables S1–S3. See DOI: 10.1039/c6ra26281c |
| ‡ These authors contributed equally to this paper. |
| This journal is © The Royal Society of Chemistry 2017 |