DOI:
10.1039/C6RA25652J
(Paper)
RSC Adv., 2017,
7, 3170-3178
Broad near-ultraviolet and blue excitation band induced dazzling red emissions in Eu3+-activated Gd2MoO6 phosphors for white light-emitting diodes†
Received
22nd October 2016
, Accepted 30th November 2016
First published on 13th January 2017
Abstract
A series of Eu3+-activated Gd2MoO6 phosphors were synthesized via a citric acid-assisted sol–gel route. The photoluminescence (PL) excitation spectra revealed that the obtained phosphors can be efficiently pumped by both near-ultraviolet and blue light. Upon 360 and 463 nm excitation, bright emissions corresponding to the 5D0 → 7FJ (J = 0, 1, 2, 3 and 4) transitions of Eu3+ ions were detected. Meanwhile, the PL emission intensity was strongly dependent on the Eu3+ ion concentration and the optimal doping concentration for the Eu3+ ions in the Gd2MoO6 host lattice was determined to be around 15 mol%. The critical distance was around 11.47 Å and the mechanism for the concentration quenching was dominated by dipole–dipole interaction. Furthermore, the temperature-dependent PL emission spectra were recorded to test the thermal stability of the as-synthesized phosphors. Additionally, the Judd–Ofelt theory was employed to investigate the local crystal environment around the Eu3+ ions in the Eu3+-activated Gd2MoO6 phosphors. Finally, by integrating the resultant compounds with a blue light-emitting diode (LED) chip and yellow-emitting YAG:Ce3+ phosphors, a white light-emitting diode (WLED) device was fabricated which possessed a correlated color temperature of 5981 K, a color rendering index of 71.76 and a color coordinate of (0.321, 0.378). The results suggest that the Eu3+-activated Gd2MoO6 compounds are a promising red-emitting phosphor for WLEDs.
1. Introduction
Over the last few years, considerable efforts have been dedicated to the development of rare-earth (RE) ion-based luminescent materials because of their extensive practicability in various fields, including solar cells, optical bioimaging, noninvasive temperature sensors, latent fingerprinting, white light-emitting diodes (WLEDs) and solid-state lasers.1–9 In particular, with the growing awareness of environmental problems and energy consumption, the investigation of phosphor-converted WLEDs is increasing since their utilization can save around 50% of the energy for lighting and they are eco-friendly compared to conventional bulbs.10 At present, the combination of a blue LED chip and yellow-emitting YAG:Ce3+ phosphors is a commercially available strategy to generate white light. Unfortunately, due to the deficiency of red emission band in the luminescent spectrum, the white light usually suffers high correlated color temperature (CCT) and low color rendering index (CRI).11,12 To circumvent these shortages, another feasible approach was developed, that is, using the ultraviolet (UV) or near-UV (NUV) LED chip to pump the blending tricolor (blue, green and red) phosphors to produce the warm white light.13–16 Obviously, the red-emitting phosphor is an indispensable component for the generation of high-quality white light. Up to now, some red-emitting phosphors, such as Y2O2S:Eu3+,17 CaZnS:Eu2+,18 Sr2Si5N8:Eu2+,19 and Sr[LiAl3N4]:Eu2+,20 have been created for WLEDs. However, these compounds usually exhibit poor stability and need some rigorous reaction conditions. Meanwhile, these red-emitting phosphors can only be efficiently excited either by NUV or blue light. Considering these issues, searching for a novel red-emitting phosphor, which can be simultaneously pumped by NUV and blue light, with high stability, low cost and satisfactory luminescent performance is required.
Eu3+ ion is known to be a red-emitting activator as a result of its predominant 5D0 → 7F2 transition at around 610 nm.21,22 It was reported that bright red emissions originating from the 4f–4f transition of Eu3+ ions were achieved in some Eu3+-activated inorganic host lattices, such as tungstates, borates, phosphates, molybdates and vanadates.23–27 In comparison with other inorganics, the molybdate compounds acting as the luminescent host lattices have attracted much attention due to their merits of superior inherent luminescent properties and high stability. Furthermore, the molybdates with the octahedral MoO6 groups were found to have a strong broad charge transfer (CT) band (∼250–450 nm) corresponding to the O2− → Mo6+ transition.28,29 Consequently, the RE ions-based molybdate compounds are presumed to exhibit high-efficiency luminescent properties. Zou et al. demonstrated that the Eu3+-activated Bi2MoO6 phosphors could emit bright red emissions under UV light excitation.30 It was also revealed that the Ba2ZnMoO6:Eu3+ phosphors were suited for WLEDs as red-emitting phosphors.31 Although some splendid performances have been gained in the RE ions activated molybdate phosphors, to extend their vivid applications in solid-state lighting, more endeavors should be made to further improve their luminescent properties. In this work, the Gd2MoO6, which possesses a monoclinic scheelite structure with cell parameters of a = 15.67 Å, b = 11.16 Å, c = 5.419 Å and V = 947.65 Å3, was selected as the luminescent host lattice. The conventional sol–gel method was applied to prepare the Eu3+-activated Gd2MoO6 red-emitting phosphors. The phase structure, morphological performance, thermal stability and luminescent properties of the resultant products were systematically studied. It is worth noting that the synthesized phosphors can be efficiently excited by both NUV and blue light which was superior to those of the previously developed red-emitting phosphors. In addition, to identify the symmetry property of the dopants in the Gd2MoO6 host lattice, the Judd–Ofelt (J–O) theory was employed to estimate the J–O intensity parameters. Ultimately, a WLED device was fabricated by using the blue LED chip to pump the blended yellow-emitting YAG:Ce3+ and formed red-emitting phosphors to examine the potentiality of the Eu3+-activated Gd2MoO6 phosphors for WLEDs.
2. Experimental
2.1 Synthesis of Eu3+-activated Gd2MoO6 phosphors
A series of Gd2−2xMoO6:2xEu3+ (Gd2MoO6:2xEu3+; x = 0.01, 0.05, 0.10, 0.15, 0.20 and 0.30) were synthesized by a facile citrate-assisted sol–gel technique. The ammonium molybdate tetrahydrate ((NH4)6Mo7O24·4H2O; 99%), gadolinium nitrate hexahydrate (Gd(NO3)3·6H2O; 99.9%), citric acid (HOC(COOH)·(CH2COOH)2; 99.5%) and europium nitrate pentahydrate (Eu(NO3)3·5H2O; 99.9%) purchased from Sigma were used as the raw materials. The stoichiometric amounts of Gd(NO3)3·6H2O, (NH4)6Mo7O24·4H2O and Eu(NO3)3·5H2O were weighted and dissolved in 200 ml of de-ionized water. After stirring 20 min with the help of magnetic stirrer, a transparent solution was achieved. Subsequently, the citric acid acting as the chelating agent was added into the above solution (with the molar ratio of citric acid to metal ions of 2![[thin space (1/6-em)]](https://www.rsc.org/images/entities/char_2009.gif) :
:![[thin space (1/6-em)]](https://www.rsc.org/images/entities/char_2009.gif) 1). Then, the beaker was covered with a lid and heated at 80 °C for 3 h under strong mechanical agitation. After that, the lid of the beaker was removed and the solution was evaporated gradually to form a wet-gel. The wet-gel was shifted to the oven and dried at 120 °C for 12 h, and the xerogel was gained. Ultimately, the resultant xerogel was kept in the furnace and calcined at 1100 °C for 6 h with the heating ratio of 5 °C min−1 to obtain the Eu3+-activated Gd2MoO6 phosphors.
1). Then, the beaker was covered with a lid and heated at 80 °C for 3 h under strong mechanical agitation. After that, the lid of the beaker was removed and the solution was evaporated gradually to form a wet-gel. The wet-gel was shifted to the oven and dried at 120 °C for 12 h, and the xerogel was gained. Ultimately, the resultant xerogel was kept in the furnace and calcined at 1100 °C for 6 h with the heating ratio of 5 °C min−1 to obtain the Eu3+-activated Gd2MoO6 phosphors.
2.2 Characterization
The crystallinity and phase composition of the formed compounds were checked by a X-ray diffractometer (Bruker D8 Advance) with Cu Kα radiation. The microstructure and composition of the resultant samples were identified by the field-emission scanning electron microscope (FE-SEM) (LEO SUPRA 55, Carl Zeiss) and transmission electron microscope (TEM) (JEM-2100F, JEOL) equipped with an energy-dispersive X-ray spectroscopy (EDS). The spectrofluorometer (Scinco FluroMate FS-2) equipped with a xenon lamp as the light source was applied to examine the luminescent properties of the as-prepared phosphors. The temperature-dependent PL emission spectra of the synthesized products were recorded by the FS-2 system to explore their thermal stability and the temperature from 303 to 483 K was controlled by a temperature controlled stage (NOVA ST540). Under different excitation wavelengths, the absolute quantum efficiency of the studied samples was measured by a fluorescence spectrophotometer equipped with integrating sphere (Hamamatsu Photonics C9920-02). The electroluminescence (EL) spectra of the fabricated LED devices were measured by a multi-channel spectroradiometer (OL 770) under a forward bias current of 50 mA.
3. Results and discussion
3.1 Phase identification and morphology
The phase composition of the Eu3+-activated Gd2MoO6 phosphors which were synthesized by a facile citric acid assisted sol–gel method was analyzed by X-ray diffraction (XRD). From the XRD patterns, as displayed in Fig. 1, it is clear that all the diffraction peaks of the studied samples were well indexed to the standard Gd2MoO6 with a space group of I2/a(15) (JCPDS# 24-0423). The result confirmed that all the compounds possessed pure monoclinic phase and the introduction of Eu3+ ions into the Gd2MoO6 host lattice had little impact on the crystal structure. Considering the ionic radius and charge balance of the existing cations, the dopants (Eu3+) were preferred to occupy the sites of Gd3+ ions in Gd2MoO6. On the basis of previous reports, the radius percentage difference (Dr) between the dopants and the possible substituted ions is defined as:3,11| |
 | (1) |
where Rs(CN) and Rd(CN) stand for the ionic radii of substituted ions and dopants, respectively. Generally, to form a new solid solution, the Dr value should be below 15%.3,32 In present work, the ionic radii for the Gd3+ and Eu3+ ions were around 1.053 and 1.066 Å, respectively, when the coordinate number (CN) was 8. Thus, the Dr value for Eu3+/Gd3+ was estimated to be about −1.23%. Since the calculated Dr value was much smaller than 15%, the Gd3+ ions could be easily taken place by Eu3+ ions without inducing any distinct changes to the structure of the Gd2MoO6 host lattice.
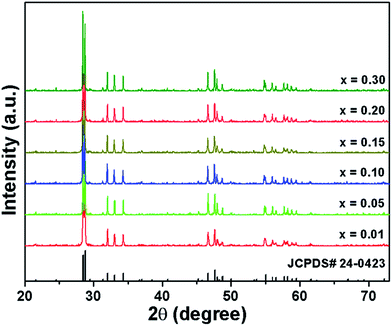 |
| | Fig. 1 XRD patterns of Gd2MoO6:2xEu3+ (x = 0.01, 0.05, 0.10, 0.15, 0.20 and 0.30) phosphors calcined at 1100 °C. | |
To further confirm the Eu3+ ions preferred to inhabit the sites of Gd3+ ions in Gd2MoO6, the Rietveld refinement based on the XRD pattern of the Gd2MoO6:0.30Eu3+ phosphors was performed with the help of General Structure Analysis System and the corresponding fitting pattern is displayed in Fig. 2. The final refined lattice parameters as well as the reliability factors are summarized in Table S1.† As presented in Table S1,† the reliability factors were Rp = 5.31%, Rwp = 4.22% and χ2 = 1.47. Meanwhile, the lattice constants of Gd2MoO6:0.30Eu3+ phosphors were found to be a = 15.68645 Å, b = 11.18177 Å, c = 5.41992 Å and V = 950.55 Å3 (see Table S1†). Note that, these calculated cell constants were slightly larger than those of pure Gd2MoO6 (a = 15.67 Å, b = 11.16 Å, c = 5.419 Å and V = 947.65 Å3; JCPDS# 24-0423), further revealing that the Eu3+ ions can be doped into the Gd2MoO6 host lattice by replacing the Gd3+ ions and did not cause any obvious variations to the host crystal structure matched well with the above discussion. By means of the Diamond software, the unit cell structure of Gd2MoO6 was modeled, as illustrated in the inset of Fig. 2. It is evident that the Gd3+ ions were coordinated by eight oxygen atoms while the Mo6+ ions were surrounded by four oxygen atoms.
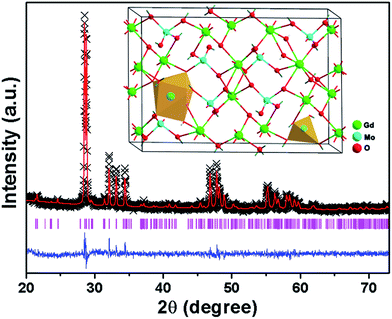 |
| | Fig. 2 Rietveld XRD refinement for the Gd2MoO6:0.30Eu3+ phosphors. Inset shows the unit cell structure of the Gd2MoO6. | |
The crystallinity and microstructure features of Eu3+-activated Gd2MoO6 phosphors were characterized by FE-SEM and TEM. Fig. 3 depicts the representative FE-SEM and TEM images of the Gd2MoO6:0.30Eu3+ phosphors. Both the FE-SEM and TEM image revealed that the synthesized compounds were made up of irregular particles with the size ranging from approximately 300 to 600 nm (see Fig. 3(a) and (b)). As demonstrated in Fig. 3(c), the high-resolution TEM (HR-TEM) image showed distinct lattice fringes with the d-spacing of around 3.08 Å which was in good agreement with the distance of (321) plane for Gd2MoO6. The selected area electron diffraction (SAED) pattern, as shown in Fig. 3(d), exhibited bright dot patterns, illustrating that the single nanocrystalline nature of the obtained particles. The EDS spectrum, which was taken from the TEM image (Fig. 4(a)), was employed to detect the element constitution of the Gd2MoO6:0.30Eu3+ phosphors, as depicted in Fig. 4(b). The observed peaks of Gd, Mo, O and Eu in the EDS spectrum further confirmed the formation of Eu3+-activated Gd2MoO6 phosphors. Meanwhile, the elemental mapping result also indicated that the Gd, Mo, O and Eu were equally distributed in the range of the nanoparticles (see Fig. 4(c)–(f)).
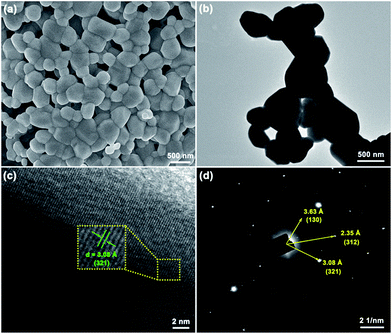 |
| | Fig. 3 (a) FE-SEM image, (b) TEM image, (c) HR-TEM image and (d) SAED pattern of the Gd2MoO6:0.30Eu3+ phosphor. | |
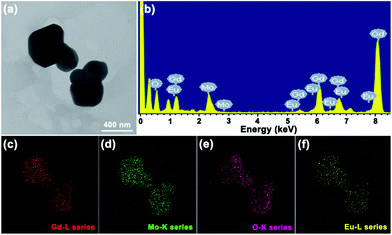 |
| | Fig. 4 (a) TEM image, (b) EDS spectrum and (c, d, e and f) elemental mappings of the Gd2MoO6:0.30Eu3+ phosphors. | |
3.2 Room-temperature luminescent behavior
The typical PL excitation (PLE) spectrum of the Gd2MoO6:0.30Eu3+ phosphors, which was recorded at the dominant red emission wavelength (610 nm) of Eu3+ ions, is shown in Fig. 5(a). As described in Fig. 5(a), the PLE spectrum contained a broad band and a sharp peak. The broad band of 225–450 nm centered at around 360 nm is called as charge transfer (CT) band which is ascribed to the overlap transitions of O2− → Mo6+ and O2− → Eu3+.33,34 The narrow excitation band located at approximately 463 nm occurred from the 7F0 → 5D2 transition of Eu3+ ions.35 With the increase of Eu3+ ion concentration, the PLE spectra did not show a significant change, while the intensity of the excitation peaks was increased and its maximum value was achieved when the doping concentration was 15 mol% (see Fig. S1†). These results clearly indicated that the as-prepared phosphors can be simultaneously excited by both NUV and blue light. Upon 360 nm excitation, the PL emission spectrum of the Gd2MoO6:0.30Eu3+ phosphors was measured as presented in Fig. 5(b). Clearly, the PL emission spectrum was dominated by a strong red emission with a center of about 610 nm due to the 5D0 → 7F2 transition.36 Meanwhile, there also existed some relatively weak excitation peaks at 577, 589, 655 and 705 nm which are attributed to the 4f–4f transitions of Eu3+ ions from the excited state of 5D0 to 7F0, 7F1, 7F3 and 7F4, respectively.37 On the basis of previous works,38,39 one knows that the Eu3+-activated luminescent materials usually exhibit two characteristic emissions in the yellow (5D0 → 7F1) and red (5D0 → 7F2) regions. Especially, according to the magnetic dipole (MD) transition rule (ΔJ = 0, ±1), the 5D0 → 7F1 (ΔJ = 1) transition belongs to the MD transition, whereas the 5D0 → 7F2 transition pertains to the hypersensitive electric dipole (ED) transition which is sensitive to its surrounding crystal field.40,41 Normally, the red emission (5D0 → 7F2) takes the domination in the PL emission spectrum when the Eu3+ ions occupy the sites without inversion centers. In present work, in comparison with that of the 5D0 → 7F1 transition, the emission intensity of the 5D0 → 7F2 transition was much stronger (see Fig. 5(b)), demonstrating that the Eu3+ ions occupied the low symmetry sites with non-inversion centers in Gd2MoO6 host lattice. Meanwhile, under the excitation of 463 nm, the Gd2MoO6:0.30Eu3+ phosphors exhibited the characteristic emissions of Eu3+ ions and the PL emission spectral profile was the same as that under the excitation of 360 nm, as displayed in Fig. 5(b) and (c), further revealing that the Eu3+-activated Gd2MoO6 phosphors could be efficiently pumped by both the NUV and blue light, which coincided well with previous discussion. Fig. 6 illustrates the energy level scheme of Eu3+ ions in Gd2MoO6 host lattice to expound the involved luminescent processes.
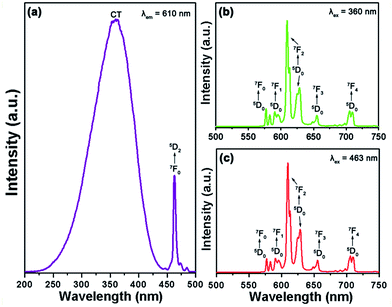 |
| | Fig. 5 (a) PLE spectrum of the Gd2MoO6:0.30Eu3+ phosphors monitored at 610 nm. (b and c) PL emission spectra of the Gd2MoO6:0.30Eu3+ phosphors excited at 360 and 463 nm, respectively. | |
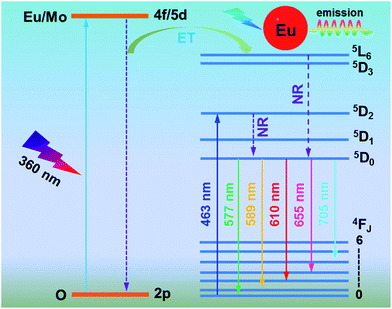 |
| | Fig. 6 Energy level diagram of Eu3+ ions along with the possible luminescent routes in Eu3+-activated Gd2MoO6 phosphors. | |
As we know, the doping concentration has an obvious influence on the PL emission intensity of the RE ions activated luminescent materials. For the sake of achieving the optimum doping concentration of Eu3+ ions in Gd2MoO6, a series of Gd2MoO6:2xEu3+ phosphors were fabricated via a conventional sol–gel method and their luminescent properties were examined. The PL emission spectra of Gd2MoO6:2xEu3+ phosphors, which were excited at 360 and 463 nm, are shown in Fig. 7 and S2,† respectively. It is evident that the featured emissions of Eu3+ ions were observed in all the obtained compounds and the PL emission spectral profiles were almost the same, while the PL emission intensity varied with raising the Eu3+ ion concentration (see Fig. 7 and S2†). As demonstrated in the inset of Fig. 7, the PL emission intensity initially increased with increasing the Eu3+ ion concentration, and then showed a decrement tendency with further raising the activator concentration due to the concentration quenching effect. In order to figure out the involved concentration quenching mechanism, the critical distance (Rc) of Eu3+ ions in Gd2MoO6 host lattice was estimated by utilizing the Blasse's equation:42
| |
 | (2) |
where
V stands for the volume of the unit cell,
xc is the critical concentration and
Z is the number of cation sites in the unit cell. In this work, the values of
V,
xc and
Z were 947.65, 0.15 and 8, respectively. Thus, the
Rc value was calculated to be around 11.47 Å. As for the nonradiative (NR) ET, which is the main cause of the concentration quenching effect, among the activators, it is usually triggered either by exchange interaction or electric multipole interaction. In general, when the critical distance is smaller than 5 Å, the NR ET is dominated by exchange interaction, otherwise the electric multipole interaction prevails.
43,44 Since the calculated
Rc value was much larger than 5 Å, the electric multipole interaction would contribute to the NR ET. According to Dexter's report, the PL emission intensity (
I) per doping concentration (
x) can be expressed as:
45| |
log(I/x) = c − (θ/3)log![[thin space (1/6-em)]](https://www.rsc.org/images/entities/char_2009.gif) x, x,
| (3) |
where
c is a constant and
θ = 6, 8 and 10 stands for dipole–dipole interaction, dipole–quadrupole interaction and quadrupole–quadrupole interaction, respectively. As depicted in Fig. S3,
† the relation between log(
I/
x) and log
![[thin space (1/6-em)]](https://www.rsc.org/images/entities/char_2009.gif) x
x was linear and the experimental data were fitted with slopes of −1.71 and −1.68 when the excitation wavelength was 360 and 463 nm, respectively. As a consequence, the
θ values were determined to be 5.13 and 5.04 which were close to 6, indicating that the dipole–dipole interaction dominated the NR ET among the Eu
3+ ions in Gd
2MoO
6:2
xEu
3+ phosphors.
 |
| | Fig. 7 PL emission spectra of Gd2MoO6:2xEu3+ phosphors upon the excitation of 360 nm. Inset presents the PL emission intensity as a function of Eu3+ ion concentration excited at 360 and 463 nm. | |
To determine the suitable synthetic method for the studied samples, the Gd2MoO6:0.30Eu3+ phosphors were also prepared by the solid-state reaction method. The PL emission spectra of the Gd2MoO6:0.30Eu3+ phosphors synthesized by sol–gel and solid-stated reaction routes were illustrated in Fig. S4.† As shown in Fig. S4,† the PL emission intensity of the samples prepared by sol–gel method was much higher in comparison to that of the samples prepared by solid-state reaction method, suggesting that the sol–gel method is more suitable for synthesizing the Eu3+-activated Gd2MoO6 phosphors.
3.3 Decay curve and CIE coordinate
The PL decay curves of Eu3+-activated Gd2MoO6 phosphors with the optimum doping concentration were examined. As shown in Fig. 8, the decay curves were perfectly fitted by a single exponential decay mode:| |
I = A![[thin space (1/6-em)]](https://www.rsc.org/images/entities/char_2009.gif) exp(−t/τ) + I0, exp(−t/τ) + I0,
| (4) |
where I0 and I are the emission intensities at time t = 0 and t, respectively, and A is the constant. According to the fitting result, the lifetimes were demonstrated to be about 581 and 537 μs when excited at 360 and 463 nm with the monitoring wavelength of 610 nm, respectively. Based on the PL emission spectra, the Commission International de I'Eclairage (CIE) chromaticity coordinates of the Gd2MoO6:0.30Eu3+ phosphors were calculated as shown in Fig. 9. Under the excitation of 360 and 463 nm, the color coordinates of the Gd2MoO6:0.30Eu3+ phosphors were (0.650, 0.350) and (0.653, 0.347), respectively. As depicted in Fig. 9, the color coordinates of the Gd2MoO6:0.30Eu3+ phosphors approached that of the standard red light (0.670, 0.330). Meanwhile, the calculated CIE coordinates were also comparable with that of the commercial red-emitting phosphor of Y2O2S:Eu3+ (0.622, 0.351).46 Furthermore, to better understand the red emission of the Eu3+-activated Gd2MoO6 phosphors, the color purity was calculated according to the following expression:26,47| |
 | (5) |
where (x, y) denotes the CIE coordinate of the synthesized compounds, (xi, yi) presents the color coordinate of the white illumination and the (xd, yd) is the color coordinate of the dominant wavelength. Here, (xd, yd) = (0.666, 0.334) at the dominant wavelength of 610 nm and (xi, yi) = (0.310, 0.316). By mean of eqn (5) and the calculated CIE chromaticity coordinates, the color purity for the red emission of the Gd2MoO6:0.30Eu3+ phosphors was determined to be around 95.8 and 96.6%, respectively, when excited at 360 and 463 nm. These results demonstrated that the Eu3+-activated Gd2MoO6 phosphors, which exhibited bright red emission with good CIE chromaticity coordinate and high color purity, may have promising applications in solid-state lighting and display devices as red-emitting phosphors.
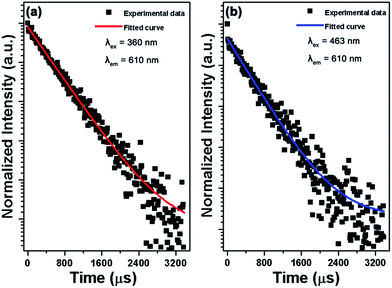 |
| | Fig. 8 PL decay curves of the Gd2MoO6:0.30Eu3+ phosphors under (a) 360 nm and (b) 463 nm excitations. | |
 |
| | Fig. 9 CIE chromaticity diagram of the Gd2MoO6:0.30Eu3+ phosphors, commercial Y2O2S:Eu3+ phosphor and NTSC standard red light. | |
3.4 Judd–Ofelt analysis and optical transition parameters
As aforementioned, the Eu3+ ions occupied the low symmetry sites with noninversion center in Gd2MoO6 host lattice. To get deeper insight into the local structure environment surrounding the Eu3+ ions in Gd2MoO6 host lattice, the J–O theory was employed to calculate the J–O intensity parameters, that is, Ω2 and Ω4. On the basis of J–O theory, the ED spontaneous emission possibility from the initial J state to final J′ state can be expressed as:48,49| |
 | (6) |
where h is the Plank's coefficient, λED is the center wavelength of ED transition, e is the elementary charge, n is the refractive index and 〈ψJ∥Uλ∥ψ′J′〉 refers to the reduced matrix element for the J → J′ transition. In comparison, the MD spontaneous emission probability from the initial J state to final J′ state can be defined as:| |
 | (7) |
In this equation, λMD is denoted as the center wavelength of MD transition. Smd is the MD line strength, which is independent of the luminescent host lattice, and its value is around 7.83 × 10−42.50 As is known, the 5D0 → 7F1 transition belongs to the MD transition, while the 5D0 → 7FJ (J = 2, 4) transitions are ED transitions.51 Therefore, the PL emission intensity ratio (R) between the ED and MD transitions can be expressed as:| |
 | (8) |
Combined with eqn (6)–(8), we obtained that| |
 | (9) |
For the value of  , it can be deduced from the integrated area of PL emission spectrum. Since the 5D0 → 7F6 transition was not observed in the PL emission spectrum, the Ω6 can not be evaluated. Meanwhile, the reduced matrix elements are 〈5D0∥U2∥7F2〉2 = 0.0032 and 〈5D0∥U4∥7F4〉2 = 0.0023.52 As a consequence, the J–O intensity parameters of Ω2 and Ω4 for the Gd2MoO6:0.30Eu3+ phosphors were calculated to be around 10.18 × 10⁻²⁰ and 2.82 × 10⁻²⁰ cm2, respectively. Note that, the Ω2 is sensitive to the crystal filed and the large Ω2 value means low symmetry of the sites of RE ions, while the Ω4 is related to the bulk performance and the rigidity of the luminescent host lattices.53 Since the calculated Ω2 value was much larger than the Ω4 value, it is rational to consider that the ED transition (5D0 → 7F2) took the domination and the Eu3+ ions were located at the low symmetry sites in the Gd2MoO6 host lattice, which were in good agreement with the result obtained from the PL emission spectra.
3.5 Thermal stability of the Eu3+-activated Gd2MoO6 phosphors
The thermal stability performance of the RE ions activated phosphors is an indispensable parameter for their practical applications in solid-state lighting. The temperature-dependent PL emission spectra for the Gd2MoO6:0.30Eu3+ phosphors in the temperature range of 303–483 K were recorded. As demonstrated in Fig. 10, the temperature had little effect on the position of the emission peaks, while the PL emission intensity decreased sharply with the increase of temperature. It is noticeable that the PL emission intensities decreased by 68.9 and 46.9% at 423 K in comparison with that of at room temperature (303 K) when excited at 360 and 463 nm, respectively, as shown in the insets of Fig. 10(a) and (b). The thermal quenching caused by the thermal activation via the crossing point between the ground and excited states can be responsible for the fastly deceased PL emission intensity. To determine the activation energy (ΔE), the following expression is given:54,55| |
 | (10) |
where the I0 stands for the initial PL emission intensity, I is the PL emission intensity at temperature T, A is the constant and k is the Boltzmann constant (8.626 × 10⁻⁵ eV K−1). The graphs of ln(I0/I − 1) versus 1/kT were plotted and are depicted in Fig. S5.† It is evident that the experimental data can be linearly fitted with slopes of around −0.417 and −0.383. As a result, the activation energy was determined to be approximately 0.417 and 0.383 eV, respectively, when excited at 360 and 463 nm. This high activation energy suggested that the obtained phosphors possessed good thermal stability and were suitable for WLED applications.
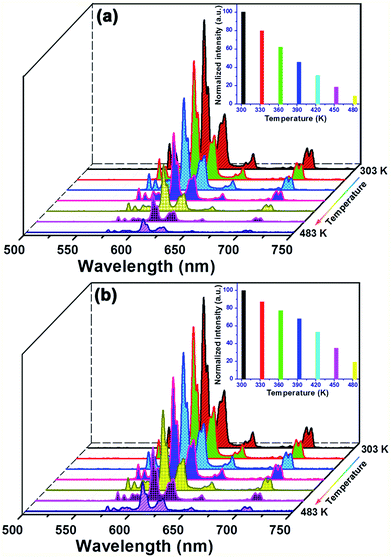 |
| | Fig. 10 Temperature-dependent PL emission spectra of the Gd2MoO6:0.30Eu3+ phosphors under different excitation wavelengths of (a) 360 nm and (b) 463 nm. Inset presents the normalized PL emission intensity as a function of temperature. | |
3.6 Quantum efficiency and electroluminescence behavior of fabricated WLED device
Apart from the thermal stability, the quantum efficiency is another vital factor to identify the feasibility of the resultant products for the solid-state lighting applications. The absolute quantum efficiency of the Gd2MoO6:0.30Eu3+ phosphors as a function of excitation wavelength was measured. For the Gd2MoO6:0.30Eu3+ phosphors, the quantum efficiency was determined to be 26.5 and 47.5% at the excitation wavelengths of 360 and 463 nm, respectively. Clearly, the achieved quantum efficiencies were comparable to those of previous reported red-emitting phosphors, such as Y2O2S:Eu3+ and (Ka0.5Na0.5)NbO3:Eu3+/Bi3+,54,56 further demonstrating that the Eu3+-activated Gd2MoO6 phosphors were promising candidates for WLEDs. As a proof of the above discussion, a WLED device was fabricated by coating the yellow-emitting YAG:Ce3+ and red-emitting Gd2MoO6:0.30Eu3+ phosphors on the InGaN blue (∼456 nm) chip. Meanwhile, for reference, another WLED device, which was made up of InGaN blue chip and yellow-emitting YAG:Ce3+ phosphors, was also prepared. The EL spectra of the fabricated WLED devices, which were driven by the forward bias current of 50 mA, were recorded. As disclosed in Fig. S6,† only the emission bands of the blue LED chip and YAG:Ce3+ phosphors were detected. However, with the introduction of the resultant red-emitting phosphors, the EL spectrum of the fabricated WLED device could be divided into three parts, namely, the blue emission peak centered at around 456 nm was assigned to the luminescence of blue LED chip, the broad yellow emission band was attributed to the 5d → 4f transition of Ce3+ ions in YAG:Ce3+ phosphors and the sharp peaks located in the red region belonged to the characteristic emissions of Eu3+ ions in the Gd2MoO6:0.30Eu3+ phosphors (see Fig. 11). Note that, after adding the Gd2MoO6:0.30Eu3+ red-emitting phosphors, the CIR value increased from 70.66 to 71.76, the CCT value decreased from 6124 to 5918 K, and the CIE chromaticity coordinates varied from (0.316, 0.376) to (0.321, 0.378), as depicted in Fig. 11 and S6.† In addition, a red-emitting LED device was also prepared by integrating an InGaN NUV chip with the center wavelength of 375 nm and red-emitting Gd2MoO6:0.30Eu3+ phosphors. Under forward bias current of 50 mA, the fabricated LED device emitted bright red (0.618, 0.366) light (see the inset of Fig. S7†) and the corresponding EL spectrum consisted of several narrow emission peaks at approximately 577, 589, 610, 655 and 705 nm which were assigned to the featured emissions of Eu3+ ions, as presented in Fig. S7.†
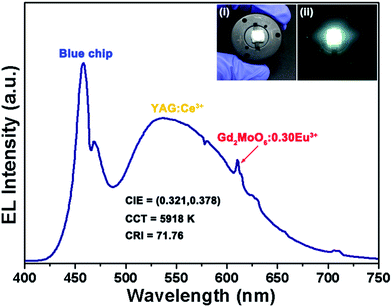 |
| | Fig. 11 EL spectrum of the fabricated WLED device by coating the InGaN blue LED chip with commercial yellow-emitting YAG:Ce3+ and Gd2MoO6:0.30Eu3+ red-emitting phosphors. Inset illustrates the digital images of the fabricated WLED device with and without power input. | |
4. Conclusions
In summary, the Gd2MoO6:2xEu3+ red-emitting phosphors were successfully synthesized and their luminescent properties were analyzed in detail. Under NUV and blue light excitations, the formed compounds exhibited the featured emissions of Eu3+ ions and the red emission located at approximately 610 nm (5D0 → 7F2) was dominated in the luminescent spectrum. A gradual enhancement in the PL emission intensity was achieved with the addition of Eu3+ ion concentration, exhibiting its maximum value when x = 0.15. The critical distance was estimated to be about 11.47 Å and the dipole–dipole interaction should be responsible for the concentration quenching of Eu3+ ions in Gd2MoO6:2xEu3+ phosphors. By means of the J–O theory, the optical transition parameter (Ω2 and Ω4) values were increased and the larger Ω2 value indicated that the Eu3+ ions occupied the low symmetry sites in the Gd2MoO6 host lattice. Additionally, a WLED device with CCT = 5918 K, CIR = 71.76 and CIE = (0.321, 0.378) was fabricated by integrating the blue LED chip with yellow-emitting YAG:Ce3+ and red-emitting Gd2MoO6:0.30Eu3+ phosphors. From these results, the Eu3+-activated Gd2MoO6 phosphors are expected to be very promising in NUV LED-based WLED and blue LED-based WLED applications as red-emitting phosphors.
Acknowledgements
This work was supported by the National Research Foundation of Korea (NRF) Grant funded by the Korea government (MSIP) (No. 2015R1A5A1037656).
Notes and references
- J. Shen, Z. Li, R. Cheng, Q. Luo, Y. Chen, X. Chen, Z. Sun and S. Huang, ACS Appl. Mater. Interfaces, 2014, 6, 17454–17462 CAS.
- Z. Yi, X. Li, Z. Xue, X. Liang, W. Lu, H. Peng, H. Liu, S. Zeng and J. Hao, Adv. Funct. Mater., 2015, 25, 7119–7129 CrossRef CAS.
- P. Du, L. Luo, H. Park and J. S. Yu, Chem. Eng. J., 2016, 306, 840–848 CrossRef CAS.
- M. Wang, RSC Adv., 2016, 6, 36264–36268 RSC.
- X. Huang, Nat. Photonics, 2014, 8, 748–749 CrossRef CAS.
- H. Yang, J. Zhang, X. Qin, D. Luo, J. Ma, D. Tang, H. Chen, D. Shen and Q. Zhang, J. Am. Ceram. Soc., 2012, 95, 52–55 CrossRef CAS.
- W. Song, W. Di and W. Qin, Dalton Trans., 2016, 45, 7443–7449 RSC.
- X. Wang, Q. Liu, Y. Bu, C. Liu, T. Liu and X. Yan, RSC Adv., 2015, 5, 86219–86236 RSC.
- X. Huang, J. Alloys Compd., 2017, 690, 356–359 CrossRef CAS.
- C. C. Lin and R. Liu, J. Phys. Chem. Lett., 2011, 2, 1268–1277 CrossRef CAS PubMed.
- K. Li, H. Lian, M. Shang and J. Lin, Dalton Trans., 2015, 44, 20542–20550 RSC.
- Y. Liu, Y. Liu, G. Liu, X. Dong and J. Wang, RSC Adv., 2015, 5, 97995–98003 RSC.
- P. Du, L. K. Bharat and J. S. Yu, J. Alloys Compd., 2015, 633, 37–41 CrossRef CAS.
- Z. Xia, Z. Xu, M. Chen and Q. Liu, Dalton Trans., 2016, 46, 11214–11232 RSC.
- Z. Xia and Q. Liu, Prog. Mater. Sci., 2016, 84, 59–117 CrossRef CAS.
- M. Xin, D. Tu, H. Zhu, W. Luo, Z. Liu, P. Huang, R. Li, Y. Cao and X. Chen, J. Mater. Chem. C, 2015, 3, 7286–7293 RSC.
- J. Dhanaraj, R. Jagannathan and D. C. Trivedi, J. Mater. Chem., 2003, 13, 1778–1782 RSC.
- T. Kuo, W. Liu and T. Chen, Opt. Express, 2010, 18, 8187–8192 CrossRef CAS PubMed.
- S. E. Brinkley, N. Pfaff, K. A. Denault, Z. Zhang, H. T. Hintzen, R. Seshadri, S. Nakamura and S. P. DenBaars, Appl. Phys. Lett., 2011, 99, 241106 CrossRef.
- P. Pust, V. Weiler, C. Hecht, A. Tücks, A. S. Wochnik, A. Henβ, D. Wiechert, C. Scheu, P. J. Schmidt and W. Schnick, Nat. Mater., 2014, 13, 891–896 CrossRef CAS PubMed.
- J. Fu, R. Pang, L. Jiang, Y. Jia, W. Sun, S. Zhang and C. Li, Dalton Trans., 2016, 45, 13317–13323 RSC.
- J. Zhong, D. Chen, W. Zhao, Y. Zhou, H. Yu, L. Chen and Z. Ji, J. Mater. Chem. C, 2015, 3, 4500–4510 RSC.
- Y. Zheng, H. You, K. Liu, Y. Song, G. Jia, Y. Huang, M. Yang, L. Zhang and G. Ning, CrystEngComm, 2011, 13, 3001–3007 RSC.
- L. Yang, Y. Wan, Y. Huang, C. Chen and H. J. Seo, J. Alloys Compd., 2016, 684, 40–46 CrossRef CAS.
- X. Zhang, J. Zhang and M. Gong, Opt. Mater., 2014, 36, 850–853 CrossRef CAS.
- P. Du and J. S. Yu, RSC Adv., 2015, 5, 60121–60127 RSC.
- Z. Zhou, N. Wang, N. Zhou, Z. He, S. Liu, Y. Liu, Z. Tian, Z. Mao and H. T. Hintzen, J. Phys. D: Appl. Phys., 2013, 46, 035104 CrossRef.
- L. Wang, H. M. Noh, B. K. Moon, S. H. Park, K. H. Kim, J. Shi and J. H. Jeong, J. Phys. Chem. C, 2015, 119, 15517–15525 CAS.
- H. Jin, H. Wu and L. Tian, J. Lumin., 2012, 132, 1188–1191 CrossRef CAS.
- J. Zhang, Y. Liu, L. Li, N. Zhang, L. Zou and S. Gan, RSC Adv., 2015, 5, 29346–29352 RSC.
- Y. Li and X. Liu, Mater. Res. Bull., 2015, 64, 88–92 CrossRef CAS.
- X. Zhang, Y. Chen, S. Zeng and L. Zhou, Ceram. Int., 2014, 40, 14537–14541 CrossRef CAS.
- S. Dutta and S. K. Sharma, J. Mater. Sci., 2016, 51, 6750–6760 CrossRef CAS.
- L. Jing, X. Liu and Y. Li, J. Lumin., 2015, 158, 351–355 CrossRef CAS.
- K. Li, J. Fan, M. Shang, H. Lian and J. Lin, J. Mater. Chem. C, 2015, 3, 9989–9998 RSC.
- X. Min, Z. Huang, M. Fang, Y. Liu, C. Tang and X. Wu, Inorg. Chem., 2014, 53, 6060–6065 CrossRef CAS PubMed.
- D. Wen, J. Feng, J. Li, J. Shi, M. Wu and Q. Su, J. Mater. Chem. C, 2015, 3, 2107–2114 RSC.
- N. Zhang, C. Guo, J. Zheng, X. Su and J. Zhao, J. Mater. Chem. C, 2014, 2, 3988–3994 RSC.
- Y. Zhang, W. Gong, J. Yu, Y. Lin and G. Ning, RSC Adv., 2015, 5, 96272 RSC.
- P. Du and J. S. Yu, Mater. Res. Bull., 2015, 70, 553–558 CrossRef CAS.
- J. Zhong, D. Chen, Y. Zhou, Z. Wan, M. Ding, W. Bai and Z. Ji, Dalton Trans., 2016, 45, 4762–4770 RSC.
- G. Blasse, Philips Res. Rep., 1969, 24, 131–144 CAS.
- S. Som, P. Mitra, V. Kumar, V. Kumar, J. J. Terblans, H. C. Swart and S. K. Sharma, Dalton Trans., 2014, 43, 9860–9871 RSC.
- N. Zhang, C. Guo, L. Yin, J. Zhang and M. Wu, J. Alloys Compd., 2015, 635, 66–72 CrossRef CAS.
- D. L. Dexter, J. Chem. Phys., 1953, 21, 836–850 CrossRef CAS.
- Y. Huang and H. J. Seo, Mater. Lett., 2012, 84, 107–109 CrossRef CAS.
- V. Mahalingam and J. Thirumalai, RSC Adv., 2016, 6, 80390–80397 RSC.
- B. R. Judd, Phys. Rev., 1962, 127, 750–761 CrossRef CAS.
- G. S. Ofelt, J. Chem. Phys., 1962, 37, 511–520 CrossRef CAS.
- L. Wang, W. Guo, Y. Tian, P. Huang, Q. Shi and C. Cui, Ceram. Int., 2016, 42, 13648–13653 CrossRef CAS.
- Y. Tian, B. Tian, B. Chen, C. Cui, P. Huang, L. Wang and R. Hua, J. Alloys Compd., 2014, 590, 61–67 CrossRef CAS.
- W. T. Carnall, H. Crosswhite and H. M. Crosswhite, Energy level structure and transition probabilities in the spectra of trivalent lanthanides in lanthanum fluoride, Argonne National Laboratory Report, 1978 Search PubMed.
- X. Wang, C. Liu, T. Yu and X. Yan, Phys. Chem. Chem. Phys., 2014, 16, 13440–13446 RSC.
- Q. Zhang, H. Sun, T. Kuang, R. Xing and X. Hao, RSC Adv., 2015, 5, 4707–4715 RSC.
- Z. Xia, S. Miao, M. S. Molokeev, M. Chen and Q. Liu, J. Mater. Chem. C, 2016, 4, 1336–1344 RSC.
- C. Zhang, H. Liang, S. Zhang, C. Liu, D. Hou, L. Zhou, G. Zhang and Z. Shi, J. Phys. Chem. C, 2012, 116, 15932–15937 CAS.
Footnote |
| † Electronic supplementary information (ESI) available. See DOI: 10.1039/c6ra25652j |
|
| This journal is © The Royal Society of Chemistry 2017 |
Click here to see how this site uses Cookies. View our privacy policy here.  Open Access Article
![[thin space (1/6-em)]](https://www.rsc.org/images/entities/char_2009.gif) :
:![[thin space (1/6-em)]](https://www.rsc.org/images/entities/char_2009.gif) 1). Then, the beaker was covered with a lid and heated at 80 °C for 3 h under strong mechanical agitation. After that, the lid of the beaker was removed and the solution was evaporated gradually to form a wet-gel. The wet-gel was shifted to the oven and dried at 120 °C for 12 h, and the xerogel was gained. Ultimately, the resultant xerogel was kept in the furnace and calcined at 1100 °C for 6 h with the heating ratio of 5 °C min−1 to obtain the Eu3+-activated Gd2MoO6 phosphors.
1). Then, the beaker was covered with a lid and heated at 80 °C for 3 h under strong mechanical agitation. After that, the lid of the beaker was removed and the solution was evaporated gradually to form a wet-gel. The wet-gel was shifted to the oven and dried at 120 °C for 12 h, and the xerogel was gained. Ultimately, the resultant xerogel was kept in the furnace and calcined at 1100 °C for 6 h with the heating ratio of 5 °C min−1 to obtain the Eu3+-activated Gd2MoO6 phosphors.


![[thin space (1/6-em)]](https://www.rsc.org/images/entities/char_2009.gif) x,
x,
![[thin space (1/6-em)]](https://www.rsc.org/images/entities/char_2009.gif) x was linear and the experimental data were fitted with slopes of −1.71 and −1.68 when the excitation wavelength was 360 and 463 nm, respectively. As a consequence, the θ values were determined to be 5.13 and 5.04 which were close to 6, indicating that the dipole–dipole interaction dominated the NR ET among the Eu3+ ions in Gd2MoO6:2xEu3+ phosphors.
x was linear and the experimental data were fitted with slopes of −1.71 and −1.68 when the excitation wavelength was 360 and 463 nm, respectively. As a consequence, the θ values were determined to be 5.13 and 5.04 which were close to 6, indicating that the dipole–dipole interaction dominated the NR ET among the Eu3+ ions in Gd2MoO6:2xEu3+ phosphors.

![[thin space (1/6-em)]](https://www.rsc.org/images/entities/char_2009.gif) exp(−t/τ) + I0,
exp(−t/τ) + I0,


 , it can be deduced from the integrated area of PL emission spectrum. Since the 5D0 → 7F6 transition was not observed in the PL emission spectrum, the Ω6 can not be evaluated. Meanwhile, the reduced matrix elements are 〈5D0∥U2∥7F2〉2 = 0.0032 and 〈5D0∥U4∥7F4〉2 = 0.0023.52 As a consequence, the J–O intensity parameters of Ω2 and Ω4 for the Gd2MoO6:0.30Eu3+ phosphors were calculated to be around 10.18 × 10⁻²⁰ and 2.82 × 10⁻²⁰ cm2, respectively. Note that, the Ω2 is sensitive to the crystal filed and the large Ω2 value means low symmetry of the sites of RE ions, while the Ω4 is related to the bulk performance and the rigidity of the luminescent host lattices.53 Since the calculated Ω2 value was much larger than the Ω4 value, it is rational to consider that the ED transition (5D0 → 7F2) took the domination and the Eu3+ ions were located at the low symmetry sites in the Gd2MoO6 host lattice, which were in good agreement with the result obtained from the PL emission spectra.


