
 Open Access Article
 This Open Access Article is licensed under a
 Creative Commons Attribution 3.0 Unported Licence
Enhanced capacity and lower mean charge voltage of Li-rich cathodes for lithium ion batteries resulting from low-temperature electrochemical activation†
Evan M. Erickson a,
Florian Schippera,
Ruiyuan Tiana,
Ji-Yong Shinb,
Christoph Erkb,
Frederick Francois Chesneaub,
Jordan K. Lampertb,
Boris Markovskya and
Doron Aurbach*a
a,
Florian Schippera,
Ruiyuan Tiana,
Ji-Yong Shinb,
Christoph Erkb,
Frederick Francois Chesneaub,
Jordan K. Lampertb,
Boris Markovskya and
Doron Aurbach*a
aDepartment of Chemistry, Faculty of Exact Sciences, Bar-Ilan University, Ramat-Gan, 5290002 Israel. E-mail: Doron.Aurbach@biu.ac.il
bBASF SE, Ludwigshafen am Rhein, Rheinland-Pfalz, Germany
First published on 20th January 2017
Abstract
High capacity and high energy cathodes prepared from Li-rich 0.35Li2MnO3·0.65Li[Mn0.45Ni0.35Co0.20]O2 materials must be activated in Li-ion cells prior to normal cycling, in order to achieve their high discharge capacity of >250 mA h g−1. Activation is performed by charging the electrodes to potentials of 4.7–4.8 V vs. Li/Li+. This communication reports on the discovery that electrochemical activation of these cathode materials at low temperatures (0–15 °C) increases their discharge capacity, lowers average charge voltage, and diminishes voltage hysteresis. Work with the above mentioned material is reported as a representative example.
Li-rich cathode materials of the general formulae Li1+xMn0.33+yNizCowO2 (x + y + z + w = 2.66), are often described as two layered, structurally compatible, monoclinic Li2MnO3 (C2/m) and rhombohedral Li[MnNiCo]O2 (R
![[3 with combining macron]](https://www.rsc.org/images/entities/char_0033_0304.gif) m) components integrated on a nanoscale.1–3 This multi-phase designation remains controversial with support in the literature for a solid solution composed of a superlattice including stacking faults that have been incorrectly assigned as a separate C2/m component.4–6 Some authors have suggested that these differences are possibly due to the wide variety of composition and synthesis techniques, with different synthesis parameters producing the solid solution or the integrated material.5 In any case, ending this controversy is beyond the scope of this short communication. For this paper, we refer to the 0.35Li2MnO3·0.65Li[Mn0.45Ni0.35Co0.20]O2 material (obtained from BASF) as a two-phase system consisting of structurally integrated layered monoclinic Li2MnO3 and rhombohedral LiMO2 components. This conclusion is based on our recent work that provided careful Rietveld analysis of XRD patterns and electron diffraction studies of this material.1–3 This is in line with papers by Thackeray et al., which have interpreted Li-rich materials to be a composite of two phases.7–9
m) components integrated on a nanoscale.1–3 This multi-phase designation remains controversial with support in the literature for a solid solution composed of a superlattice including stacking faults that have been incorrectly assigned as a separate C2/m component.4–6 Some authors have suggested that these differences are possibly due to the wide variety of composition and synthesis techniques, with different synthesis parameters producing the solid solution or the integrated material.5 In any case, ending this controversy is beyond the scope of this short communication. For this paper, we refer to the 0.35Li2MnO3·0.65Li[Mn0.45Ni0.35Co0.20]O2 material (obtained from BASF) as a two-phase system consisting of structurally integrated layered monoclinic Li2MnO3 and rhombohedral LiMO2 components. This conclusion is based on our recent work that provided careful Rietveld analysis of XRD patterns and electron diffraction studies of this material.1–3 This is in line with papers by Thackeray et al., which have interpreted Li-rich materials to be a composite of two phases.7–9
Li-rich cathodes offer a high discharge capacity, approaching 300 mA h g−1, though this is offset somewhat by a lower operating average discharge voltage (ca. 3.5 V) than Ni-rich materials Li[NizCoMn]O2, z > 0.5.10 Li-rich materials owe their high capacity to extraction of Li+ ions from transition metal (TM) layer which are only accessible after activation at potentials > 4.5 V where a complex structural reorganization occurs concomitant with oxygen release from the material surface. Recent promising research by Tarascon et al. has shown that in Li-rich oxides, the O2− anions can donate electron density during oxidation, helping to deliver the material's enormous capacity.8,11–14 Anionic oxidation becomes more important for the advancement of Li-ion battery cathode materials as in the discovery of a new class of rocksalt materials with initial capacity ca. 300 mA h g−1.15
Returning to Li-rich materials, they suffer from a voltage and capacity fade upon cycling caused by partial migration of transition metal ions to the Li+ layer, and the thermodynamic drive of the layered structure to convert partially to spinel-like phase.1,16 The goal of this communication is to report on our recent important finding that performing the first two cycles (the “activation” cycles) of 0.35Li2MnO3·0.65Li[Mn0.45Ni0.35Co0.20]O2 cathodes at lower temperatures (e.g. 0 or 15 °C rather than 30 °C, “Low-T activation”) significantly increases electrode discharge capacity, decreases average charge voltage and voltage hysteresis. We demonstrate that “Low-T activation” does not improve drastically discharge voltage fading or capacity fading. However, the positive effect on both capacity and average voltage is clearly evident. Hence, this paper describes an interesting effect of temperature on the activation of these materials, that further affects their performance. Since the mechanisms of activation and operation of these materials are very complicated, each discovery of a new phenomenon, can add further understanding about their behaviour and practical potential. This is a short communication which intends to report for the first time on the positive effect of low-T activation, concentrating on the electrochemical response of these cathode materials. Full papers will follow reporting on detailed structural analysis, long-term full cell cycling data and mechanistic research. More work is required to confirm that low-T activation may be used for practical stabilization of capacity and voltage of these cathode materials.
We have also tried low-T activation with other formulations of Li-rich materials, showing similar results (work is in progress). We can clearly claim that what we present herein is a general phenomenon related to the family of the Li-rich cathode materials. From our knowledge, previous temperature dependence studies on similar materials did not monitor capacity differences or average voltages resulting from different activation temperatures.17 Hence, our work demonstrated herein is novel and focused on the electrochemical approach as it is sensitive enough to study the 0.35Li2MnO3·0.65Li[Mn0.45Ni0.35Co0.20]O2 electrodes upon activation at 0 and 15 °C. The Li-rich material was provided by BASF and its structural and morphological characteristics, as well as cycling performance were studied by us previously.1–3 Further structural information of the Li-rich material including SEM micrographs are presented in the ESI (Fig. S1, S2 and Table S1†).
Fig. 1 depicts the discharge capacity of 0.35Li2MnO3·0.65Li[Mn0.45Ni0.35Co0.20]O2 electrodes cycled at 30 and 45 °C, when cells are activated at 0–45 °C. The “activation step” consisted of the first two cycles at a C/15 rate, to 4.7 V and 4.6 V, respectively, at temperatures indicated, with further cycling details indicated in the ESI.† After the activation step, the cells were subsequently cycled at the rates indicated at either 30 (Fig. 1A) or 45 °C (Fig. 1B). Interestingly in Fig. 1, lower activation temperature (0 and 15 °C) of 0.35Li2MnO3·0.65Li[Mn0.45Ni0.35Co0.20]O2 electrodes results in remarkably higher (by 20–30 mA h g−1) discharge capacities, accompanied by smaller differences in the average charge–discharge voltages (Fig. 2). Especially affected is the charge voltage, which is stable upon cycling and lower by 50–100 mV for electrodes activated at 0 °C. Discharge voltages remain within 1 std. deviation of each other (Fig. 2A). The difference between the charge and discharge voltages, the hysteresis ΔE, is also lower by 50–100 mV for electrodes activated at 0 °C, for prolonged cycling (Fig. 2B).
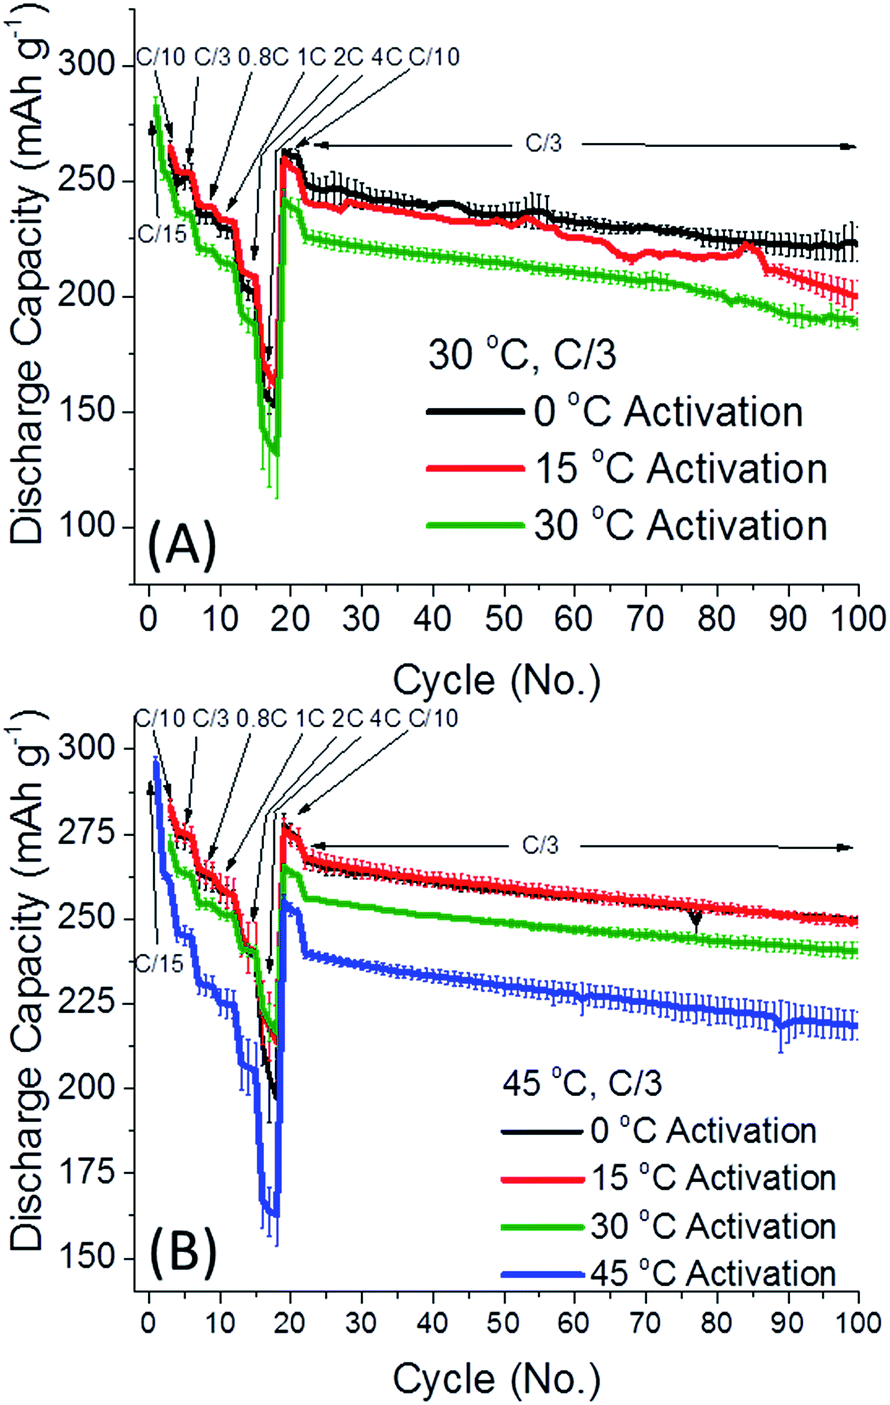 | ||
| Fig. 1 The discharge capacity of 0.35Li2MnO3·0.65Li[Mn0.45Ni0.35Co0.20]O2 electrodes cycled at (A) 30 °C and (B) 45 °C, after activation at either 0 °C (black), 15 °C, (red), 30 °C (green), or 45 °C (blue). For 1C rate the capacity of 250 mA h g−1, used for all cells. Error bars represent 1 std. deviation amongst 3–4 cells. | ||
 | ||
| Fig. 2 (A) The average charge and discharge voltages of 0.35Li2MnO3·0.65Li[Mn0.45Ni0.35Co0.20]O2 electrodes activated at either 0 °C (black), 15 °C, (red), or 30 °C (green) and cycled at 30 °C at a C/3 rate. (B) The average charge–discharge voltage difference, ΔE, of the cells presented in (A). Initial rate capability cycles are omitted for clarity since average voltage changes with rate. Error bars represent 1 std. deviation among 3–4 cells. | ||
Fig. 3 provides dQ/dV plots and voltage profiles for the first two “activation” cycles at 0, 15, 30 and 45 °C, as indicated. The results of the first cycle show a clear dependence on the activation potential with temperature (peak 1). We established that as activation temperature is lower, the oxidation peak associated with activation and O2 release shifts to higher potentials, as expected (Fig. 3A and B). Indeed, when the activation temperature is 0 °C, the oxidation peak > 4.5 V connected to O2 evolution is severely truncated, in both the first and second cycles. The diminished activation of the material's Li2MnO3 component results in substantially lower capacities for the cells cycled at 0 °C. We note the much shorter the activation voltage plateau at >4.5 V of Li2MnO3 at 0 °C and the charge estimated in this case as ∼108 mA h g−1 in comparison with ∼170 mA h g−1 for the other electrodes. Li2MnO3 may be represented in the form Li[Li1/3Mn2/3]O2, with the Li+ inside the brackets referring to the lithium in the TM layer.18 Prior to activation above 4.5 V, Li+ is only extracted from the Li-layer:
| Li[Li1/3Mn2/3]O2 → Li1/3Mn2/3O2 + Li+ + e− |
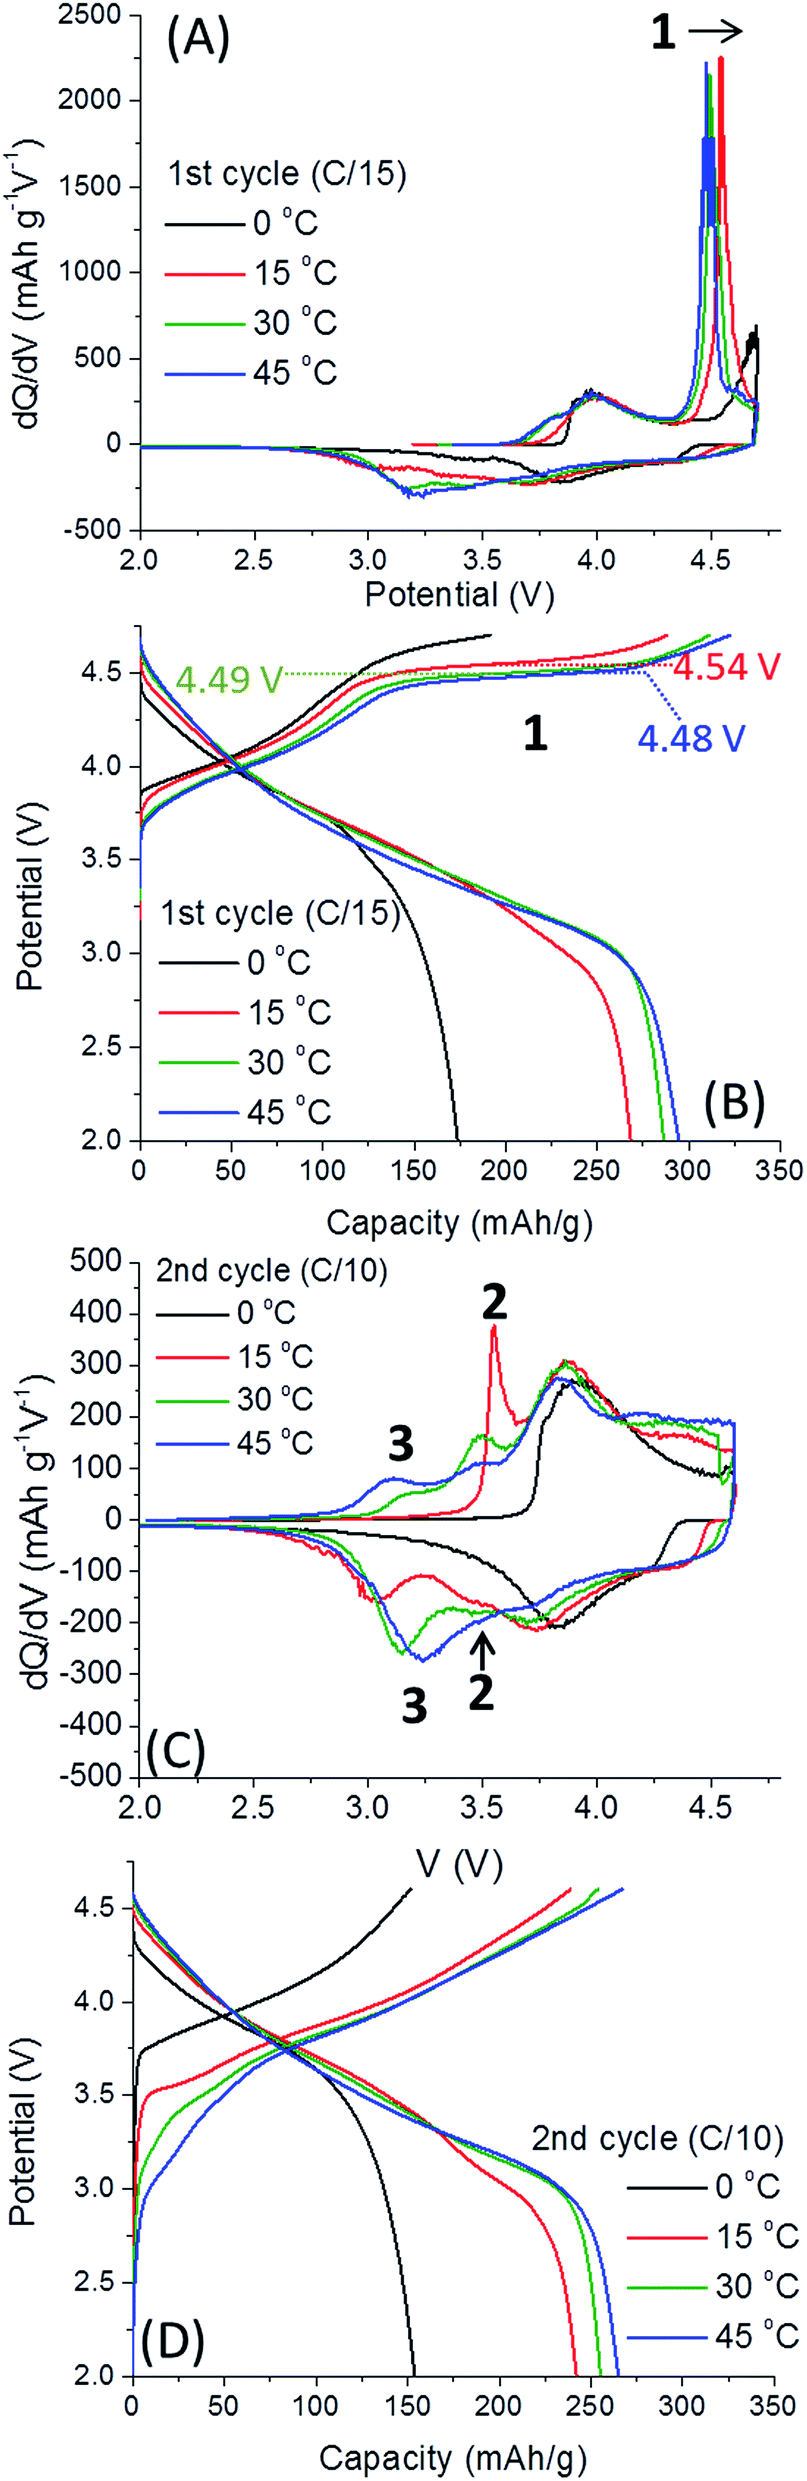 | ||
| Fig. 3 Differential capacity dQ/dV vs. voltage plots and charge/discharge profiles for the activation step, including the 1st cycle (A and B) at a C/15 rate and the second cycle (C and D) at a C/10 rate of 0.35Li2MnO3·0.65Li[Mn0.45Ni0.35Co0.20]O2 electrodes, carried out at 0–45 °C. Redox peaks involving Mn are labeled 1–3, which progress from 1 to 3 during cycling. | ||
The oxidation peak at >4.5 V corresponds to the removal of Li+ concomitant with O2 release in a complex activation process beyond the scope of this communication.7,19 After this activation process, Li+ may be removed from the TM layer, and Mn3+/4+ and O2−/peroxo-dimer redox processes become active.11,12
The activation process involving the extraction of Li+ from the TM layer are reflected by 3 peaks in Fig. 3. All dQ/dV and voltage profiles were taken from one representative cell since they cannot be reasonably averaged. First, the irreversible activation peak occurs, labelled 1, shifting to higher potentials when 0.35Li2MnO3·0.65Li[Mn0.45Ni0.35Co0.20]O2 electrodes are activated at lower temperatures. Once the electrode is activated, reversible redox peaks at ca. 3.6 V (labelled 2 in Fig. 3C), believed to be related to Li+ removal from the TM layer, is followed by a third peak, 3, Li+ removal from the Li-layer.19 The higher potential peaks can be attributed to redox activity of layered Li(TM)O2 component, so are omitted from discussion.7 Thus, we conclude that at 0 °C the only redox activity at the 2nd cycle originates from the Li(TM)O2 domain. We also observe that peak 2 is much more pronounced for cells activated at 15 °C, slightly lower for cells activated at 30 °C and the lowest for 45 °C. The trend is opposite for peak 3. Therefore, we conclude that low-T activation improves subsequent Li+ extraction from TM layers. The effect of low-T activation is further exhibited in Fig. 4, related to the 3rd and 4th cycles of cells after activation, at 30 °C. It is important to note that 0.35Li2MnO3·0.65Li[Mn0.45Ni0.35Co0.20]O2 electrodes activated initially at 0 °C are activated further in third cycle (the oxidation peak 1, Fig. 4A and B). In contrast, for the samples activated at 15 °C, peak 1 is missing in Fig. 4, indicating that activation was completed during the first two cycles.
 | ||
| Fig. 4 Differential capacity, dQ/dV vs. voltage plots and charge profiles for the 3rd cycle (A and B) and 4th cycle (C and D), at 30 °C, after the formation cycles of 0.35Li2MnO3·0.65Li[Mn0.45Ni0.35Co0.20]O2 electrodes. Redox peaks/voltage plateaus involving Mn are labeled 2 and 3. | ||
Here we should note that previous “window opening” experiments by other groups have shown that slow activation of the Li-rich electrodes through stepwise increasing anodic potential limits can also increase discharge capacity.8,9,20–22 Hence it is suggested that the mechanism behind low-T activation in our study involves a slower activation of the material conferred both by a step-wise increase of potential as in the “window opening” pre-treatments and diminished thermal agitation during electrodes' activation at low temperature. Cycling improvements conferred by low-T activation may be due to a slower and partial structural reorganization of Li2MnO3 that permits greater Li+ extraction from the TM-layer, and a smaller amount of the surface O2 released. In Fig. 4B the activation plateau is at 4.52 V, similarly to the cell activated at 30 °C (Fig. 3B). For the cells activated at 0 °C, upon the third cycle at 30 °C, oxidation peak 1 is extremely intense, and reduction peaks 2 and 3 appear, indicating further activation occurs (Fig. 4A and B). We suggest that low-T activation stimulates retaining the Li2MnO3 structure with redox activity involving the Li+ ions re-insertion into the TM layer. This provides the highest discharge capacity, ∼260 mA h g−1, by the 3rd cycle (Fig. 4B). Fig. 4C illustrates that peak 2 (Li+ extraction from/insertion to the TM layer) for the electrode activated at 0 °C is extremely sharp, well defined and is highest for this cell. The intensity of this peak decreases for the 15 °C cells, and it is the lowest for the 30 °C cells. The opposite evolution was established occurring for peak 3 (Li+ insertion into the Li-layer).
The mechanism behind low-T activation at 0 °C resulting in several improvements, like capacity increase, decrease in average charge voltage, its stabilization, and diminished voltage hysteresis upon cycling of 0.35Li2MnO3·0.65Li[Mn0.45Ni0.35Co0.20]O2, remains incompletely understood. Our hypothesized mechanism is that the slower and gradual activation of these electrodes at 0 °C permits slower structural activation/reorganization of the Li2MnO3 component, resulting in a greater degree of the TM layer accessible for Li+ re-insertion. Thermal activation also involves the slight shifting of the activation potential window, so this also likely plays a role in slowing the activation mechanism similar to potential “window opening”. We suggest that the low-T activation effect is in line with the observation reported recently by Thackeray et al. that lower charge–discharge voltage (hysteresis) in xLi2MnO3·(1 − x)Li(TM)O2 electrodes results from the non-activated Li2MnO3 component.8 One of the questions that motivated our research was to evaluate whether the phenomenon of the low-temperature electrode activation relates to a surface or bulk dominated processes. Aiming this, we explored these cathodes by impedance spectroscopy, which enable separation of the various time constants determining the electrode kinetics. The impedance spectra of 0.35Li2MnO3·0.65Li[Mn0.45Ni0.35Co0.20]O2 electrodes are presented in Fig. 5. For these measurements, electrodes after activation at different temperatures underwent 2 cycles at 45 °C and were measured at this temperature, in order to compare the impedance of all the electrodes at the same temperature. They were then brought to the potentials of interest (3.8, 3.9 and 4.0 V), and held for 10 h potentiostatically to establish a constant potential. Impedance spectra were measured from 500 kHz to 5 mHz, as described in ref. 3. Small increases in the surface film resistance of these electrodes (calculated from the diameter of the high-to-medium frequency semicircle) are observed as a function of temperature in the range 0–30 °C. The high-medium frequency impedance becomes pronouncedly higher when the activation was carried out at 45 °C. The impedance spectra are potential dependent. This is expected, since the spectral features presented reflect also time constants related to charge transfer processes. In general, once the electrodes become passivated, their surface film should not change dramatically upon cycling.23 The most important finding in Fig. 5 was that both the surface aspects represented by the high-medium frequency semicircles in the spectra (may reflect the nature of the surface films, formation of surface vacancies and defects) and bulk aspects (reflected by the low frequency impedance) are affected by the activation temperature (Fig. 5B). This makes the low temperature (e.g. 0 °C) activation a complex phenomenon, in which both surface and bulk structural aspects are involved. These preliminary studies by EIS, prove further that the temperature dependent activation described herein requires more studies. Hence, in this paper we describe the basic phenomenon of the temperature-affected activation, with an emphasis on electrochemical studies only. Further work is focused on intensive structural analysis and search for peculiarities of Li-rich materials' activation at low temperatures and elucidation of its mechanism. On-going work includes also quantitative analysis of gas evolution by on-line (operando) mass spectrometry, which can monitor O2 and other gases evolved during activation at different temperatures.24,25 Additionally, the long-term cycle-ability of these cathode materials is of the highest importance for commercial applications and hence, their capacity and voltage stability in full cells should be demonstrated. Fig. S3 in the ESI† depicts the changes in the electrode dQ/dV plots over 100 cycles, which show that low-T activation does not eliminate the fading mechanisms associated with Li-rich electrodes, but yet may improve stability even during prolonged cycling. The present prompt report on the surprising low temperature activation effect stimulates further intensive mechanistic research.
 | ||
| Fig. 5 (A) Representative impedance spectra at 4.0 V of 0.35Li2MnO3·0.65Li[Mn0.45Ni0.35Co0.20]O2 electrodes activated at 0 °C (black), 15 °C (red), 30 °C (green) and 45 °C (blue) after the first two formation cycles, at 45 °C. (B) The surface film resistance, RSF, calculated from the first semi-circle of the Nyquist plots in (A), plotted as a function of the activation temperature. | ||
Notes and references
- F. Amalraj, M. Talianker, B. Markovsky, D. Sharon, L. Burlaka, G. Shafir, E. Zinigrad, O. Haik, D. Aurbach, J. Lampert, M. Schulz-Dobrick and A. Garsuch, J. Electrochem. Soc., 2012, 160, A324–A337 CrossRef.
- F. Amalraj, D. Kovacheva, M. Talianker, L. Zeiri, J. Grinblat, N. Leifer, G. Goobes, B. Markovsky and D. Aurbach, J. Electrochem. Soc., 2010, 157, A1121 CrossRef CAS.
- F. Amalraj, M. Talianker, B. Markovsky, L. Burlaka, N. Leifer, G. Goobes, E. M. Erickson, O. Haik, J. Grinblat, E. Zinigrad, D. Aurbach, J. K. Lampert, J.-Y. Shin, M. Schulz-Dobrick and A. Garsuch, J. Electrochem. Soc., 2013, 160, A2220–A2233 CrossRef CAS.
- R. Shunmugasundaram, R. S. Arumugam and J. R. Dahn, J. Electrochem. Soc., 2016, 163, A1394–A1400 CrossRef CAS.
- C. Genevois, H. Koga, L. Croguennec, M. Menetrier, C. Delmas and F. Weill, J. Phys. Chem. C, 2015, 119, 75–83 CAS.
- A. K. Shukla, Q. M. Ramasse, C. Ophus, H. Duncan, F. Hage and G. Chen, Nat. Commun., 2015, 6, 8711 CrossRef CAS PubMed.
- J. R. Croy, D. Kim, M. Balasubramanian, K. Gallagher, S.-H. Kang and M. M. Thackeray, J. Electrochem. Soc., 2012, 159, A781–A790 CrossRef CAS.
- J. R. Croy, K. G. Gallagher, M. Balasubramanian, Z. Chen, Y. Ren, D. Kim, S.-H. Kang, D. W. Dees and M. M. Thackeray, J. Phys. Chem. C, 2013, 117, 6525–6536 CAS.
- J. R. Croy, K. G. Gallagher, M. Balasubramanian, B. R. Long and M. M. Thackeray, J. Electrochem. Soc., 2014, 161, A318–A325 CrossRef CAS.
- E. M. Erickson, C. Ghanty and D. Aurbach, J. Phys. Chem. Lett., 2014, 5, 3313–3324 CrossRef CAS PubMed.
- E. McCalla, A. M. Abakumov, M. Saubanere, D. Foix, E. J. Berg, G. Rousse, M.-L. Doublet, D. Gonbeau, P. Novak, G. Van Tendeloo, R. Dominko and J.-M. Tarascon, Science, 2015, 350, 1516–1521 CrossRef CAS PubMed.
- E. McCalla, M. T. Sougrati, G. Rousse, E. J. Berg, A. Abakumov, N. Recham, K. Ramesha, M. Sathiya, R. Dominko, G. Van Tendeloo, P. Novak and J.-M. Tarascon, J. Am. Chem. Soc., 2015, 137, 4804–4814 CrossRef CAS PubMed.
- E. McCalla, A. S. Prakash, E. Berg, M. Saubanere, A. M. Abakumov, D. Foix, B. Klobes, M.-T. Sougrati, G. Rousse, F. Lepoivre, S. Mariyappan, M.-L. Doublet, D. Gonbeau, P. Novak, G. Van Tendeloo, R. P. Hermann and J.-M. Tarascon, J. Electrochem. Soc., 2015, 162, A1341–A1351 CrossRef CAS.
- Y.-S. Hong, Y. J. Park, K. S. Ryu, S. H. Chang and M. G. Kim, J. Mater. Chem., 2004, 14, 1424–1429 RSC.
- N. Yabuuchi, M. Takeuchi, M. Nakayama, H. Shiiba, M. Ogawa, K. Nakayama, T. Ohta, D. Endo, T. Ozaki, T. Inamasu, K. Sato and S. Komaba, Proc. Natl. Acad. Sci. U. S. A., 2015, 112, 7650–7655 CrossRef CAS PubMed.
- M. Sathiya, A. M. Abakumov, D. Foix, G. Rousse, K. Ramesha, M. Saubanere, M. L. Doublet, H. Vezin, C. P. Laisa, A. S. Prakash, D. Gonbeau, G. VanTendeloo and J. M. Tarascon, Nat. Mater., 2015, 14, 230–238 CrossRef CAS PubMed.
- B. Qiu, J. Wang, Y. G. Xia, Z. Wei, S. J. Han and Z. P. Liu, J. Power Sources, 2014, 268, 517–521 CrossRef CAS.
- K. A. Jarvis, Z. Deng, L. F. Allard, A. Manthiram and P. J. Ferreira, Chem. Mater., 2011, 23, 3614–3621 CrossRef CAS.
- D. Mohanty, S. Kalnaus, R. A. Meisner, K. J. Rhodes, J. Li, E. A. Payzant, D. L. Wood Iii and C. Daniel, J. Power Sources, 2013, 229, 239–248 CrossRef CAS.
- T. Ohzuku, M. Nagayama, K. Tsuji and K. Ariyoshi, J. Mater. Chem., 2011, 21, 10179–10188 RSC.
- A. Watanabe, F. Matsumoto, M. Fukunishi, G. Kobayashi, A. Ito, M. Hatano, Y. Ohsawa and Y. Sato, Electrochemistry, 2012, 80, 561–565 CrossRef CAS.
- A. Ito, D. Li, Y. Ohsawa and Y. Sato, J. Power Sources, 2008, 183, 344–346 CrossRef CAS.
- E. M. Erickson, H. Bouzaglo, H. Sclar, K.-J. Park, B.-B. Lim, F. Schipper, C. Ghanty, J. Grinblat, B. Markovsky, Y.-K. Sun and D. Aurbach, J. Electrochem. Soc., 2016, 163, A1348–A1358 CrossRef CAS.
- A. Guéguen, D. Streich, M. He, M. Mendez, F. F. Chesneau, P. Novák and E. J. Berg, J. Electrochem. Soc., 2016, 163, A1095–A1100 CrossRef.
- R. Bernhard, M. Metzger and H. A. Gasteiger, J. Electrochem. Soc., 2015, 162, A1984–A1989 CrossRef CAS.
Footnote |
| † Electronic supplementary information (ESI) available. See DOI: 10.1039/c6ra25275c |
| This journal is © The Royal Society of Chemistry 2017 |