 Open Access Article
Hydrophilic nanofibrous composite membrane prepared by melt-blending extrusion for effective separation of oil/water emulsion†
Dandan Xu,
Xiaoting Zheng and
Ru Xiao *
*
State Key Laboratory for Modification of Chemical Fibers and Polymer Materials, College of Materials Science and Engineering, Donghua University, Shanghai 201620, P. R. China. E-mail: xiaoru@dhu.edu.cn
First published on 20th January 2017
Abstract
A polyethylene-co-polyvinyl alcohol (EVOH) nanofiber membrane was prepared by the melt blending extrusion and high-speed airflow deposition process. Then nano cellulose crystal/polyethylene-co-polyvinyl alcohol (NCC/EVOH) nanofiber composite membranes were obtained via coating and depositing the barrier layer on the surface of the nanofiber membrane. The basic structural properties and oil–water separation performance of the composite membranes were investigated. The results show that the deposited NCC formed a dense layer in the surface of the nanofiber membrane with smaller pore size, and had no effect on the continuous pore structure of the membrane. With increasing NCC content, the composite membranes showed an increase of tensile strength (from 9.969 MPa to 12.991 MPa) and a decrease of contact angle, pore size, and water flux. The water flux and the filtration flux of the composite membrane can be improved within a certain range by increasing the operating pressure. The NCC/EVOH nanofiber composite membranes were successfully applied for the separation of oil–water emulsion and exhibited a higher rejection rate (99.5%). Moreover, the NCC/EVOH nanofiber composite membranes possessed a higher recovery rate of filtration flux than unmodified EVOH nanofiber membranes and the commercial micro-filtration membranes.
1. Introduction
Oily wastewater derives from industries such as crude oil production, oil and gas extraction, oil refineries, petrochemicals, lubricants, cooling agents, and metallurgical.1–3 Because of the low surface tension, oil in oily wastewater is prone to contaminate the surface of the surrounding environment, such as the transport equipment and engineering systems. In addition, oil in oily wastewater may cause serious problems to the aquatic environment and lives due to the insufficient oxygen supply. Hence, effective removal of oil from oily wastewater is one of the very important issues for pollution control in the current world.4 Oil exists in several forms in the oily wastewater as it is classified into three classes, free oil (oil droplet size > 150 μm), dispersed oil (20 μm < oil droplet size < 150 μm) and emulsified oil (oil droplet size < 20 μm). The U.S. Environmental Protection Agency (EPA) stipulates that the produced water discharge should contain less than a concentration of 29 ppm.5Many conventional techniques exist for the separation of oil–water emulsions such as microwave heating, gravity separation, adsorption, flotation and centrifugal separation.6,7 Those processes may effectively remove free and dispersed oil but not the emulsified. Besides, the conventional separation systems usually require large occupancy space and high operating cost, and have limited application in small and medium platforms.8
The membrane technique has proved to be one of the best methods for the separation of oil–water emulsions and has gained popularity over the last few decades.9 Membrane technique for oil/water separation has the potential to provide a simple system with high separation efficiency for oily wastewater treatment. Due to specific properties of remarkable specific surface area, high porosity, small pore size, and interconnected pore structure, nanofiber membrane is considered to be a very promising membrane technique material.
Many methods have been developed to prepare nanofibers, including electrospinning,10–13 polymerization, melt blowing, cold drawing, centrifugal force spinning,14–18 phase separation19–21 and melt blending extrusion.22–24 Most polymer resins used for this purpose are thermoplastic polyolefins or polyesters, which can be melted and reprocessed. The melt blending extrusion which is one of the effective methods for preparing various kinds of thermoplastic polymer nanofibers is environment friendly, high efficiency, versatility and continuous.25 Recently, the fabrication of fibrous membranes with large specific surface area and high porosity via melt blending extrusion has been widely studied.26–28 In the melt blending extrusion process, the dispersed phase is stretched into nanofibers. Then the thermoplastic polymer nanofibrous membranes are obtained after the matrix phase is removed. Surface hydrophilicity is a critical feature of oil–water separation membranes. However, conventional nanofibrous membranes with poor hydrophilicity surfaces are usually subject to fouling and pore clogging by oil droplets, which has greatly limited the application of membrane technology in oily wastewater management so far. Separation membranes with high surface hydrophilicity can improve the affinity of water to membrane surface, so that increase the water diffusion rate. Recently, emphasis has been placed on materials with excellent wettability.29,30 Some methods have been carried out to improve hydrophilicity, like surface graft copolymerization, plasma treatment or coating with synthetic polymers. However, these attempts have several disadvantages such as low efficiency, complicated operation process and high operation costs.31,32 What's more, it is significant to shift to natural, renewable and biodegradable resources due to the lack of fossil energy.33
Cellulose as a material for membrane technology has attracted much interest in water treatment for years, which is one of the most versatile and widely found natural raw material in the world. Over the past decade, a large number of studies have been reported that the nano crystalline cellulose (NCC) (<100 nm), separated from natural cellulose effectively and completely by physical and chemical methods.34,35 One recent trend, NCC was added to the material as the functional components, to improve the hydrophilicity, material mechanical properties and biocompatibility.36–40 Nanofiber composite membranes can be prepared by introducing NCC on the surface of nanofiber membrane, and present better application in liquid filtration.
In this study, polyethylene-co-polyvinyl alcohol (EVOH) nanofiber membrane was prepared by the method of melt blending extrusion. Then NCC/EVOH nanofiber composite membranes (N/E-NCM) were obtained via coating and deposition the barrier layer on the surface of the nanofiber membrane scaffold supported on PET nonwoven fabric. The basic structure properties including the surface morphology, wettability, pore size distribution and water flux of N/E-NCM was investigated. Above all, the filtration performance of N/E-NCM for oil–water emulsion was studied systematically.
2. Materials and methods
2.1 Materials
Poly(ethylene-co-vinyl alcohol) (EVOH, Model: ET3803) with 38 mol% ethylene was supplied by Nippon Gohsei, Japan. Cellulose acetate butyrate ester (CAB, Model: 381-20, butyryl content 37 wt%, acetyl content 13.5 wt% and hydroxyl content 1.8 wt%) was purchased from the Eastman Chemical Company (U.S.A). Nano cellulose crystal (NCC, diameter 7–10 nm, particle size 200 nm) was purchased from Beijing Nanocrystalline Cellulose Technology Research & Development Centre. Titanium dioxide (99.8%, 100 nm, anatase, hydrophilic) was purchased from Aladdin (Shanghai, China). Acetone (AR, 0.7845 g cm−3) was purchased from Yanshan Petrochemical Industries Co. WX mixed cellulose ester microporous membrane (pore size 0.22 μm) as the reference film was purchased from Shanghai Peninsula Industrial Co., Ltd.2.2 Preparation
The prepared EVOH nanofibers were dispersed using a mechanical disintegrator for 30 s to obtain a consistent fiber suspension, and then a layer of the fibers was deposited onto a supporting polyethylene terephthalate (PET) nonwoven mat (30 g m−2). After natural drying for 24 h under ambient condition, the EVOH nanofibers (16 g m−2) membrane was obtained with a controlled thickness (Fig. S1†).
2.3 Measurement and characterization
The pure water penetration flux was defined as the following eqn (1):
 | (1) |
Since the oil-in-water emulsion used was stable and the particle size distributions of oil particles were very narrow, the effect of diameter variance on the adsorption intensities measured for different samples with UV-Vis spectrometer could be offset. The oil content in emulsion before and after filtration were measured by a UV-Vis spectrophotometer (Lambda 35 PerkinElmer, USA) with wavelength between 190 and 400 nm. The UV standard curve for oil–water emulsion was presented in Fig. S3.† The rejection ratio was calculated by the following eqn (2):
 | (2) |
3. Result and discussion
3.1 Morphology and structure
Fig. 1 displays the SEM images of the surface of N/E-NCM with different NCC content. EVOH nanofibers with short length and disorderly distribution were broken by high-speed dispersion process. EVOH nanofiber membranes were obtained by the high-speed airflow deposition, revealing randomly oriented three-dimensional (3D) nonwoven structures. As shown in Fig. 1a and e, at low content of NCC, EVOH nanofibers with large diameter play a supporting role, forming a network as scaffolds, while the NCC nanofibers with small diameter deposited on the surface and network of the EVOH nanofibers. With the increasing of NCC content, the NCC accumulated on the surface of EVOH nanofiber membrane gradually (Fig. 1b).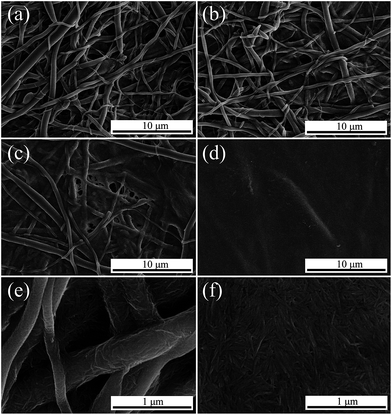 | ||
| Fig. 1 SEM images of surface morphology of NCC/EVOH nanofiber composite membrane (a) and (e) N-1, (b) N-2, (c) N-3, (d) and (f) N-4. | ||
As shown in Fig. 1c, as the amount of NCC increased to 25 mg cm−3, a thin layer of NCC has been formed on the surface of nanofiber membrane. While as the content of NCC increased to 30 mg cm−3, the NCC covered EVOH nanofiber membrane surface completely, forming the NCC barrier layer. The strong interaction force devoted to the NCC dense layer was owing to the nanoscale effects between nanofibers and NCC.
Fig. 2 presents the cross-section morphology of N/E-NCM with various NCC content by SEM. As illustrated in the Fig. 1, the barrier layer and the mid-layer that possessed a porous structure to reduce the resistance to water flow. The membrane porosity decreased gradually from bottom to top, and the neighboring small pores were interconnected. At low NCC content, only a small amount of ultrafine NCC loaded on EVOH nanofiber membrane surface and in the voids. With the increasing of the NCC content, NCC began to accumulate on the nanofiber membrane surface, and formed a NCC dense layer gradually. As shown in Fig. 2d, f and h, in the surface of N-2, there appeared obvious EVOH nanofibers, almost the NCC were loaded in the voids, while in the surface of N-3, there covered smooth NCC, and the coating layer seemed more obvious in the surface of N-4. Finally, NCC/EVOH/PET sandwich-style membrane was fabricated via coating and deposition the barrier layer (NCC) on the surface of EVOH nanofiber membrane scaffold supported on PET nonwoven fabric. NCC layer as a barrier layer has small and uniform pore size. In addition, according to the section picture, the NCC only filled the voids on the surface of membrane, and reduced the surface pore size but not affect the continuous pore structure.
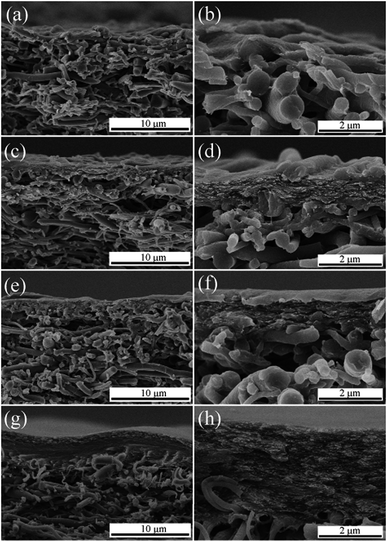 | ||
| Fig. 2 SEM images of cross sectioned NCC/EVOH nanofiber composite membrane (a) and (b) N-1, (c) and (d) N-2, (e) and (f) N-3, (g) and (h) N-4. | ||
3.2 Wettability of NCC/EVOH composite nanofiber membrane
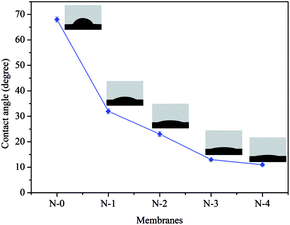
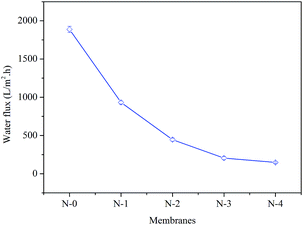
Water contact angle is one of the important judgments for the surface wettability of membrane material to water. The higher affinity of water to hydrophilic membrane surface can be prone to the formation of hydration layer on the membrane surface, which may reduce membrane fouling by preventing hydrophobic components.41 Fig. 3 shows the water contact angles of N/E-NCMs with various NCC content. With the increasing of NCC content, the water contact angle of composite membrane decreased gradually. EVOH nanofiber membrane without NCC showed hydrophilicity to water droplets, forming a contact angle of 68°. The water contact angles of N-1, N-2, N-3, N-4 membranes were 32°, 23°, 13°, 11°, respectively, which was attributed to the nanocellulose crystals with small size and large surface area possessed abundant hydroxyl. This remarkable enhancement in the hydrophilicity could improve the water permeability of membrane material.3.3 Pore size and pore size distribution
Pore size and pore size distribution are the important parameters of membrane material and play a critical role in the application. PET plays a supporting role in the NCC/EVOH nanofibers composite membrane, and EVOH nanofibers is the key filtering material, NCC forming the NCC barrier layer in N-4 is for enhancing the hydrophilicity and as a barrier layer. Fig. 4 displays the pore size and pore size distribution of N/E-NCM with various NCC contents. It is worth noting that the pore size of N-1 membrane was shown in the range of 0.15–1.10 μm, and decreased with the increasing of NCC contents. In addition, 80% present of the pores are concentrated between 0.15–0.50 μm. Table 1 summarized the maximum pore size, mean pore size and minimum pore size. As listed in Table 1, the average pore size of N-0, N-1, N-2, N-3, N-4 membranes were 0.38 μm, 0.32 μm, 0.29 μm, 0.24 μm, 0.22 μm, respectively. It can be seen from Fig. 2h that the thickness of NCC was less than 2 μm, while the thickness of EVOH nanofiber membranes in this work were about 100 μm. The average diameter of EVOH nanofiber was about 300 nm, a large number of EVOH nanofibers formed dense microfiltration membrane with small pore size (0.38 μm). After coating and deposition a very thin NCC film compared to EVOH nanofiber membranes on the surface of EVOH nanofiber membrane, result in the average pore size decreased from 0.38 μm to 0.22 μm, maximum pore size decreased from 1.28 μm to 0.78 μm, minimum pore size decreased from 0.2 μm to 0.1 μm. It is clearly visible that the adding of NCC reduced the pore size gradually because of the small diameter of NCC, making N/E-NCM a good candidate for filtration.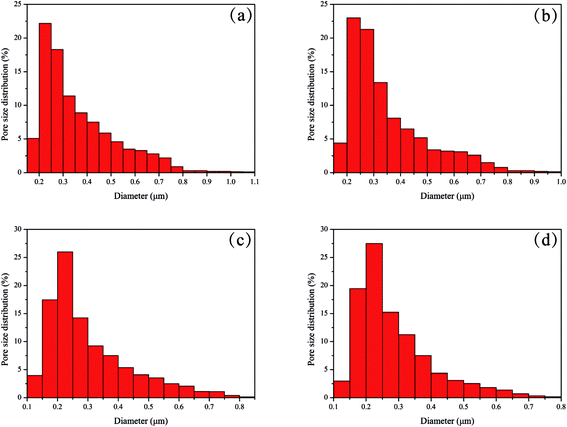 | ||
| Fig. 4 The pore size distribution of NCC/EVOH nanofiber composite membrane (a) N-1, (b) N-2, (c) N-3, (d) N-4. | ||
| Sample | Maximum pore size (μm) | Mean pore size (μm) | Minimum pore size (μm) |
|---|---|---|---|
| N-0 | 1.28 | 0.38 | 0.20 |
| N-1 | 1.06 | 0.32 | 0.18 |
| N-2 | 0.97 | 0.29 | 0.17 |
| N-3 | 0.84 | 0.24 | 0.13 |
| N-4 | 0.78 | 0.22 | 0.10 |
3.4 Stress–strain properties
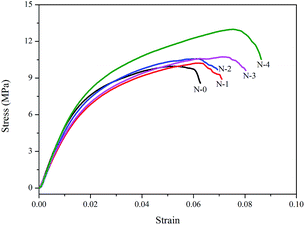
The mechanical property was also a significant factor in water filtration. The typical tensile stress–strain curves of N/E-NCM with various NCC contents were shown in Fig. 5. It is clearly shown that tensile stress of N/E-NCMs increased gradually with the increasing of NCC contents as expected. As I mentioned in the above, the NCC film on the surface of EVOH nanofiber membrane compared to EVOH nanofiber membranes was quite thin, so there was no dramatic increase. The N-0, N-1, N-2, N-3, N-4 membranes possessed the tensile stress of 9.969, 10.222, 10.573, 10.736 and 12.991 MPa, which could be owing to the strengthening interaction from hydrogen bond exiting between nanofibers and NCCs.3.5 Water flux
3.6 The performance of oil–water separation
In the present work, the oil–water separation experiments were carried out to systematically study the relation between the structure of N/E-NCM and filtration performance, and evaluate filtration capability of N/E-NCM. The water flux device designed by ourselves was used to examine the rejection rate of the membrane to oil–water emulsion. Fig. 8 revealed the UV absorption spectrogram of the oil–water emulsion before and after filtration by N/E-NCM and reference membrane. As shown in Fig. 8, the absorbance of oil–water emulsion after filtration dropped seriously by N-3 and N-4, and closed to 0.01. According to the eqn (2), the results revealed that the N-4 rejection rate to oil–water emulsion was above 99.5%. In addition, water flux of N/E-NCM and reference film during the oil–water separation process was investigated, and all the results were shown in Fig. 9. It is obvious that the flux recovery rate and the rejection rate of N/E-NCM were 44.5% and 99.5%, higher than those of the reference film, which were 8.0% and 86.6%. In combination with the good mechanical properties and high filtration performance, it is feasible to achieve a low cost and versatile nanofibers based oil–water emulsion filtration membrane.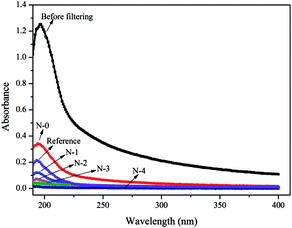 | ||
| Fig. 8 UV absorption spectrogram of oil–water emulsion before and after filtering by NCC/EVOH composite nanofiber membranes and reference membrane. | ||
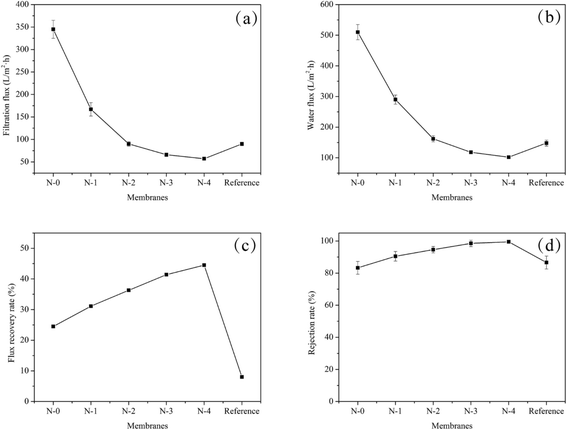 | ||
| Fig. 9 Filtering effect of NCC/EVOH composite nanofiber membranes and reference film for oil–water emulsion at 0.1 MPa. | ||
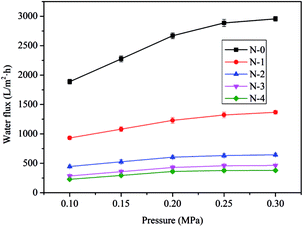
Nevertheless, the N/E-NCM had high rejection rate of 99.5% at 0.1 MPa operating pressure, while the filtration flux was merely 57 L m−2 h−1, affecting the operating rate. In order to improve the operating rate, the experiment was also carried out to investigate the effect of the operating pressure on the filtration flux, and the results were shown in Table 2. It could be seen that the filtration flux of N/E-NCM increased gradually with the operating pressure increasing from 0.1 MPa to 0.2 MPa. However, as the pressure further increased, the filtration flux of N/E-NCM decreased. Previous lectures suggested that the filtration flux of separation membrane linearly increased with increasing the filtration pressure in a certain range. While the filtration pressure beyond the range, the filtration flux tends to decrease owing to the filter cake and the membrane pore blockage formed on the membrane surface due to concentration polarization.45 It is worth noting that the filtration rate of prepared membranes for oil–water emulsion was above 99%. Thus the operating pressure could be increased properly, and the operation pressure of 0.2 MPa was optimized to increase filtration rate.
| Operating pressure (MPa) | Water flux before separation (L m−2 h−1) | Filtration flux (L m−2 h−1) | Water flux after separation (L m−2 h−1) | Flux recovery rate (%) | Rejection rate (%) |
|---|---|---|---|---|---|
| 0.10 | 229 | 57 | 102 | 44.5 | 99.5 |
| 0.15 | 295 | 86 | 142 | 48.1 | 99.4 |
| 0.20 | 361 | 112 | 176 | 48.8 | 99.4 |
| 0.25 | 378 | 109 | 173 | 45.8 | 99.6 |
4. Conclusion
NCC/EVOH nanofiber composite membranes (N/E-NCM) were prepared by deposition NCC on the surface of EVOH nanofiber membrane, which was prepared by the melt blending extrusion method. The basic structure properties and oil–water separation performance of composite membranes were investigated. The results shown that the deposited NCC filled on the surface of nanofiber membrane and a little in the voids formed a barrier layer with small pore size, and had no effect on the continuous pore structure of membrane. With the increasing of NCC content, the composite membranes showed an increase of tensile strength (from 9.969 MPa to 12.991 MPa) and a decrease of contact angle, pore size, and water flux. The water flux and filtration flux of composite membrane could be improved within a certain range by increasing the operation pressure. The N/E-NCM exhibited a higher rejection rate (99.5%) and stability of filtration flux than unmodified EVOH nanofiber membrane and the commercial micro-filtration membrane for the separation of oil–water emulsion. The results indicated that the combination of NCC and EVOH nanofiber membrane making N/E-NCM a good candidate for oil–water emulsion separation.Acknowledgements
This research was supported by the National Natural Science Foundation of China (No. 21374015), and the program of Introducing Talents of Discipline to Universities (No. 111-2-04).References
- T. A. Pagano and T. Evans, Oil Gas J., 2010, 108, 104–110 CAS.
- A. Szép and R. Kohlheb, Water Sci. Technol., 2010, 62, 2372–2380 CrossRef PubMed.
- D. Bhagawan, S. Poodari, S. Golla, V. Himabindu and S. Vidyavathi, Desalin. Water Treat., 2016, 57, 3387–3394 CrossRef CAS.
- X. Zhu, W. Tu, K.-H. Wee and R. Bai, J. Membr. Sci., 2014, 466, 36–44 CrossRef CAS.
- C. E. Clark and J. A. Veil, Geosciences, 2009, DOI:10.2172/1007397.
- A. Idris, I. Ahmed and H. W. Jye, Water Sci. Technol., 2007, 169–177 CrossRef CAS PubMed.
- J. Saththasivam, K. Loganathan and S. Sarp, Chemosphere, 2016, 144, 671–680 CrossRef CAS PubMed.
- M. Obaid, N. A. M. Barakat, O. A. Fadali, M. Motlak, A. A. Almajid and K. A. Khalil, Chem. Eng. J., 2015, 259, 449–456 CrossRef CAS.
- A. Salahi and T. Mohammadi, Water Sci. Technol., 2010, 62, 245–255 CrossRef CAS PubMed.
- J. G. Fernandes, D. M. Correia, G. Botelho, J. Padrão, F. Dourado, C. Ribeiro, S. Lanceros-Méndez and V. Sencadas, Polym. Test., 2014, 34, 64–71 CrossRef CAS.
- X.-J. Han, Z.-M. Huang, C. Huang, Z.-F. Du, H. Wang, J. Wang, C.-L. He and Q.-S. Wu, Polym. Compos., 2012, 33, 2045–2057 CrossRef CAS.
- Y. Liu, M. Park, H. K. Shin, B. Pant, S.-J. Park and H.-Y. Kim, Mater. Lett., 2014, 132, 23–26 CrossRef CAS.
- H. Wang, P. Zhang, X. Ma, S. Jiang, Y. Huang, L. Zhai and S. Jiang, J. Hazard. Mater., 2014, 265, 158–165 CrossRef CAS PubMed.
- B. Vazquez, H. Vasquez and K. Lozano, Polym. Eng. Sci., 2012, 52, 2260–2265 CAS.
- A. Valipouri, S. A. H. Ravandi and A. R. Pishevar, Fibers Polym., 2013, 14, 941–949 CrossRef CAS.
- L. Ren, R. Ozisik and S. P. Kotha, J. Colloid Interface Sci., 2014, 425, 136–142 CrossRef CAS PubMed.
- M. A. Hammami, M. Krifa and O. Harzallah, J. Text. Inst., 2014, 105, 637–647 CrossRef CAS.
- Y. Lu, Y. Li, S. Zhang, G. Xu, K. Fu, H. Lee and X. Zhang, Eur. Polym. J., 2013, 49, 3834–3845 CrossRef CAS.
- J. Zhao, W. Han, H. Chen, M. Tu, R. Zeng, Y. Shi, Z. Cha and C. Zhou, Carbohydr. Polym., 2011, 83, 1541–1546 CrossRef CAS.
- J. Shao, C. Chen, Y. Wang, X. Chen and C. Du, React. Funct. Polym., 2012, 72, 765–772 CrossRef CAS.
- J. Shao, C. Chen, Y. Wang, X. Chen and C. Du, Appl. Surf. Sci., 2012, 258, 6665–6671 CrossRef CAS.
- A. Lu, J. Zhu, G. Zhang and G. Sun, J. Mater. Chem., 2011, 21, 18674 RSC.
- M. Li, X. Xue, D. Wang, Y. Lu, Z. Wu and H. Zou, Desalination, 2013, 329, 50–56 CrossRef CAS.
- M. Li, R. Xiao and G. Sun, J. Appl. Polym. Sci., 2012, 124, 28–36 CrossRef CAS.
- D. Wang, G. Sun and B.-S. Chiou, Macromol. Mater. Eng., 2007, 292, 407–414 CrossRef CAS.
- D. Xu, K. Zhu, X. Zheng and R. Xiao, Ind. Eng. Chem. Res., 2015, 54, 6836–6844 CrossRef CAS.
- H. Wang and R. Xiao, Polym. Adv. Technol., 2012, 23, 508–515 CrossRef CAS.
- P. Zhang, D. Xu and R. Xiao, J. Appl. Polym. Sci., 2015, 132, 42184 Search PubMed.
- X. Lin, M. Yang, H. Jeong, M. Chang and J. Hong, J. Membr. Sci., 2016, 506, 22–30 CrossRef CAS.
- H. Zhu and Z. Guo, J. Bionic Eng., 2016, 13, 1–29 CrossRef.
- Y. Zhu, F. Zhang, D. Wang, X. F. Pei, W. Zhang and J. Jin, J. Mater. Chem., 2013, 1, 5758–5765 RSC.
- L. Zhang, Y. Zhong, D. Cha and P. Wang, Sci. Rep., 2013, 3, 670–692 Search PubMed.
- F. E. Ahmed, B. S. Lalia, N. Hilal and R. Hashaikeh, Desalination, 2014, 344, 48–54 CrossRef.
- L. Brinchi, F. Cotana, E. Fortunati and J. M. Kenny, Carbohydr. Polym., 2013, 94, 154–169 CrossRef CAS PubMed.
- J. Lamaming, R. Hashim, O. Sulaiman, C. P. Leh, T. Sugimoto and N. A. Nordin, Carbohydr. Polym., 2015, 127, 202–208 CrossRef CAS PubMed.
- J. P. F. Lagerwall, C. Schütz, M. Salajkova, J. Noh, J. Hyun Park, G. Scalia and L. Bergström, NPG Asia Mater., 2014, 6, 80 CrossRef.
- S. Fujisawa, T. Saito, S. Kimura, T. Iwata and A. Isogai, Biomacromolecules, 2013, 14, 1541–1546 CrossRef CAS PubMed.
- V. Rubentheren, T. A. Ward, C. Y. Chee and P. Nair, Cellulose, 2015, 22, 2529–2541 CrossRef CAS.
- H.-M. Ng, L. T. Sin, T.-T. Tee, S.-T. Bee, D. Hui, C.-Y. Low and A. R. Rahmat, Composites, Part B, 2015, 75, 176–200 CrossRef CAS.
- N. Rescignano, E. Fortunati, S. Montesano, C. Emiliani, J. M. Kenny, S. Martino and I. Armentano, Carbohydr. Polym., 2014, 99, 47–58 CrossRef CAS PubMed.
- X. Zhu, W. Tu, K.-H. Wee and R. Bai, J. Membr. Sci., 2014, 466, 36–44 CrossRef CAS.
- M. Li, D. Wang, R. Xiao, G. Sun, Q. Zhao and H. Li, Sep. Purif. Technol., 2013, 116, 199–205 CrossRef CAS.
- X. Zhang, B. Lin, K. Zhao, J. Wei, J. Guo, W. Cui, S. Jiang, D. Liu and J. Li, Desalination, 2015, 365, 234–241 CrossRef CAS.
- R. Wang, Y. Liu, B. Li, B. S. Hsiao and B. Chu, J. Membr. Sci., 2012, 392–393, 167–174 CrossRef CAS.
- C. Tang and V. Chen, Desalination, 2002, 143, 11–20 CrossRef CAS.
Footnote |
| † Electronic supplementary information (ESI) available. See DOI: 10.1039/c6ra26068c |
| This journal is © The Royal Society of Chemistry 2017 |

