DOI:
10.1039/C6RA25230C
(Paper)
RSC Adv., 2017,
7, 927-938
Sorption of perfluorooctane sulfonate and perfluorooctanoate on polyacrylonitrile fiber-derived activated carbon fibers: in comparison with activated carbon†
Received
14th October 2016
, Accepted 8th December 2016
First published on 4th January 2017
Abstract
Polyacrylonitrile fiber (PANF)-derived activated carbon fibers (PACFs) were successfully prepared using a one step carbonation–activation, and were used for the sorption of perfluorooctane sulfonate (PFOS) and perfluorooctanoate (PFOA). High specific surface areas (SSAs) of 1782 m2 g−1 and micro/mesoporous structures of the PACFs were obtained by optimizing the preparation conditions of the PANF-based pre-oxidized fibers (PANOFs)/KOH ratio of 1![[thin space (1/6-em)]](https://www.rsc.org/images/entities/char_2009.gif) :
:![[thin space (1/6-em)]](https://www.rsc.org/images/entities/char_2009.gif) 2 and an activation temperature of 800 °C. The as-prepared PACFs exhibited flexibility and endless forms, and sorption capacities of 1.52 mmol g−1 for PFOS and 0.73 mmol g−1 for PFOA, much higher than the commercially available coal-based powder activated carbon (PAC) and granular activated carbon (GAC), which was also indicated by the site energy distributions. The sorption system followed a pseudo-second-order kinetic model and a Freundlich isotherm model. The intra-particle diffusion and Boy’s film-diffusion models were also used to verify that intra-particle diffusion is the main rate-controlling step. It was assumed that the multilayer sorption most probably occurs through electrostatic attraction and hydrophobic interaction, and some micelles and hemi-micelles form on the ACF surfaces. The PACFs show good reusability over five sorption–desorption cycle studies.
2 and an activation temperature of 800 °C. The as-prepared PACFs exhibited flexibility and endless forms, and sorption capacities of 1.52 mmol g−1 for PFOS and 0.73 mmol g−1 for PFOA, much higher than the commercially available coal-based powder activated carbon (PAC) and granular activated carbon (GAC), which was also indicated by the site energy distributions. The sorption system followed a pseudo-second-order kinetic model and a Freundlich isotherm model. The intra-particle diffusion and Boy’s film-diffusion models were also used to verify that intra-particle diffusion is the main rate-controlling step. It was assumed that the multilayer sorption most probably occurs through electrostatic attraction and hydrophobic interaction, and some micelles and hemi-micelles form on the ACF surfaces. The PACFs show good reusability over five sorption–desorption cycle studies.
1. Introduction
Perfluorinated compounds (PFCs) are a series of anthropogenic organofluorine compounds with each hydrogen atom on the alkyl chain replaced by a fluorine atom.1 The unique amphiphilic properties of some PFCs compared to conventional hydrocarbons enable them to be widely applied in various areas such as paper and fabric protection, fire fighting foams, chromium plating, semiconductors and photolithography.1,2 As two of the most typical PFC pollutants, perfluorooctane sulfonate (PFOS) and perfluorooctanoate (PFOA) have been added to the limited/forbidden list of the Stockholm Convention on Persistent Organic Pollutants due to their persistence, bioaccumulation and the difficulty of their degradation in the environment on account of the high bond energy (approximately 110 kcal mol−1) of the C–F bond in fluorocarbons.3 In drinking water, although the U.S Environmental Protection Agency (USEPA) set a “provisional health advisory” of 0.2 μg L−1 for PFOS and 0.4 μg L−1 for PFOA as safe levels,4 they are still allowed to be used for some special industries and some developing countries have not expressly restricted the use of PFCs. PFOS concentrations at mg L−1 level were detected in groundwater collected from American military bases where aqueous film-forming foams were used for fire-fighting activities.5 Furthermore, an extremely high PFOS concentration up to 1650 mg L−1 has been detected from a semiconductor manufacturer’s wastewater.6 Considering this situation, it remains necessary to develop effective techniques to remove PFOS and PFOA from surface water and wastewater.
In recent years, several traditional solutions including coagulation,7 biological degradation,8 and novel technologies such as photocatalysis,3 ball milling9 and sonolysis10 have been proposed to remove PFOS and/or PFOA. While their inherent weaknesses such as specific equipment, high energy consumption and inefficiency are still big challenges. Sorption has been proven to be one of the most cost-effective processes, and some adsorbents have been chosen for the removal of PFOS and PFOA, such as boehmite,11 alumina,12 activated carbon,13 resin,13 activated sludge,14 carbon nanotubes,15 montmorillonites,16 chitosan-based molecularly imprinted polymer,17 crosslinked chitosan beads,18 aminated rice husks,19 mesoporous carbon nitride,20 etc. In consideration of actual applications, a low-cost carbon material is preferred. Powdered activated carbons (PACs) have a higher sorption capacity and a faster sorption velocity for PFOS and PFOA than the granular activated carbon (GAC) in previous reports.13 But its own characteristics such as the difficult separation and the non-uniform distribution of powder, have hampered its use in large-scale operations. Therefore, it is valuable to develop alternative carbon-based adsorbents. Activated carbon fibers (ACFs) offer flexibility and endless forms, that do not apply to the usual powdered or granular materials, and are considered promising materials due to their chemical and thermal stabilities, high specific surface areas (SSAs), controlled pore distribution, easy scale-up and separation, and the absence of maldistribution. They have already been used as adsorbents in the fields of water treatment, gas sorption and storage.
Unlike other approaches for the preparation of ACFs, using polyacrylonitrile fibers (PANFs) as the precursors followed by stabilization, carbonization and activation is a straightforward and convenient route to make continuous ACFs because of the superior mechanical properties and high carbon yield. To the best of our knowledge, there are some reports about using bamboo or other biomass materials as precursors to prepare GAC and investigating its application in the adsorption of PFOS and PFOA. The sorption was found to be dramatically influenced by the morphology and surface chemical characteristics of the adsorbents from different preparation procedures,21 whereas no information is available about the ACFs derived from PANFs for PFOS and PFOA sorption. In the study, the influence of a one step carbonation–activation process on the structures of PANF-derived ACFs (PACFs) was optimized to produce a high adsorption capacity for PFOS and PFOA. The batch sorption experiments including kinetics, isotherms, effect of solution pH and C–F chain length of PFOS on the PACFs were studied in comparison with those of the commercially available GAC and PAC. The possible interactions between the PACFs and PFOS and PFOA were also discussed, and the sorption site energy was analyzed to provide a better understanding of the average sorption site energy and heterogeneity shown from different carbon materials. Finally, suitable regeneration agents were chosen to successfully regenerate the spent PACFs and this indicated a good reusability of the PANF-derived PACFs.
2. Materials and methods
2.1 Chemicals and materials
Perfluorooctane sulfonate (PFOS, potassium salt), perfluorooctanoate (PFOA, sodium salt) perfluorohexane sulfonate (PFHxS, potassium salt) and perfluorobutane sulfonate (PFBS, potassium salt) were purchased from Aladdin (China), and their properties are summarized in Table 1. Polyacrylonitrile fibers (PANFs) were obtained from Longbang polymer fiber Co., Ltd. (China) (characteristic parameters are given in the ESI†), the commercially available coal-based PAC (particles below 0.1 mm), GAC (particles range of 0.9–1.0 mm) and other chemicals were obtained from Sinopharm Chemical Reagent Co. Ltd. (China). The PAC and GAC were first rinsed with deionized water several times and then washed in 90 °C deionized water for 2 h to remove the impurities, finally, they were dried in an oven at 105 °C for 48 h. Other chemicals were of analytical grade and were used as received without further purification.
Table 1 Physicochemical properties of the typical PFCs used in this study
| Perfluorinated compounds |
Abbr. |
Chemical formula |
Mol. weight (g mol−1) |
Solubility (g L−1) |
pKa |
log![[thin space (1/6-em)]](https://www.rsc.org/images/entities/char_2009.gif) Kow Kow |
| Perfluorooctane sulfonate |
PFOS |
C8F17SO3K |
538 |
0.57 |
−3.27 |
5.26 |
| Perfluorooctanoate |
PFOA |
C7F15COONa |
436 |
3.4 |
−0.5 to 3.8 |
4.59 |
| Perfluorohexane sulfonate |
PFHxS |
C6F13SO3K |
438 |
1.4 |
0.14 |
4.34 |
| Perfluorobutane sulfonate |
PFBS |
C4F9SO3K |
214 |
46.2 |
0.14 |
2.73 |
2.2 Preparation of PACFs
The PANFs were stabilized by heating to 230 °C at a rate of 10 K h−1 through a hot air cyclic heating mode and were maintained at this temperature for 1 h under tension. The stabilized PANOFs were impregnated using KOH solution at PANOFs/KOH mass ratios of 1![[thin space (1/6-em)]](https://www.rsc.org/images/entities/char_2009.gif) :
:![[thin space (1/6-em)]](https://www.rsc.org/images/entities/char_2009.gif) 1–1
1–1![[thin space (1/6-em)]](https://www.rsc.org/images/entities/char_2009.gif) :
:![[thin space (1/6-em)]](https://www.rsc.org/images/entities/char_2009.gif) 3 overnight, taken out and underwent one step carbonation and activation under 700, 750, 800, 850 and 900 °C at an increasing rate of 5 K min−1, they were held for 1 h under a N2 atmosphere. Finally, the as-prepared PACFs were washed with distilled water repeatedly until the wash water was neutral and then they were dried at 105 °C for 12 h (characteristic parameters of the as-prepared PACFs under optimized conditions are given in the ESI†).
3 overnight, taken out and underwent one step carbonation and activation under 700, 750, 800, 850 and 900 °C at an increasing rate of 5 K min−1, they were held for 1 h under a N2 atmosphere. Finally, the as-prepared PACFs were washed with distilled water repeatedly until the wash water was neutral and then they were dried at 105 °C for 12 h (characteristic parameters of the as-prepared PACFs under optimized conditions are given in the ESI†).
2.3 Characterization of the PACFs, PAC and GAC
The SSAs and pore size distribution of the PACFs, PAC and GAC were characterized using N2 adsorption at 77 K in a gas adsorption instrument (ASAP 2020, Micromeritics, USA). Before each measurement, the sample was out gassed at 200 °C for 12 h in vacuum. SSAs were calculated with the Brunauer–Emmett–Teller (BET) equation from the N2 adsorption data in the relative pressure (P/P0) range of 0.01–0.25. The pore-sized distribution was obtained according to the non-local density functional theory. Raman spectra were recorded using a Renishaw Micro-Raman system 2000 spectrometer with a He–Ne laser excitation system. The functional groups on the PACFs before and after the sorption process were investigated using Fourier transform infrared (FTIR) spectroscopy (supplied by M/s, PerkinElmer, Connecticut, USA; model: Spectrum 100). The surface morphology of the PACFs, PAC and GAC were analyzed using scanning electron microcopy (SEM, Hitachi S-4800). Zeta potentials of the PACFs, PAC and GAC at different pH were measured with a zeta potential instrument (Delsa Nano C, Beckman Coulter, USA). The PACFs, PAC and GAC were dispersed in 1.0 mM KCl solution using sonication for 30 min, following the adjustment of the solution pH with NaOH and HCl solution in the range of 2.0–10.0, respectively. Finally, the zeta potential values at different pH were measured.
2.4 Sorption and regeneration experiments
Batch sorption experiments were carried out at 180 rpm in an orbital shaker with 0.01 g of the PACFs, PAC or GAC in the 150 mL polypropylene copolymer (PPCO) Nalgene narrow-mouth bottle, containing 100 mL of PFOS or PFOA solution at 25 °C, used due to its good resistance to perfluoroalkyl acids.12 In the investigation of the sorption kinetics, the initial solution pH was 5.0, and the initial concentrations of PFOS and PFOA were both 100 mg L−1. During the adsorption process, 1 mL of the sample was collected from the flask at set time intervals, the PFOS/PFOA concentration in the solution was determined and the sorption amount qt (mmol g−1) at that time was calculated using eqn (1):| |
 | (1) |
where C0 (mmol L−1) is the initial concentration of the PFOS/PFOA in the solution, Ct (mmol L−1) is the concentration of the PFOS/PFOA in the solution at the time of collection t (h); V (L) is the volume of the solution and m (g) is the weight of the PACFs/PAC/GAC.
The sorption isotherm experiments were conducted in solution at pH 5.0 with initial PFOS/PFOA concentrations ranging from 20–300 mg L−1. Sorption equilibrium amount qe (mmol g−1) was calculated using eqn (2):
| |
 | (2) |
where
Ce (mmol L
−1) is the equilibrium concentration of the PFOS/PFOA in solution, and the other parameters are defined in
eqn (1).
In the investigation of the pH effect, the initial concentrations of PFOS and PFOA were both 100 mg L−1 and the solution pH was adjusted in the range 2.0–10.0. Since solution pH did not change during the adsorption process, no pH adjustment was conducted during the adsorption process. In the studies of C–F chain length effect, the initial solution pH was 5.0, and the initial concentrations of PFOS, PFHxS and PFBS were all 100 mg L−1. After the sorption experiment was conducted at the same sorption kinetics conditions, the spent PACFs was put into 100 mL of different agent solutions at 180 rpm in an orbital shaker for 48 h. The sorption–regeneration cycles were conducted under the same sorption conditions mentioned above.
2.5 Analytical methods
PFOS, PFOA, PFHxS and PFBS measurements were conducted according to the method reported by Yu et al.13 Simply, after the sorption and regeneration experiments, the supernatant was filtered using a 0.22 μm nylon membrane. The control experiments indicated that the sorption of typical PFCs used in this study on the membrane were negligible due to their high concentrations in solution. An e2695-HPLC with a 432 conductivity detector from Waters (USA) and an XBridge-C18 column (4.6 mm × 250 mm) from Agilent Technologies (USA) were adopted to determine the concentrations in aqueous solution. A mixture of methanol/0.02 M NaH2PO4 (75/25 or 65/35, v/v) was used as the mobile phase at a 1.0 mL min−1 flow rate and the sample volume injected was 20 μL.
3. Results and discussion
3.1 Morphology and Raman spectra of the adsorbents
Fig. 1 presents digital photos and SEM images of the PANFs (a), PANOFs (b), and PACFs (c), compared to the SEM images of PAC (d) and GAC (e). The PANFs exhibit a clean and uniform surface with a long and smooth fibrous morphology, with an average diameter of 17.05 μm. In order to prevent melting or fusion of the PANFs, to avoid excessive volatilization of elemental carbon in the subsequent carbonization step and thereby to maximize the ultimate carbon yield from the PANFs precursor, the stabilization process is required, which contains a number of reactions, namely cyclization, hydrogenation, oxidation and other specific pyrolysis reactions.22 The morphologies of the PANOFs are observed in Fig. 1(b). There is about a 28% decrease for the average diameter (average of 50 measurements) compared to the PANFs, and there is no distinct defect in its surface. After the one step carbonation and activation at the PANOFs/KOH mass ratio of 1![[thin space (1/6-em)]](https://www.rsc.org/images/entities/char_2009.gif) :
:![[thin space (1/6-em)]](https://www.rsc.org/images/entities/char_2009.gif) 2 at 800 °C, no significant change for the average diameter is noted, some pores and distinct defects can be observed compared with random structures for the PAC and GAC, which may be mainly responsible for the PFOS and PFOA sorption.
2 at 800 °C, no significant change for the average diameter is noted, some pores and distinct defects can be observed compared with random structures for the PAC and GAC, which may be mainly responsible for the PFOS and PFOA sorption.
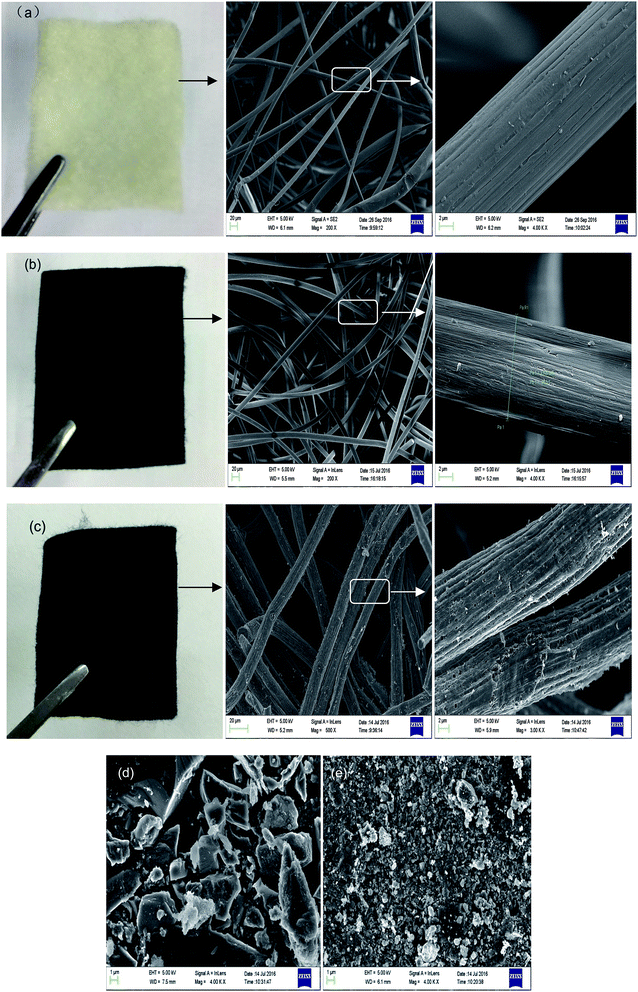 |
| | Fig. 1 Digital photos and SEM images of PANFs (a), PANOFs (b), PACFs (c), compared to the SEM images of PAC (d) and GAC (e). | |
The Raman spectra of the PACFs, PAC and GAC are shown in Fig. 2. The same typical features of carbon materials with the D band around 1325 cm−1 and the G band around 1580 cm−1 are shown. Where the D band is characteristic for the defects and disordered carbon and the G band is related to the ordered graphitic crystallites of carbon. There are three different kinds of peak strengths of the D and G bands among these carbon materials. Compared with the weak D band of PAC and weak G band of GAC, the PACFs shows comparable D and G bands, indicative of a high carbon yield, and fair amounts between amorphous carbons and ordered graphitic crystallites of carbon on the surface of the PACFs.
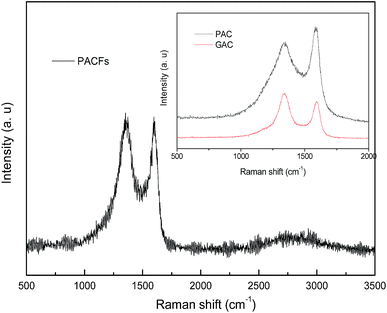 |
| | Fig. 2 The Raman spectra of the PACFs, PAC and GAC samples. | |
3.2 Preparation of the PANF-derived PACFs
After the cross-linking of the PAN chains and preparing a structure that can withstand the subsequent rigors of the etching and high temperature processing through the pre-oxidative stabilization, the parameters of the one step carbonation–activation process have significant effects on the SSAs and pore size distribution of the PANF-derived PACFs, which are closely related to their sorption behaviors. As shown in Fig. 3, the SSAs and adsorbed amounts of PFOS on the PACFs increased rapidly with increasing PANOFs/KOH ratio until 1![[thin space (1/6-em)]](https://www.rsc.org/images/entities/char_2009.gif) :
:![[thin space (1/6-em)]](https://www.rsc.org/images/entities/char_2009.gif) 2, and then decreased with increasing KOH proportionally. Due to the excessive etching effect of KOH, localized collapses of the as-prepared PACFs and SSA decreases were observed, a PANOFs/KOH ratio of 1
2, and then decreased with increasing KOH proportionally. Due to the excessive etching effect of KOH, localized collapses of the as-prepared PACFs and SSA decreases were observed, a PANOFs/KOH ratio of 1![[thin space (1/6-em)]](https://www.rsc.org/images/entities/char_2009.gif) :
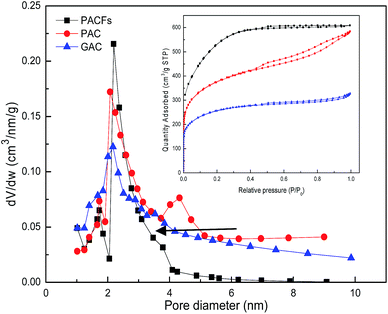
:![[thin space (1/6-em)]](https://www.rsc.org/images/entities/char_2009.gif) 2 was selected to prepare the PACFs. In the activation process, the changes of activation temperature can disproportionately affect the reaction between KOH and PANOFs as can be seen in Fig. 4. The PACFs obtained under 800 °C were used in the subsequent sorption experiments. Fig. 5 shows the pore distribution curves and the N2 sorption–desorption isotherms of the PACFs under the optimal conditions, as well as commercial PAC and GAC. The typical N2 hysteresis loops of the three carbon materials all at P/P0 > 0.4 suggest the presence of both mesopores and micropores,23 which can be also observed in Table 2. Through the PFOS adsorbed and the structure parameter comparisons among PACFs at PANOFs/KOH ratios of 1
2 was selected to prepare the PACFs. In the activation process, the changes of activation temperature can disproportionately affect the reaction between KOH and PANOFs as can be seen in Fig. 4. The PACFs obtained under 800 °C were used in the subsequent sorption experiments. Fig. 5 shows the pore distribution curves and the N2 sorption–desorption isotherms of the PACFs under the optimal conditions, as well as commercial PAC and GAC. The typical N2 hysteresis loops of the three carbon materials all at P/P0 > 0.4 suggest the presence of both mesopores and micropores,23 which can be also observed in Table 2. Through the PFOS adsorbed and the structure parameter comparisons among PACFs at PANOFs/KOH ratios of 1![[thin space (1/6-em)]](https://www.rsc.org/images/entities/char_2009.gif) :
:![[thin space (1/6-em)]](https://www.rsc.org/images/entities/char_2009.gif) 1 and 1
1 and 1![[thin space (1/6-em)]](https://www.rsc.org/images/entities/char_2009.gif) :
:![[thin space (1/6-em)]](https://www.rsc.org/images/entities/char_2009.gif) 3, and that of the PAC evaluated in the following section, the results exhibit the sorption abilities of these three kinds of carbon materials for PFOS were not completely consistent with their SSAs, and their effective available mesopores were also important for PFOS sorption due to the molecular lengths of PFOS and PFOA being 1.32 and 1.20 nm, respectively.
3, and that of the PAC evaluated in the following section, the results exhibit the sorption abilities of these three kinds of carbon materials for PFOS were not completely consistent with their SSAs, and their effective available mesopores were also important for PFOS sorption due to the molecular lengths of PFOS and PFOA being 1.32 and 1.20 nm, respectively.
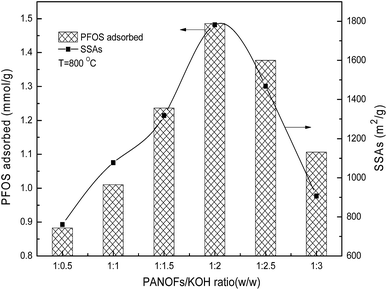 |
| | Fig. 3 Effects of impregnation PANOFs/KOH ratio on PFOS sorption and SSAs. | |
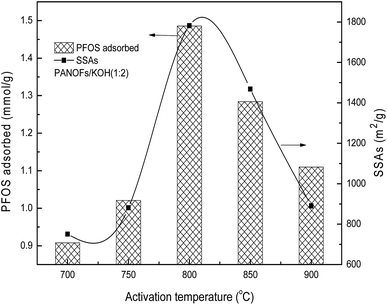 |
| | Fig. 4 Effects of activation temperature on PFOS sorption and SSAs. | |
 |
| | Fig. 5 Pore distribution curves and N2 sorption–desorption isotherms of PACFs, PAC and GAC. | |
Table 2 Pore structure parameters of PAC, GAC and PACFs obtained from different preparation conditions
| |
SBET (m2 g−1) |
Vtotal (cm3 g−1) |
Vmeso (cm3 g−1) |
Vmicro (cm3 g−1) |
| PANOFs/KOH mass ratio (w/w) |
Activation temperature 800 °C |
1![[thin space (1/6-em)]](https://www.rsc.org/images/entities/char_2009.gif) : :![[thin space (1/6-em)]](https://www.rsc.org/images/entities/char_2009.gif) 1 1 |
1077.55 |
0.58 |
0.22 |
0.36 |
1![[thin space (1/6-em)]](https://www.rsc.org/images/entities/char_2009.gif) : :![[thin space (1/6-em)]](https://www.rsc.org/images/entities/char_2009.gif) 2 2 |
1781.59 |
0.94 |
0.81 |
0.13 |
1![[thin space (1/6-em)]](https://www.rsc.org/images/entities/char_2009.gif) : :![[thin space (1/6-em)]](https://www.rsc.org/images/entities/char_2009.gif) 3 3 |
906.61 |
0.79 |
0.54 |
0.25 |
| Activation temperature (°C) |
PANOFs/KOH mass ratio (1![[thin space (1/6-em)]](https://www.rsc.org/images/entities/char_2009.gif) : :![[thin space (1/6-em)]](https://www.rsc.org/images/entities/char_2009.gif) 2) 2) |
700 |
750.24 |
0.33 |
0.12 |
0.28 |
| 800 |
1781.59 |
0.94 |
0.81 |
0.13 |
| 900 |
890.13 |
0.47 |
0.34 |
0.13 |
| PAC |
1227.19 |
0.90 |
0.48 |
0.42 |
| GAC |
815.34 |
0.51 |
0.32 |
0.19 |
3.3 Sorption kinetics
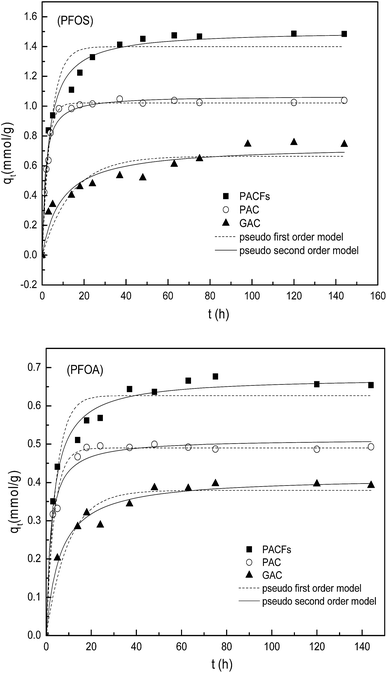
The sorption kinetics of PFOS and PFOA on the PACFs is shown and compared with the sorption on PAC and GAC in Fig. 6. It can be observed that the adsorbed amounts of PFOS and PFOA on PACFs were much higher than that on PAC and GAC, which is consistent with the SSAs and mesopore volumes of the three adsorbents decreasing in the order (PACFs > PAC > GAC).
 |
| | Fig. 6 Sorption kinetics of PFOS and PFOA on the PACFs, PAC and GAC respectively, fitted with pseudo-first-order and pseudo-second-order kinetics models. | |
To further discuss the adsorption behavior, the kinetics models were fitted with the pseudo-first-order and pseudo-second-order kinetics models with details given in the ESI† and the parameters obtained through model fitting are shown in Table 3.24 The pseudo-second-order model was observed to be more suitable for the sorption data according to the relatively high correlation coefficients (R2), except for PAC. It could be obtained that chemical interactions were possibly involved in the sorption processes. In consideration of the anion properties of PFOS and PFOA in water at the pH range studied according to their pKa shown in Table 1, electrostatic interactions may take place between adsorbates and adsorbents, which will be further discussed in subsection 3.5. As shown in Table 3, the initial sorption rates (v0) and qe of the three adsorbents for PFOS are much higher than those for PFOA, despite the same carbon chain length of PFOS and PFOA. According to the log![[thin space (1/6-em)]](https://www.rsc.org/images/entities/char_2009.gif) Kow values in Table 1, the PFOS with the sulphonic group is more hydrophobic than PFOA with a carboxyl group, although they contain the same number of carbon atoms in the molecules. The study here suggests that the hydrophobic interaction should also play an important role in addition to the electrostatic interactions in the sorption process, which will be discussed in the following parts.
Kow values in Table 1, the PFOS with the sulphonic group is more hydrophobic than PFOA with a carboxyl group, although they contain the same number of carbon atoms in the molecules. The study here suggests that the hydrophobic interaction should also play an important role in addition to the electrostatic interactions in the sorption process, which will be discussed in the following parts.
Table 3 The parameters of PFOS and PFOA sorption on the PACFs, GAC and PAC fitted using pseudo-first-order and pseudo-second-order models
| |
Adsorbent |
Pseudo-first-order parameter |
Pseudo-second-order parameter |
| k1 (h−1) |
R2 |
qe (mmol g−1) |
v0 (mmol h−1 g−1) |
k2 (g mmol−1 h−1) |
R2 |
| PFOS |
PACFs |
0.23 |
0.93 |
1.51 |
0.45 |
0.22 |
0.98 |
| PAC |
0.40 |
0.99 |
1.07 |
1.07 |
0.61 |
0.97 |
| GAC |
0.07 |
0.81 |
0.73 |
0.07 |
0.15 |
0.90 |
| PFOA |
PACFs |
0.23 |
0.94 |
0.68 |
0.24 |
0.49 |
0.99 |
| PAC |
0.28 |
0.99 |
0.51 |
0.61 |
0.98 |
0.98 |
| GAC |
0.10 |
0.94 |
0.41 |
0.06 |
0.39 |
0.98 |
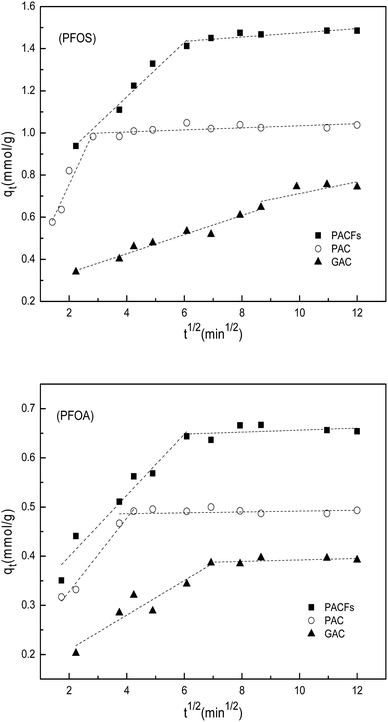
As the above models were not able to determine the diffusion mechanisms and identify the possible rate controlling procedure that affected the kinetics of the sorption, intra-particle diffusion and Boy’s film-diffusion models were further examined, models details them are given in the ESI† and the parameters obtained through the model fitting are shown in Table 4. The empirical intra-particle diffusion model assumes that the external diffusion is negligible and intra-particle diffusion is the only rate-controlling step, the larger the intercept of the linear fitting, the greater the contribution of the surface sorption in the rate controlling step.25
Table 4 Intra-particle diffusion parameters for the sorption of PFOS and PFOA on the PACFs, GAC and PAC
| Adsorbate |
Adsorbent |
K1 (mmol g−1 h−1/2) |
K2 (mmol g−1 h−1/2) |
C1 |
C2 |
R12 |
R22 |
| PFOS |
PACFs |
0.13 |
0.01 |
0.65 |
1.37 |
0.99 |
0.84 |
| PAC |
0.29 |
0.005 |
0.16 |
0.98 |
0.97 |
0.69 |
| GAC |
0.05 |
0.03 |
0.24 |
0.43 |
0.97 |
0.79 |
| PFOA |
PACFs |
0.06 |
0.002 |
0.27 |
0.64 |
0.98 |
0.41 |
| PAC |
0.07 |
0.001 |
0.18 |
0.48 |
0.99 |
0.27 |
| GAC |
0.04 |
0.001 |
0.14 |
0.38 |
0.95 |
0.58 |
The intra-particle diffusion models for the sorption of PFOS and PFOA on the PACFs, PAC and GAC are given in Fig. 7, and show that more than one process was involved in the sorption. The first stage (rapid removal) could be ascribed to boundary layer diffusion and the subsequent equilibrium stage (slow removal) could be attributed to the diffusion of PFOS and PFOA molecules into the pores of the adsorbents. It should be noted that none of the lines pass through the origin, indicating that the intra-particle diffusion is not a simple rate-determining step combined chemical sorption based on the previous fact that the pseudo-second-order model fitted well. The rates of the boundary layer diffusion decrease in the order of PAC > PACFs > GAC.
 |
| | Fig. 7 Intra-particle diffusion model for the sorption of PFOS and PFOA on the PACFs, PAC and GAC. | |
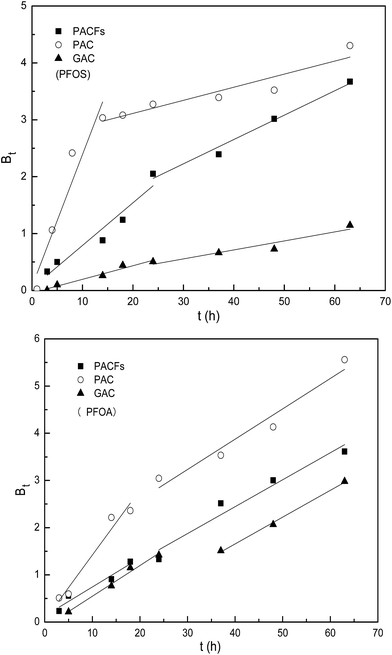
To further elucidate the actual rate-controlling step involved in the whole sorption process, the experimental data was analyzed using the Boy’s film-diffusion model in Fig. 8. All the plots show a linear relation in the first sorption stage (rapid removal) and the regression lines do not pass through the origin absolutely, which indicates that the external diffusion controlled the rate of sorption in the first stage slightly, and the intra-particle diffusion is the main rate-controlling step subsequently.26 The results could be illustrated by the hypothesis that the micropores on the surface of the three carbon materials may get blocked by the adsorbed PFOS and PFOA, resulting in the intra-particle pores becoming unreachable for the approaching adsorbates.
 |
| | Fig. 8 Boy’s film-diffusion model for the sorption of PFOS and PFOA on the PACFs, PAC and GAC. | |
3.4 Sorption isotherms
Sorption isotherms of PFOS and PFOA on the PACFs, PAC and GAC are presented in Fig. 9. The Langmuir and Freundlich equations were adopted to describe the experimental data respectively, which are given in the ESI† and the related parameters are summarized in Table 5. As presented in Fig. 9 and Table 5, the sorption capacities of PFOS and PFOA on the three materials at the same equilibrium concentration decrease in the order of PACFs > PAC > GAC, which is in agreement with the order of qm and KF as the critical evaluation of the sorption capacity. It can also be obtained that the sorption isotherms of PFOS on the three carbon materials can be fitted better using the Freundlich model than the Langmuir model, and the sorption isotherms of PFOA can be described using both models. The Langmuir model is derived from the assumption of a homogeneous adsorbent surface with identical sorption sites, and the Freundlich model is based on the assumption of heterogeneous sorptive energies on the adsorbent surface.27 There are high enough D bands in the Raman spectra for the three adsorbents in Fig. 2, which indicates the possibilities of heterogeneous surface sites. Given the anion properties of PFOS, the nonlinearity may result from not only the heterogeneous surface sites but also the electrostatic repulsion at high equilibrium concentrations. Both the Langmuir and Freundlich models can fit well the sorption of PFOA, which could not be obtained from the model describing all sorption isotherms better according to the correlation coefficients (R2). As a typical anionic surfactant, the critical micelle concentration (CMC) for PFOA is 15![[thin space (1/6-em)]](https://www.rsc.org/images/entities/char_2009.gif) 696 mg L−1.28 The total pore volume of the three adsorbents was measured to be 0.94 m3 g−1 for PACFs, 0.90 m3 g−1 for PAC and 0.51 m3 g−1 for GAC, and the maximum sorption capacities of PFOA were 0.73 mmol g−1 for PACFs, 0.49 mmol g−1 for PAC and 0.43 mmol g−1 for GAC. The sorption capacities of PFOA in order were equal to the PFOA concentration of 339 g L−1, 237 g L−1 and 368 g L−1 in the pores, much higher than its CMC value. Besides, it is possible to form some hemi-micelles on the adsorbent surface when the PFOS or PFOA concentrations are in the range of 0.01–0.001 of the CMC.13 Therefore, the multilayer sorption may possibly occur after monolayer sorption behavior through some micelle and hemi-micelle formation.
696 mg L−1.28 The total pore volume of the three adsorbents was measured to be 0.94 m3 g−1 for PACFs, 0.90 m3 g−1 for PAC and 0.51 m3 g−1 for GAC, and the maximum sorption capacities of PFOA were 0.73 mmol g−1 for PACFs, 0.49 mmol g−1 for PAC and 0.43 mmol g−1 for GAC. The sorption capacities of PFOA in order were equal to the PFOA concentration of 339 g L−1, 237 g L−1 and 368 g L−1 in the pores, much higher than its CMC value. Besides, it is possible to form some hemi-micelles on the adsorbent surface when the PFOS or PFOA concentrations are in the range of 0.01–0.001 of the CMC.13 Therefore, the multilayer sorption may possibly occur after monolayer sorption behavior through some micelle and hemi-micelle formation.
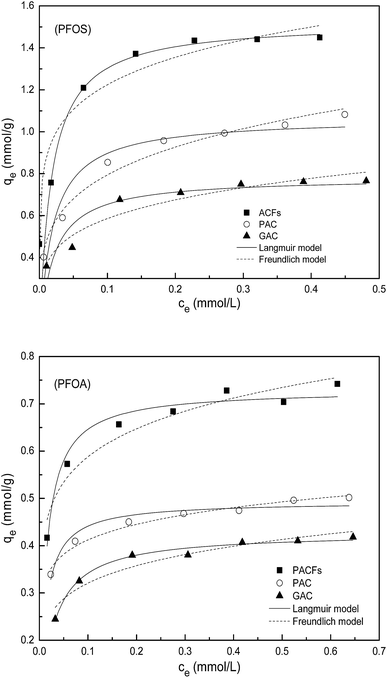 |
| | Fig. 9 Sorption isotherms of PFOS and PFOA on the PACFs, PAC and GAC respectively, fitted with Langmuir model and Freundlich model. | |
Table 5 The parameters of PFOS and PFOA sorption on PACFs, GAC and PAC fitted by Langmuir and Freundlich models
| Adsorbate |
Adsorbent |
Langmuir constants |
Freundlich constants |
| qm (mmol g−1) |
b (L mmol−1) |
R2 |
KF (mmol(1−n) Ln g−1) |
n |
R2 |
| PFOS |
PACFs |
1.52 |
58.80 |
0.73 |
1.71 |
0.15 |
0.92 |
| PAC |
1.07 |
53.22 |
0.90 |
1.33 |
0.22 |
0.97 |
| GAC |
0.78 |
51.11 |
0.85 |
0.94 |
0.20 |
0.92 |
| PFOA |
PACFs |
0.73 |
77.07 |
0.96 |
0.80 |
0.14 |
0.93 |
| PAC |
0.49 |
84.99 |
0.93 |
0.53 |
0.11 |
0.97 |
| GAC |
0.43 |
39.78 |
0.98 |
0.46 |
0.16 |
0.92 |
3.5 Effect of solution pH
The influence of pH on the sorption of PFOS and PFOA on the PACFs, PAC and GAC are presented in Fig. 10. The solution pH not only affects the adsorbate speciation in solution, but also influences the properties of the adsorbent surface. Because the pKa values of PFOS (−3.27) and PFOA hotly debated (in the range from 0.5 to 3.8) were lower than the pH values (2.0–10.0) investigated in the present study, all PFOS and part of PFOA should exist as anions above pH 2.0. The PFOS and PFOA equilibrium sorption capacities for all the adsorbents decreased as the pH values increased. The significant decreases of PFOS and PFOA at the point of zero charge of the three adsorbents and then decreased slowly. The electrostatic attraction should be involved in the sorption process below the point of zero charge of the three adsorbents, and the electrostatic repulsion could occur among the free adsorbate, adsorbed adsorbate and the negatively charged surface of the different adsorbents with the increase of pH. It is difficult to illustrate the electrostatic attraction, and other interactions may be involved in the sorption at high pH. According to the Boehm titration, contents of carboxyl, lactone, phenolic hydroxyl and carbonyl groups on the PACFs were 0.122, 0.020, 0.186 and 0.172 mmol g−1, which are hydrophilic and the sorption capacities for the PFOS and PFOA are impossible.21 The FTIR of PACFs before and after sorption of PFOS and PFOA are presented in Fig. 11. The three major bands centered around (3441, 2922, 2850 and 1635) cm−1 were attributed to the –OH stretching vibration, C–H symmetric and asymmetric stretching vibration, and –COOH stretching vibration, respectively.24 Compared with the PACFs, the peaks at (1240, 1205 and 1148) cm−1 of PFOS/PFOA-adsorbed PACFs match up with the CF2 and CF3 groups. The band at 1073 cm−1 indicates the existence of a sulfonic group on the PFOS-adsorbed PACFs.18,29 Thus, the sorption of PFOS and PFOA on PACFs were verified, and none of the structure changes of the main oxygen-containing functional groups on the PACFs. Given the hydrophobic properties of the C–F chain in PFCs, hydrophobic interactions should be responsible for the sorption capacities, and the effect of the C–F chain length will be discussed in the following section. This observation will also help further understand the energetic characteristics of adsorbent-PFOS/PFOA interactions from site energy distributions in subsection 3.7.
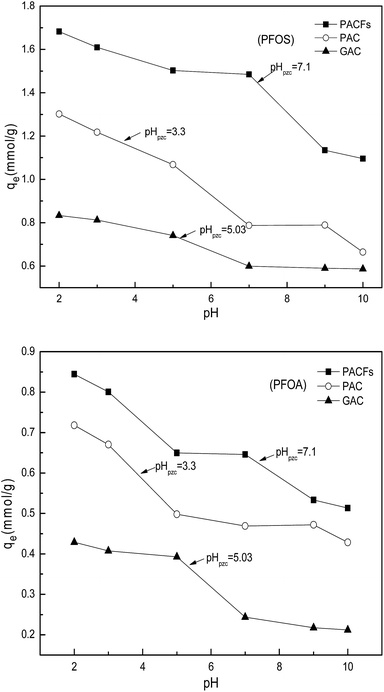 |
| | Fig. 10 Effects of pH for PFOS and PFOA sorption on the PACFs, PAC and GAC. | |
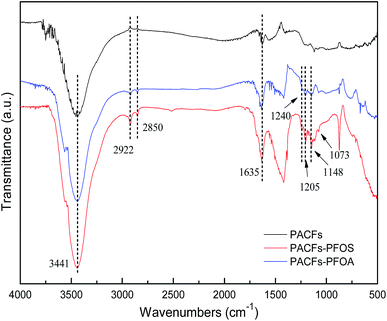 |
| | Fig. 11 FTIR spectra of PACFs before and after PFOS and PFOA sorption. | |
3.6 Effect of C–F chain length
The sorption kinetics of PFOS, PFHxS and PFBS at the same concentration of 100 mg L−1 at pH 5.0 are shown in Fig. 12. The PFHxS and PFBS are similar to PFOS in structure with the same sulphonic group, except for shorter C–F chains and higher critical micelle concentrations.18 Comparison of their sorption kinetics could provide more information about the sorption mechanism. When they have the same functional groups, PFCs with longer C–F chains are more hydrophobic. It could be obtained that the time of sorption equilibrium increases for the three kinds of PFCs on PACFs with the increase of C–F chain length as shown in Fig. 12. It is reasonable that the larger PFOS molecules are more difficult to diffuse into the porous PACFs than the PFHxS and PFBS. The sorption rates for PFOS on the porous ACFs combined the effect of the hydrophobic interaction and electrostatic interactions, which indicates that the process required more time to rearrange the adsorbed and incoming PFOS molecules than PFHxS and PFBS. The qm for PFOS is about 2–3 times higher than that of PFHxS and PFBS, which could be illustrated by the more hydrophobic properties of PFOS and the tendency for the formation of the hemi-micelle and micelle in internal pores being greater. Some PFOS molecules could also be adsorbed on the hemi-micelles to form the semicircle or bilayer structure.18 In consideration of the hydrophilic properties of the sulphonic and carboxyl groups, these adsorbed groups on the surface of the adsorbent through hydrophobic effects are more outward to the aqueous solution due to the electrostatic repulsion between the adsorbed PFOS/PFOA. Besides, a new insight into the sorption mechanism of ionizable compounds on carbon nanotubes was reported,30 which revealed that ionizable compounds could interact with adsorbents using the charge-assisted hydrogen bond. The arrangements of the possible charge-assisted hydrogen bond for PFOA on adsorbents are similar to those noted through the hydrophobic effect. Unlike GAC, in PACFs, the slit shaped and almost uniform pores are believed to open directly to the outer surface.31 This is responsible for the more rapid external diffusion of PACFs for PFOS and PFOA than that of GAC, which is consistent with the rates order of the boundary layer diffusion in the intra-particle diffusion model fitting. Based on the above discussion, the possible schematic diagram for the sorption of PFOS and PFOA on the positively charged PANFs-derived PACFs, and a schematic view of the pore structure of GAC are proposed in Fig. 13.
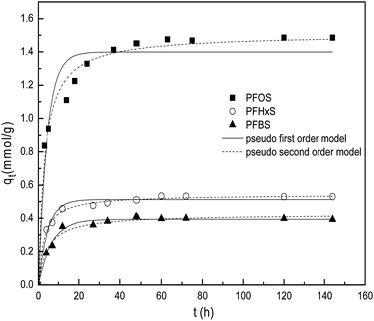 |
| | Fig. 12 Effects of different C–F chain length for PFOS, PFHxS and PFBS sorption on the PACFs. | |
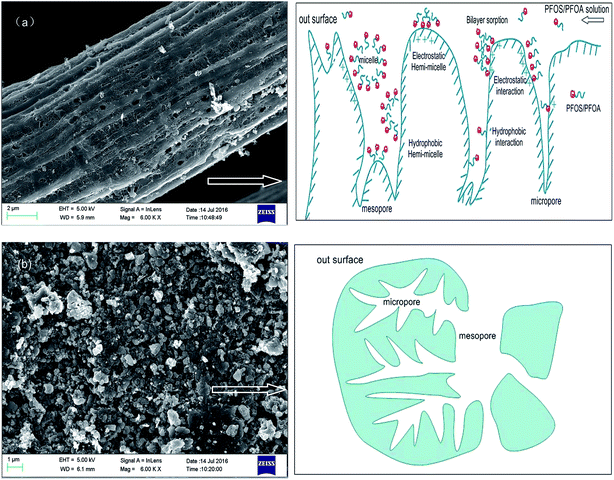 |
| | Fig. 13 Schematic diagram for the sorption of PFOS and PFOA on the positively charged PANF-derived PACFs (a), and schematic view of the pore structure of GAC (b). | |
3.7 Site energy
In order to relate the differences of different carbon materials in sorption isotherms to alteration of energetic characteristics of adsorbent-PFOS/PFOA interactions, the approximate site energy distributions (Φ(ε)) calculated from Freundlich isotherm data using the condensation approximation were studied in Fig. 14.32 The related equation and definition of parameters are given in the ESI.† The position of the distribution curve against the ε axis indicates the mean energy of the sorption sites, which is regarded as an indicator of adsorbent surface affinity. The sites with higher energy are more inclined to adsorbates of interest. The area suggests the maximum amount of available sorption sites for PFOS and PFOA on the surface of the adsorbents. As shown in Fig. 14, the sorption of PACFs showed steeper and wider curves than that of PAC and GAC, respectively. It can be seen that PACFs had the most available sorption sites with the greatest affinity. Besides, the heterogeneity value n reflecting the diversity of the energy sites controls the width of the distribution, which are consistent with the high enough D bands of Raman spectra for the three adsorbents in Fig. 2. It could be illustrated that the steeper curve of PACFs for PFOS than that of PFOA, due to the more hydrophobic properties of PFOS with its sulphonic group than PFOA with the carboxyl group. The site energy study here proves that the hydrophobic interactions play an important role in the sorption process.
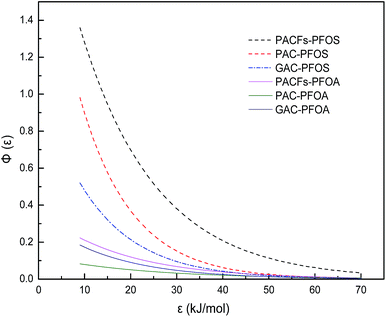 |
| | Fig. 14 Sorption site energy distribution curves of PFOS and PFOA on the PACFs, PAC and GAC. | |
3.8 Desorption and regeneration
The PACFs offer flexibility and endless forms, which are easy for solid–liquid separation. The PACFs after PFOS sorption were regenerated using different agents at ambient temperature, and the regeneration kinetics are shown in Fig. 15(a). It was not effective for the PFOS-adsorbed PACFs using distilled water, the percent regenerated was less than 5% after 48 h. Although the solubility of PFOS and PFOA was higher than other surfactants, the potential cluster formation between the oxygen-containing functional groups and water molecules by hydrogen bonds on the PACFs surface would be the possible limiting reason of the diffusion of PFOS according to the previous report. When the mixture of ethanol and distilled water was used as the regeneration solution, it was found that the regeneration rate increased with the increase of ethanol concentration. The regeneration of percent of pure ethanol and 50% ethanol at 25 °C after 24 h were 87.29% and 85.01%, respectively. To further investigate the reusability of PACFs for PFOS sorption, the regeneration using 50% ethanol and sorption of PFOS on the PACFs in five sorption cycles are shown in Fig. 15(b). The equilibrium sorption remains above 1.44 mmol g−1 in the following five cycles, indicating the good reusability of this PANF-derived PACFs.
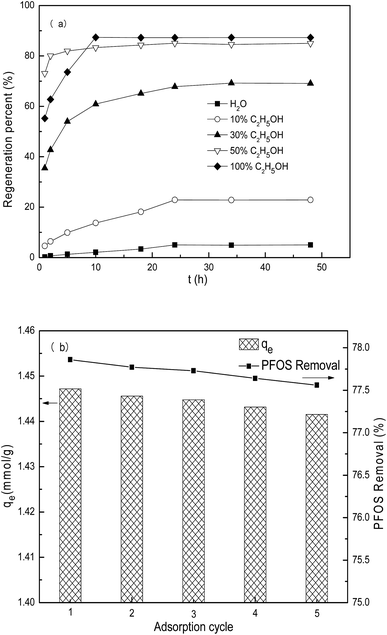 |
| | Fig. 15 Desorption of spent PACFs using different regeneration agents (a), and sorption of PFOS on the PACFs in five sorption cycles (b). | |
4. Conclusions
High SSAs of 1782 m2 g−1 and micro/mesoporous structures of PANF-derived PACFs were obtained through evaluating and optimizing the one step carbonation–activation preparation conditions of the PANOFs/KOH ratio of 1![[thin space (1/6-em)]](https://www.rsc.org/images/entities/char_2009.gif) :
:![[thin space (1/6-em)]](https://www.rsc.org/images/entities/char_2009.gif) 2 and activation temperature of 800 °C. Our results indicate that the sorption affinity of PFOS/PFOA depends on not only the SSAs of the adsorbents but also the available sorption mesopores due to the large molecular length of PFOS/PFOA. The sorption dynamics results exhibited that the as-prepared PACFs had sorption capacities of 1.52 mmol g−1 for PFOS and 0.73 mmol g−1 for PFOA, much higher than the commercially available coal-based PAC and GAC, which was consistent with the maximum amount of available sorption sites for PFOS and PFOA on the surface of PACFs, PAC and GAC using the site energy distribution curves. Sorption isotherms studies showed that the multilayer sorption most probably occurs after monolayer sorption behavior through electrostatic attractions and hydrophobic interactions, and forms some micelles and hemi-micelles on the PACFs surface. Furthermore, the spent PACFs were successfully regenerated and show good reusability in five sorption–desorption cycle studies. This study suggests the potential utilization of PANF-derived PACFs as effective adsorbents for pollutant removal from aqueous solutions.
2 and activation temperature of 800 °C. Our results indicate that the sorption affinity of PFOS/PFOA depends on not only the SSAs of the adsorbents but also the available sorption mesopores due to the large molecular length of PFOS/PFOA. The sorption dynamics results exhibited that the as-prepared PACFs had sorption capacities of 1.52 mmol g−1 for PFOS and 0.73 mmol g−1 for PFOA, much higher than the commercially available coal-based PAC and GAC, which was consistent with the maximum amount of available sorption sites for PFOS and PFOA on the surface of PACFs, PAC and GAC using the site energy distribution curves. Sorption isotherms studies showed that the multilayer sorption most probably occurs after monolayer sorption behavior through electrostatic attractions and hydrophobic interactions, and forms some micelles and hemi-micelles on the PACFs surface. Furthermore, the spent PACFs were successfully regenerated and show good reusability in five sorption–desorption cycle studies. This study suggests the potential utilization of PANF-derived PACFs as effective adsorbents for pollutant removal from aqueous solutions.
Acknowledgements
This study was supported by the National Natural Science Foundation of China (21377041), the Science and Technology Project of Guangdong Province (2013B021300022), and the State Key Laboratory of Subtropical Building Science Foundation (2013KB28).
References
- S. Fujii, C. Polprasert, S. Tanaka, N. P. H. Lien and Y. Qiu, J. Water Supply: Res. Technol.–AQUA, 2007, 56, 313–326 CrossRef CAS.
- A. Y. C. Lin, S. C. Panchangam and C. C. Lo, Environ. Pollut., 2009, 157, 1365–1372 CrossRef CAS PubMed.
- C. D. Vecitis, H. Park, J. Cheng, B. T. Mader and M. R. Hoffmann, Front. Environ. Sci. Eng., 2009, 3, 129–151 CrossRef CAS.
- U. EPA, Provisional Health Advisories for Perfluorooctanoic Acid (PFOA) and Perfluorooctane Sulfonate (PFOS), 2009 Search PubMed.
- D. F. Barofsky, M. M. Schultz and J. A. Field, Environ. Sci. Technol., 2004, 38, 1828–1835 CrossRef.
- C. Y. Y. Tang, Q. S. Fu, A. P. Robertson, C. S. Criddle and J. O. Leckie, Environ. Sci. Technol., 2006, 40, 7343–7349 CrossRef CAS PubMed.
- F. Xiao, M. F. Simcik and J. S. Gulliver, Water Res., 2013, 47, 49–56 CrossRef CAS PubMed.
- B. G. Kwon, H. J. Lim, S. H. Na, B. I. Choi, D. S. Shin and S. Y. Chung, Chemosphere, 2014, 109, 221–225 CrossRef CAS PubMed.
- K. L. Zhang, J. Huang, G. Yu, Q. W. Zhang, S. B. Deng and B. Wang, Environ. Sci. Technol., 2013, 47, 6471–6477 CAS.
- J. Cheng, C. D. Vecitis, H. Park, B. T. Mader and M. R. Hoffmann, Environ. Sci. Technol., 2008, 42, 8057–8063 CrossRef CAS PubMed.
- F. Wang, C. Liu and K. Shih, Chemosphere, 2012, 89, 1009–1014 CrossRef CAS PubMed.
- F. Wang and K. Shih, Water Res., 2011, 45, 2925–2930 CrossRef CAS PubMed.
- Q. Yu, R. Zhang, S. Deng, J. Huang and G. Yu, Water Res., 2009, 43, 1150–1158 CrossRef CAS PubMed.
- Q. Zhou, S. Deng, Q. Zhang, Q. Fan, J. Huang and G. Yu, Chemosphere, 2010, 81, 453–458 CrossRef CAS PubMed.
- S. Deng, Q. Zhang, Y. Nie, H. Wei, B. Wang, J. Huang, G. Yu and B. Xing, Environ. Pollut., 2012, 168, 138–144 CrossRef CAS PubMed.
- R. Zhang, W. Yan and C. Jing, Colloids Surf., A, 2014, 462, 252–258 CrossRef CAS.
- Q. Yu, S. B. Deng and G. Yu, Water Res., 2008, 42, 3089–3097 CrossRef CAS PubMed.
- Q. Zhang, S. Deng, G. Yu and J. Huang, Bioresour. Technol., 2011, 102, 2265–2271 CrossRef CAS PubMed.
- S. Deng, L. Niu, Y. Bei, B. Wang, J. Huang and G. Yu, Chemosphere, 2013, 91, 124–130 CrossRef CAS PubMed.
- T. Yan, H. Chen, X. Wang and F. Jiang, RSC Adv., 2013, 3, 22480 RSC.
- S. Deng, Y. Nie, Z. Du, Q. Huang, P. Meng, B. Wang, J. Huang and G. Yu, J. Hazard. Mater., 2015, 282, 150–157 CrossRef CAS PubMed.
- N. Yusof and A. F. Ismail, J. Anal. Appl. Pyrolysis, 2012, 93, 1–13 CrossRef CAS.
- Y. Si, T. Ren, Y. Li, B. Ding and J. Yu, Carbon, 2012, 50, 5176–5185 CrossRef CAS.
- X. Li, S. Chen, X. Fan, X. Quan, F. Tan, Y. Zhang and J. Gao, J. Colloid Interface Sci., 2015, 447, 120–127 CrossRef CAS PubMed.
- M. Al-Ghouti, M. A. Khraisheh, M. N. Ahmad and S. Allen, J. Colloid Interface Sci., 2005, 287, 6–13 CrossRef CAS PubMed.
- Z. Wu, H. Zhong, X. Yuan, H. Wang, L. Wang, X. Chen, G. Zeng and Y. Wu, Water Res., 2014, 67, 330–344 CrossRef CAS PubMed.
- H. Genc-Fuhrman, J. C. Tjell and D. McConchie, Environ. Sci. Technol., 2004, 38, 2428–2434 CrossRef CAS PubMed.
- E. Kissa, Fluorinated Surfactants and Repellents, Marcel Dekker, Inc., New York, 2001 Search PubMed.
- H. Lin, Y. Wang, J. Niu, Z. Yue and Q. Huang, Environ. Sci. Technol., 2015, 49, 10562–10569 CrossRef CAS PubMed.
- X. Li, J. J. Pignatello, Y. Wang and B. Xing, Environ. Sci. Technol., 2013, 47, 8334–8341 CAS.
- M. Sheintuch and Y. Matatov-Meytal, Appl. Catal., A, 2002, 231, 116 Search PubMed.
- J. E. Kilduff, M. C. Carter and W. J. Weber Jr, Environ. Sci. Technol., 1995, 29, 1773–1780 CrossRef PubMed.
Footnote |
| † Electronic supplementary information (ESI) available. See DOI: 10.1039/c6ra25230c |
|
| This journal is © The Royal Society of Chemistry 2017 |
Click here to see how this site uses Cookies. View our privacy policy here.  Open Access Article
![[thin space (1/6-em)]](https://www.rsc.org/images/entities/char_2009.gif) :
:![[thin space (1/6-em)]](https://www.rsc.org/images/entities/char_2009.gif) 2 and an activation temperature of 800 °C. The as-prepared PACFs exhibited flexibility and endless forms, and sorption capacities of 1.52 mmol g−1 for PFOS and 0.73 mmol g−1 for PFOA, much higher than the commercially available coal-based powder activated carbon (PAC) and granular activated carbon (GAC), which was also indicated by the site energy distributions. The sorption system followed a pseudo-second-order kinetic model and a Freundlich isotherm model. The intra-particle diffusion and Boy’s film-diffusion models were also used to verify that intra-particle diffusion is the main rate-controlling step. It was assumed that the multilayer sorption most probably occurs through electrostatic attraction and hydrophobic interaction, and some micelles and hemi-micelles form on the ACF surfaces. The PACFs show good reusability over five sorption–desorption cycle studies.
2 and an activation temperature of 800 °C. The as-prepared PACFs exhibited flexibility and endless forms, and sorption capacities of 1.52 mmol g−1 for PFOS and 0.73 mmol g−1 for PFOA, much higher than the commercially available coal-based powder activated carbon (PAC) and granular activated carbon (GAC), which was also indicated by the site energy distributions. The sorption system followed a pseudo-second-order kinetic model and a Freundlich isotherm model. The intra-particle diffusion and Boy’s film-diffusion models were also used to verify that intra-particle diffusion is the main rate-controlling step. It was assumed that the multilayer sorption most probably occurs through electrostatic attraction and hydrophobic interaction, and some micelles and hemi-micelles form on the ACF surfaces. The PACFs show good reusability over five sorption–desorption cycle studies.![[thin space (1/6-em)]](https://www.rsc.org/images/entities/char_2009.gif) Kow
Kow![[thin space (1/6-em)]](https://www.rsc.org/images/entities/char_2009.gif) :
:![[thin space (1/6-em)]](https://www.rsc.org/images/entities/char_2009.gif) 1–1
1–1![[thin space (1/6-em)]](https://www.rsc.org/images/entities/char_2009.gif) :
:![[thin space (1/6-em)]](https://www.rsc.org/images/entities/char_2009.gif) 3 overnight, taken out and underwent one step carbonation and activation under 700, 750, 800, 850 and 900 °C at an increasing rate of 5 K min−1, they were held for 1 h under a N2 atmosphere. Finally, the as-prepared PACFs were washed with distilled water repeatedly until the wash water was neutral and then they were dried at 105 °C for 12 h (characteristic parameters of the as-prepared PACFs under optimized conditions are given in the ESI†).
3 overnight, taken out and underwent one step carbonation and activation under 700, 750, 800, 850 and 900 °C at an increasing rate of 5 K min−1, they were held for 1 h under a N2 atmosphere. Finally, the as-prepared PACFs were washed with distilled water repeatedly until the wash water was neutral and then they were dried at 105 °C for 12 h (characteristic parameters of the as-prepared PACFs under optimized conditions are given in the ESI†).


![[thin space (1/6-em)]](https://www.rsc.org/images/entities/char_2009.gif) :
:![[thin space (1/6-em)]](https://www.rsc.org/images/entities/char_2009.gif) 2 at 800 °C, no significant change for the average diameter is noted, some pores and distinct defects can be observed compared with random structures for the PAC and GAC, which may be mainly responsible for the PFOS and PFOA sorption.
2 at 800 °C, no significant change for the average diameter is noted, some pores and distinct defects can be observed compared with random structures for the PAC and GAC, which may be mainly responsible for the PFOS and PFOA sorption.

![[thin space (1/6-em)]](https://www.rsc.org/images/entities/char_2009.gif) :
:![[thin space (1/6-em)]](https://www.rsc.org/images/entities/char_2009.gif) 2, and then decreased with increasing KOH proportionally. Due to the excessive etching effect of KOH, localized collapses of the as-prepared PACFs and SSA decreases were observed, a PANOFs/KOH ratio of 1
2, and then decreased with increasing KOH proportionally. Due to the excessive etching effect of KOH, localized collapses of the as-prepared PACFs and SSA decreases were observed, a PANOFs/KOH ratio of 1![[thin space (1/6-em)]](https://www.rsc.org/images/entities/char_2009.gif) :
:![[thin space (1/6-em)]](https://www.rsc.org/images/entities/char_2009.gif) 2 was selected to prepare the PACFs. In the activation process, the changes of activation temperature can disproportionately affect the reaction between KOH and PANOFs as can be seen in Fig. 4. The PACFs obtained under 800 °C were used in the subsequent sorption experiments. Fig. 5 shows the pore distribution curves and the N2 sorption–desorption isotherms of the PACFs under the optimal conditions, as well as commercial PAC and GAC. The typical N2 hysteresis loops of the three carbon materials all at P/P0 > 0.4 suggest the presence of both mesopores and micropores,23 which can be also observed in Table 2. Through the PFOS adsorbed and the structure parameter comparisons among PACFs at PANOFs/KOH ratios of 1
2 was selected to prepare the PACFs. In the activation process, the changes of activation temperature can disproportionately affect the reaction between KOH and PANOFs as can be seen in Fig. 4. The PACFs obtained under 800 °C were used in the subsequent sorption experiments. Fig. 5 shows the pore distribution curves and the N2 sorption–desorption isotherms of the PACFs under the optimal conditions, as well as commercial PAC and GAC. The typical N2 hysteresis loops of the three carbon materials all at P/P0 > 0.4 suggest the presence of both mesopores and micropores,23 which can be also observed in Table 2. Through the PFOS adsorbed and the structure parameter comparisons among PACFs at PANOFs/KOH ratios of 1![[thin space (1/6-em)]](https://www.rsc.org/images/entities/char_2009.gif) :
:![[thin space (1/6-em)]](https://www.rsc.org/images/entities/char_2009.gif) 1 and 1
1 and 1![[thin space (1/6-em)]](https://www.rsc.org/images/entities/char_2009.gif) :
:![[thin space (1/6-em)]](https://www.rsc.org/images/entities/char_2009.gif) 3, and that of the PAC evaluated in the following section, the results exhibit the sorption abilities of these three kinds of carbon materials for PFOS were not completely consistent with their SSAs, and their effective available mesopores were also important for PFOS sorption due to the molecular lengths of PFOS and PFOA being 1.32 and 1.20 nm, respectively.
3, and that of the PAC evaluated in the following section, the results exhibit the sorption abilities of these three kinds of carbon materials for PFOS were not completely consistent with their SSAs, and their effective available mesopores were also important for PFOS sorption due to the molecular lengths of PFOS and PFOA being 1.32 and 1.20 nm, respectively.
![[thin space (1/6-em)]](https://www.rsc.org/images/entities/char_2009.gif) :
:![[thin space (1/6-em)]](https://www.rsc.org/images/entities/char_2009.gif) 1
1![[thin space (1/6-em)]](https://www.rsc.org/images/entities/char_2009.gif) :
:![[thin space (1/6-em)]](https://www.rsc.org/images/entities/char_2009.gif) 2
2![[thin space (1/6-em)]](https://www.rsc.org/images/entities/char_2009.gif) :
:![[thin space (1/6-em)]](https://www.rsc.org/images/entities/char_2009.gif) 3
3![[thin space (1/6-em)]](https://www.rsc.org/images/entities/char_2009.gif) :
:![[thin space (1/6-em)]](https://www.rsc.org/images/entities/char_2009.gif) 2)
2)
![[thin space (1/6-em)]](https://www.rsc.org/images/entities/char_2009.gif) Kow values in Table 1, the PFOS with the sulphonic group is more hydrophobic than PFOA with a carboxyl group, although they contain the same number of carbon atoms in the molecules. The study here suggests that the hydrophobic interaction should also play an important role in addition to the electrostatic interactions in the sorption process, which will be discussed in the following parts.
Kow values in Table 1, the PFOS with the sulphonic group is more hydrophobic than PFOA with a carboxyl group, although they contain the same number of carbon atoms in the molecules. The study here suggests that the hydrophobic interaction should also play an important role in addition to the electrostatic interactions in the sorption process, which will be discussed in the following parts.![[thin space (1/6-em)]](https://www.rsc.org/images/entities/char_2009.gif) 696 mg L−1.28 The total pore volume of the three adsorbents was measured to be 0.94 m3 g−1 for PACFs, 0.90 m3 g−1 for PAC and 0.51 m3 g−1 for GAC, and the maximum sorption capacities of PFOA were 0.73 mmol g−1 for PACFs, 0.49 mmol g−1 for PAC and 0.43 mmol g−1 for GAC. The sorption capacities of PFOA in order were equal to the PFOA concentration of 339 g L−1, 237 g L−1 and 368 g L−1 in the pores, much higher than its CMC value. Besides, it is possible to form some hemi-micelles on the adsorbent surface when the PFOS or PFOA concentrations are in the range of 0.01–0.001 of the CMC.13 Therefore, the multilayer sorption may possibly occur after monolayer sorption behavior through some micelle and hemi-micelle formation.
696 mg L−1.28 The total pore volume of the three adsorbents was measured to be 0.94 m3 g−1 for PACFs, 0.90 m3 g−1 for PAC and 0.51 m3 g−1 for GAC, and the maximum sorption capacities of PFOA were 0.73 mmol g−1 for PACFs, 0.49 mmol g−1 for PAC and 0.43 mmol g−1 for GAC. The sorption capacities of PFOA in order were equal to the PFOA concentration of 339 g L−1, 237 g L−1 and 368 g L−1 in the pores, much higher than its CMC value. Besides, it is possible to form some hemi-micelles on the adsorbent surface when the PFOS or PFOA concentrations are in the range of 0.01–0.001 of the CMC.13 Therefore, the multilayer sorption may possibly occur after monolayer sorption behavior through some micelle and hemi-micelle formation.


![[thin space (1/6-em)]](https://www.rsc.org/images/entities/char_2009.gif) :
:![[thin space (1/6-em)]](https://www.rsc.org/images/entities/char_2009.gif) 2 and activation temperature of 800 °C. Our results indicate that the sorption affinity of PFOS/PFOA depends on not only the SSAs of the adsorbents but also the available sorption mesopores due to the large molecular length of PFOS/PFOA. The sorption dynamics results exhibited that the as-prepared PACFs had sorption capacities of 1.52 mmol g−1 for PFOS and 0.73 mmol g−1 for PFOA, much higher than the commercially available coal-based PAC and GAC, which was consistent with the maximum amount of available sorption sites for PFOS and PFOA on the surface of PACFs, PAC and GAC using the site energy distribution curves. Sorption isotherms studies showed that the multilayer sorption most probably occurs after monolayer sorption behavior through electrostatic attractions and hydrophobic interactions, and forms some micelles and hemi-micelles on the PACFs surface. Furthermore, the spent PACFs were successfully regenerated and show good reusability in five sorption–desorption cycle studies. This study suggests the potential utilization of PANF-derived PACFs as effective adsorbents for pollutant removal from aqueous solutions.
2 and activation temperature of 800 °C. Our results indicate that the sorption affinity of PFOS/PFOA depends on not only the SSAs of the adsorbents but also the available sorption mesopores due to the large molecular length of PFOS/PFOA. The sorption dynamics results exhibited that the as-prepared PACFs had sorption capacities of 1.52 mmol g−1 for PFOS and 0.73 mmol g−1 for PFOA, much higher than the commercially available coal-based PAC and GAC, which was consistent with the maximum amount of available sorption sites for PFOS and PFOA on the surface of PACFs, PAC and GAC using the site energy distribution curves. Sorption isotherms studies showed that the multilayer sorption most probably occurs after monolayer sorption behavior through electrostatic attractions and hydrophobic interactions, and forms some micelles and hemi-micelles on the PACFs surface. Furthermore, the spent PACFs were successfully regenerated and show good reusability in five sorption–desorption cycle studies. This study suggests the potential utilization of PANF-derived PACFs as effective adsorbents for pollutant removal from aqueous solutions.


