
 Open Access Article
 This Open Access Article is licensed under a
 Creative Commons Attribution 3.0 Unported Licence
Lipase-catalyzed modification of natural Sapium sebiferum oil-based polyol for synthesis of polyurethane with improved properties
Guiying Wu,
Xin He and
Yunjun Yan *
*
Key Laboratory of Molecular Biophysics of the Ministry of Education, College of Life Science and Technology, Huazhong University of Science and Technology, Wuhan 430074, China. E-mail: yanyunjun@hust.edu.cn; Fax: +86-27-87792213; Tel: +86-27-87792213
First published on 5th January 2017
Abstract
Polyols are one of the dominant reactants in polyurethane (PU) synthesis. However, polyols from Sapium sebiferum oil prepared by epoxidation–hydroxylation have an inferiority of secondary alcohol groups and large non-functional branches. Their lower reactivity, which in turn limits the properties of the generated PU. In this study, the optimal reaction conditions for the synthesis of polyols with primary alcohol groups by lipase hydrolysis have been investigated by single factorial experiments and response surface methodology. The optimized conditions for lipase hydrolysis were identified as a molar ratio of 2.2![[thin space (1/6-em)]](https://www.rsc.org/images/entities/char_2009.gif) :1, a reaction time of 11.2 h, and a temperature of 47.2 °C. The highest hydroxyl value of the obtained polyol with primary alcohol groups reached 211 mg KOH per g. Furthermore, a novel PU was successfully synthesized from the synthetic polyol and isophorone diisocyanate by an in situ polymerization method. The generated PU showed a glass transition temperature of 60.6 °C, an initial decomposition temperature of 307.2 °C, a tensile strength of 12.5 MPa, and a Young's modulus of 22.3 MPa. These good thermal and mechanical properties of the PU prepared from the modified polyol by lipase hydrolysis can be attributed to its greater number of chemical interactions and cross-linked networks.
:1, a reaction time of 11.2 h, and a temperature of 47.2 °C. The highest hydroxyl value of the obtained polyol with primary alcohol groups reached 211 mg KOH per g. Furthermore, a novel PU was successfully synthesized from the synthetic polyol and isophorone diisocyanate by an in situ polymerization method. The generated PU showed a glass transition temperature of 60.6 °C, an initial decomposition temperature of 307.2 °C, a tensile strength of 12.5 MPa, and a Young's modulus of 22.3 MPa. These good thermal and mechanical properties of the PU prepared from the modified polyol by lipase hydrolysis can be attributed to its greater number of chemical interactions and cross-linked networks.
1. Introduction
Polyurethanes (PUs), after about 70 years of development, have become one of the most dynamic groups of polymers, exhibiting versatile properties suitable for practical use in all fields of polymer applications, such as foams, elastomers, thermoplastics, adhesives, coatings, sealants, fibers, and so on.1 PUs are usually obtained by reaction of an oligomeric polyol derived from petroleum and a diisocyanate (or polyisocyanate). Because of significant fluctuations in the crude oil market and unsustainable development, there has been much recent interest from the chemical industry in the production of bio-based polyols, which are mainly synthesized from vegetable oils.2 The markets for vegetable oil-based polyols are growing due to economic, environmental, and sustainability advantages.3Sapium sebiferum (Chinese tallow tree) is one of the four major woody oil trees in China, and provides excellent and abundant biomass.4 The trees can grow rapidly and reach maturity within approximately 3−4 years, and generate economic yields in its productive life span of which ranges between 70 and 100 years. Also the trees can be cultivated in marginal land and non-agricultural areas with low fertility and moisture demand. Moreover, they have huge potential to restore degraded lands, create rural employment generation and fixing of up to CO2 emissions.5 Sapium sebiferum oil (SSO) as an industrial resource can avoid competition with human food supplying, because they are not suitable for human food due to the presence of some toxic components in the oil.6 Therefore, SSO is one of the most suitable platform feedstock for the production of polyols and PUs.
A polyol bearing a primary alcohol group is usually three times more reactive towards isocyanate than one bearing a secondary alcohol group.7 Typical SSO-based polyols have secondary alcohol groups derived from epoxide ring-opening reaction near the middle of the fatty acid chain. Partial hydrolysis by lipase to afford primary alcohol groups could improve the reactivity of SSO-based polyols. Therefore, lipase hydrolysis has been applied to increase the number of primary alcohol groups in SSO-based polyols and replace the undesirable saturated fatty acid moieties. Lipases are renewable biocatalysts broadly employed in the transformation of lipids, especially in food, detergent, oil processing, biodiesel preparation, and many other biosynthetic industries.8 They offer high stereoselectivity and regioselectivity, but this depends on enzyme structure, substrate structure, factors affecting binding of the enzyme to the substrate, and other factors influencing the enzyme activity.9
The objective of this study is to propose the generation of new SSO-based polyols by two sequential steps of epoxidation-hydroxylation and lipase partial hydrolysis with a selected C. rugosa lipase. The resulting SSO-derived polyol bearing primary alcohol groups should be suitable for the synthesis of PU with improved properties.
2. Materials and methods
2.1 Materials
SSO was purchased from a refinery factory in Dawu County (Hubei Province, China). C. rugosa lipase was bought from Sigma-Aldrich (Shanghai, China) and used without further purification. Isophorone diisocyanate (IPDI) was obtained commercially from Aladdin Chemistry Ltd. Co. (China). Peracetic acid, acetic acid, methanol, fluoroboric acid, chloroform, and acetone were obtained from Sinopharm Chemical Reagent Ltd. Co. (Shanghai, China). Polyols prepared from SSO were dried at 60 °C for 12 h under vacuum to remove moisture.2.2 Synthesis methods
:1 and a fluoroboric acid loading of 0.4 wt% with respect to SSO, and the mixture was stirred at 55 °C for 0.5 h. After the solution had cooled, water (100 mL) and chloroform (50 mL) were added. After a certain time, the organic and aqueous layers were separated. The organic phase was then washed with deionized water until the washings were neutral. The solvent was removed under vacuum to leave a yellow oily material. The polyol product showed an –OH number of 143 mg KOH per g, and was thus designated as polyol-143.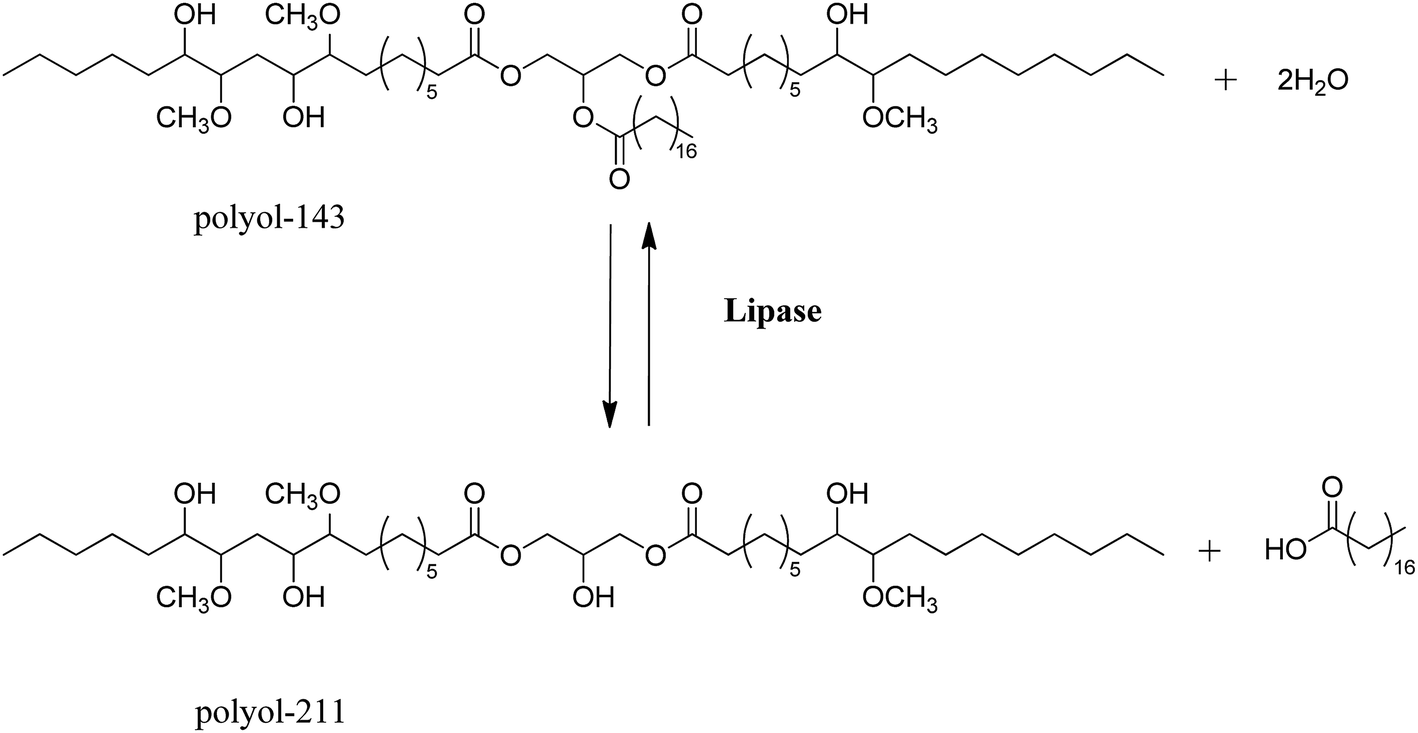 | ||
| Scheme 1 Modification of polyol-143 by lipase hydrolysis. | ||
Hydrolysis of polyol-143 with distilled water (H2O) was carried out using C. rugosa lipase as catalyst in a 50 mL flask, which was placed in a thermostatted shaking bed with a temperature monitor. The agitation rate was set at 200 rpm. The components of polyol-143, H2O, and C. rugosa lipase (5 wt% loading of polyol-143) were allowed to react under certain conditions. Specifically, the effects of reaction temperature (30−65 °C), reaction time (1−13 h), and molar ratio of H2O to polyol-143 (1:1–5:1) on the hydrolysis were explored, and the increased hydroxyl value of the produced polyol was chosen as an indicator.
After reaction, the product was partitioned between suitable volumes of aqueous Na2CO3 solution (0.5 M, pH 11.0) and diethyl ether in a separating funnel. The mixture was left overnight, and then high-speed centrifugation was applied to help separate the fatty acid from the organic phase. Free fatty acids were in the aqueous phase, whereas ester glycerides were in the organic phase. Finally, diethyl ether was removed from the organic phase at 50 °C. The obtained ester glycerides (the polyol product) showed a hydroxyl value of 211 mg KOH/g, and the sample was designated as polyol-211.
:1 molar ratio of –NCO to –OH groups) were allowed to react with magnetic stirring under a N2 atmosphere in a flask fitted with a water-cooled condenser at 60 °C. During this stage, acetone was added to reduce the viscosity of the system. After reaction for 2 h, the respective products were degassed under vacuum for 10 min, poured onto a sheet of release paper, and then heated in an oven at 60 °C for 24 h to complete the reactions. The samples were then allowed to cool to room temperature and were demolded.
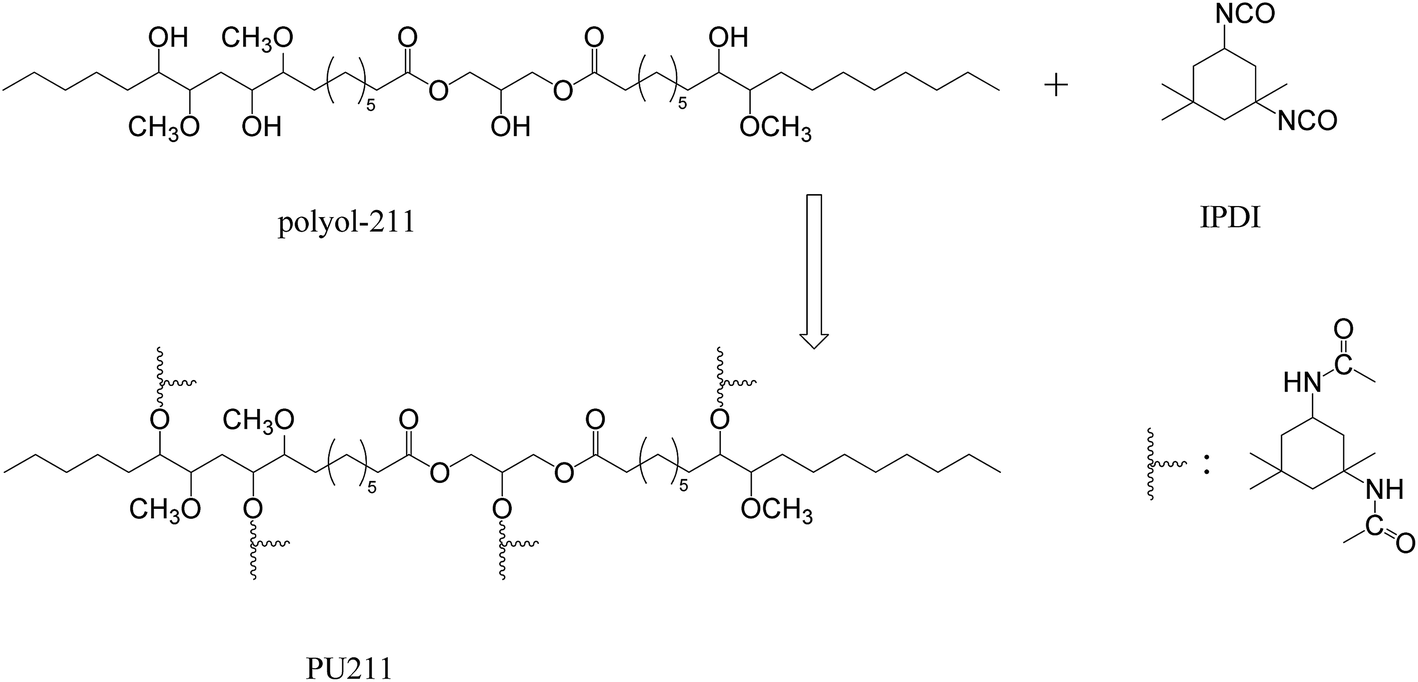 | ||
| Scheme 2 Synthesis of PU211 from the modified polyol-211. | ||
2.3 Testing and measurement
Acid value is an important index for evaluation of vegetable oil-based polyols. Their values were determined through standard test GB/T5530-2005 with some modifications. The acid value is used to determine polyols' equivalent weight by the following equation:
Hydroxyl value is one of the most important properties of polyols indicating numbers of hydroxy functional groups per gram of polyols. The number is evaluated according to HG/T 2709-95 to determine hydroxyl numbers of polyols. The hydroxyl value is also used to determine polyols' equivalent weight by the following equation:
For the experimental data, average value xi are calculated.  , y is the experimental data, n is the repeated experimental times, j for every experiment point, i with different samples synthesized in the same condition, which is 3 during our calculation. Standard deviation σ:
The Gel Permeation Chromatography (GPC) set-up was equipped with a refractive index detector and a pillar-type PL gel 5 μm MIXED-C 300 × 7.5 mm column. The column temperature and pressure were 40 °C and 6.86 MPa, respectively. Tetrahydrofuran was used as eluent at a flow rate of 1.0 mL min−1 and polystyrene standards (SHODEX SL-105) were used as standard sample.
To examine the significant absorption bands of the PUs, Fourier-transform infrared (FTIR) spectra of the samples in the wavenumber range, ν = 4000−400 cm−1 were obtained at a resolution of 4 cm−1 on Bruker Vertex 70 FTIR spectrometer at room temperature.
To investigate the thermal stabilities of the PUs, thermogravimetric analysis (TGA) was performed on a Pyris 1 TGA instrument. Samples (ca. 5 mg) were heated from 50 to 600 °C at a rate of 10 °C min−1 in a nitrogen atmosphere.
The glass transition temperature (Tg) of the PU was determined by differential scanning calorimetry (Diamond DSC) from 10 to 150 °C at a heating rate of 10 °C min−1 under nitrogen flow, which is a midpoint temperature between extrapolated onset temperature and extrapolated end temperature.
The mechanical properties of the PU films (100 mm × 10 mm × 1 mm) were tested on a CMT4104 universal testing machine (Shenzhen SANS Testing Machine Ltd. Co., Shenzhen, China) at a speed of 50 mm min−1. For each sample, five specimens were tested, and the average value was calculated.
3. Results and discussion
3.1 Lipase-catalyzed synthesis of polyols with primary alcohol groups
3.1.1.1 Effect of molar ratio of H2O to polyol-143. All three polyol-143 samples were lipase hydrolyzed in the same experimental conditions of 5 wt% enzyme dosage, rotate speed of 200 rpm, the reaction time of 10 h and the reaction temperature of 45 °C. The effect of molar ratio of H2O and polyol-143 on the increased hydroxyl value was studied. It can be seen from Fig. 1 that in the range from 1
:1 to 5:1, increasing H2O content initially improves the hydroxyl value of the polyol, but that excess H2O decreases this value. It can be deduced that increasing the water content in the system can reduce its viscosity and promote the catalytic efficiency of the lipase. However, with excessive H2O amount, the low concentration of reactant could reduce the reaction rate. It is also possible that too much hydrolysis will produce a certain amount of glycerols, which are then lost into the aqueous phase during the purification. Therefore, the maximum hydroxyl value was achieved at a molar ratio of H2O to polyol-143 of 2:1.
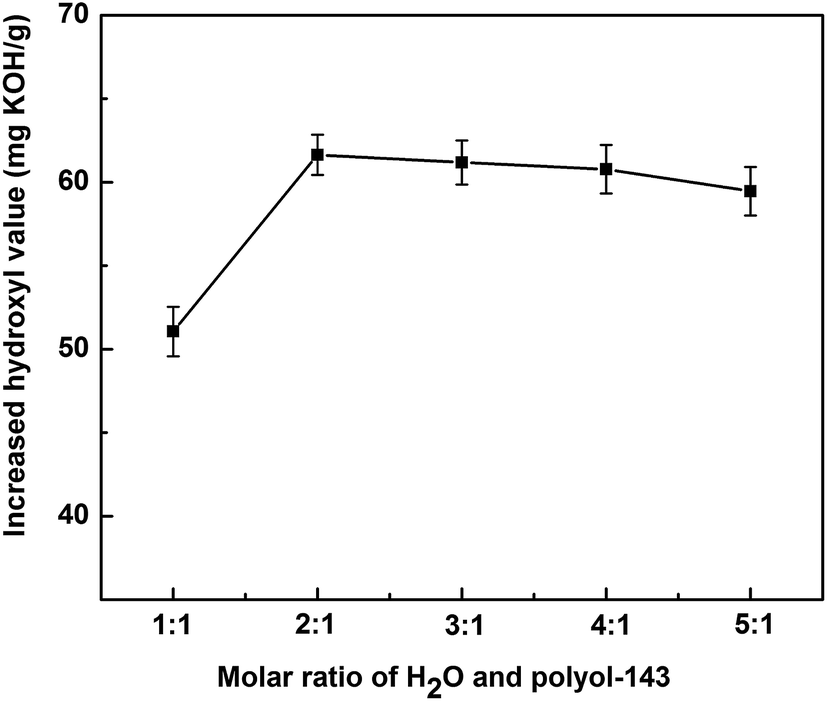 | ||
| Fig. 1 Effect of molar ratio of H2O to polyol-143 on increased hydroxyl value. | ||
3.1.1.2 Effect of reaction time. All three polyol-143 samples were lipase hydrolyzed in the same experimental conditions of 5 wt% enzyme dosage, 200 rpm rotate speed, 45 °C reaction temperature, 2
:1 for the molar ratio of H2O to polyol-143. The effect of the reaction time on the increased hydroxyl value was studied. As shown in Fig. 2, during reaction for 11 h, the hydroxyl value of the polyol first showed a significant increase and then a maximum was attained. On extending the reaction time to 13 h, there was a downward trend in the hydroxyl value. It could be deduced that with extension of the reaction time, the complete hydrolization of the three ester bond of triglycerides with a certain amount would produces glycerols, which can be dissolved in the water. Therefore, after high-speed centrifugation, the hydroxyl value of the polyol in the oil phase was slightly decreased.
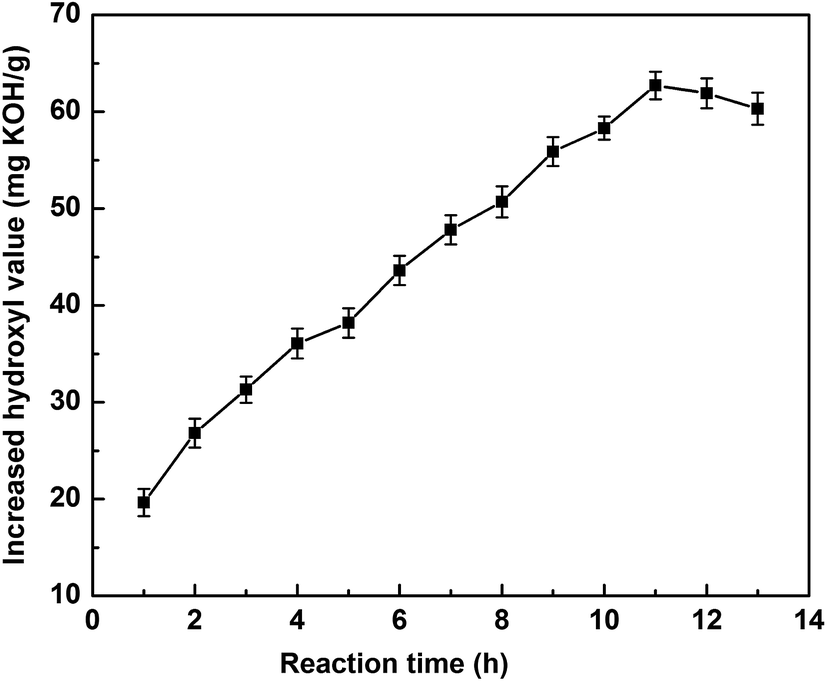 | ||
| Fig. 2 Effect of reaction time on increased hydroxyl value. | ||
3.1.1.3 Effect of reaction temperature. All three polyol-143 samples were lipase hydrolyzed in the same experimental conditions of 5 wt% enzyme dosage, 200 rpm rotate speed, 11 h reaction time, 2
:1 molar ratio of H2O to polyol-143. The effect of reaction temperature on the hydrolysis was investigated in the range from 30 to 65 °C (as shown in Fig. 3). The maximum hydroxyl value was obtained at 45 °C. On further increasing the reaction temperature, a decreasing trend was observed. For this reaction, temperature is effectively a double-edged sword. On the one hand, higher temperature would improve the reaction rate. On the other hand, an excessively high temperature will reduce the enzyme activity and cause oligomerization of the polyol.
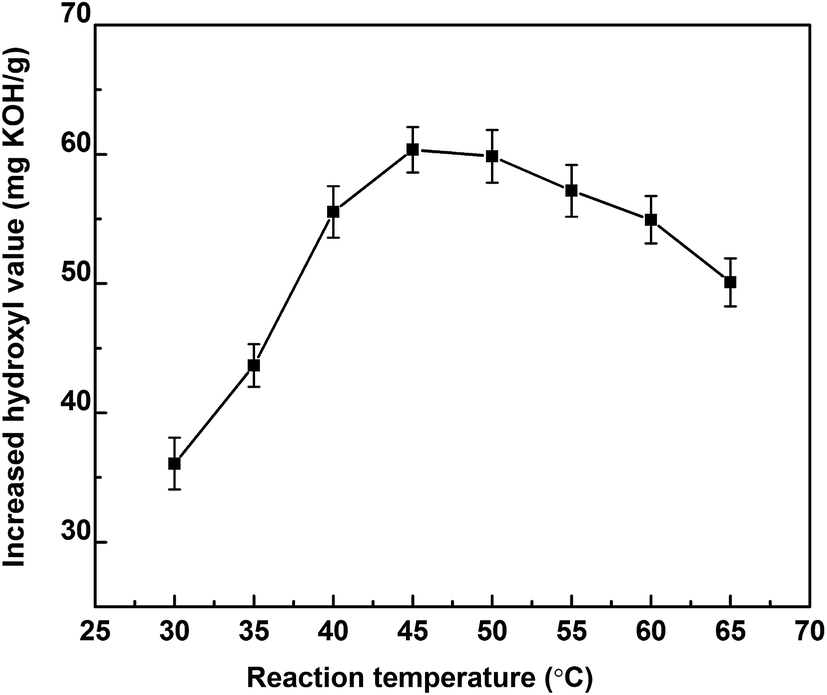 | ||
| Fig. 3 Effect of reaction temperature on increased hydroxyl value. | ||
3.1.2.1 Experimental design of the RSM. In order to further optimize the reaction parameters for polyol synthesis, a RSM experiment was designed according to the Box-Behnken model based on the above single factorial experiments.8,13,14 A three-factor, three-level design that addressed the effects of molar ratio of H2O to polyol-143, reaction time, and reaction temperature on the increased hydroxyl value of polyols was selected. The RSM experimental design is presented in Table 1. The experimental increased hydroxyl value responses obtained at the design points are illustrated in Table 2. Fifteen experiments were included in the design, and the results were analyzed with multiple regressions using SAS 9.2 software.
| Independent variables | Symbols | −1 (low level) | 0 (mid-level) | 1 (high Level) |
|---|---|---|---|---|
| Molar ratio (mol mol−1) | X1 | 1 | 2 | 3 |
| Time (h) | X2 | 10 | 11 | 12 |
| Temperature (°C) | X3 | 40 | 45 | 50 |
| No. | X1 | X2 (h) | X3 (°C) | Y1 (mg KOH per g) |
|---|---|---|---|---|
| 1 | 1 | 10 | 45 | 39.6 |
| 2 | 1 | 12 | 45 | 55.8 |
| 3 | 3 | 10 | 45 | 51.3 |
| 4 | 3 | 12 | 45 | 56.7 |
| 5 | 2 | 10 | 40 | 41.9 |
| 6 | 2 | 10 | 50 | 49.8 |
| 7 | 2 | 12 | 40 | 45.6 |
| 8 | 2 | 12 | 50 | 58.9 |
| 9 | 1 | 11 | 40 | 47.7 |
| 10 | 3 | 11 | 40 | 53.5 |
| 11 | 1 | 11 | 50 | 60.4 |
| 12 | 3 | 11 | 50 | 62.3 |
| 13 | 2 | 11 | 45 | 66.7 |
| 14 | 2 | 11 | 45 | 67.3 |
| 15 | 2 | 11 | 45 | 65.5 |
The model for the increased hydroxyl values of the polyols was regressed, and can be expressed as follows (in terms of coded levels):
| Y1 = −1859.61 + 58.4625X1 + 245.875X2 + 20.6725X3 − 4.3625X1X1 − 2.7X1X2 − 0.195X1X3 − 11.2875X2X2 + 0.27X2X3 − 0.2465X3X3 |
Table 3 lists details of the ANOVAs and fitting statistics for the regression model. The regression equation obtained from the ANOVA yielded a R2 (multiple correlation coefficient) of 98.68% (a value >0.75 confirms fitness of the model), confirming the validity of the model. Furthermore, the ANOVA analysis also provided a P-value for the model (0.0004) and for lack of fit (0.1701), suggesting that the experimental data were well fitted by the model. The results indicated that the model terms X1, X2, X3, X12, X22, and X32 were significant (P < 0.05).
| Source | DF | SS | MS | F | Pr > F |
|---|---|---|---|---|---|
| a Significant at 5% level. | |||||
| X1 | 1 | 51.51125 | 51.51125 | 17.92007 | 0.0082a |
| X2 | 1 | 147.92 | 147.92 | 51.45938 | 0.0008a |
| X3 | 1 | 227.9113 | 227.9113 | 79.28727 | 0.0003a |
| X1X1 | 1 | 70.26981 | 70.26981 | 24.44592 | 0.0043a |
| X1X2 | 1 | 29.16 | 29.16 | 10.14437 | 0.0244a |
| X1X3 | 1 | 3.8025 | 3.8025 | 1.322839 | 0.3021 |
| X2X2 | 1 | 470.4283 | 470.4283 | 163.6557 | <0.0001a |
| X2X3 | 1 | 7.29 | 7.29 | 2.536093 | 0.1721 |
| X3X3 | 1 | 140.2206 | 140.2206 | 48.78086 | 0.0009a |
| Model | 9 | 1078.381 | 119.8201 | 41.6838 | 0.0004 |
| Linear | 3 | 427.3425 | 142.4475 | 49.55557 | 0.0004 |
| Quadratic | 3 | 610.7858 | 203.5953 | 70.82807 | 0.0002 |
| Cross product | 3 | 40.2525 | 13.4175 | 4.667768 | 0.0652 |
| Error | 5 | 14.3725 | 2.8745 | ||
| Lack of fit | 3 | 12.6925 | 4.230833 | 5.036706 | 0.1701 |
| Pure error | 2 | 1.68 | 0.84 | ||
| R2 = 98.68% | |||||
The overall effects of the reaction factors at each level and the responses could be clearly understood from the set of surface plots and contour plots (see Fig. 4).
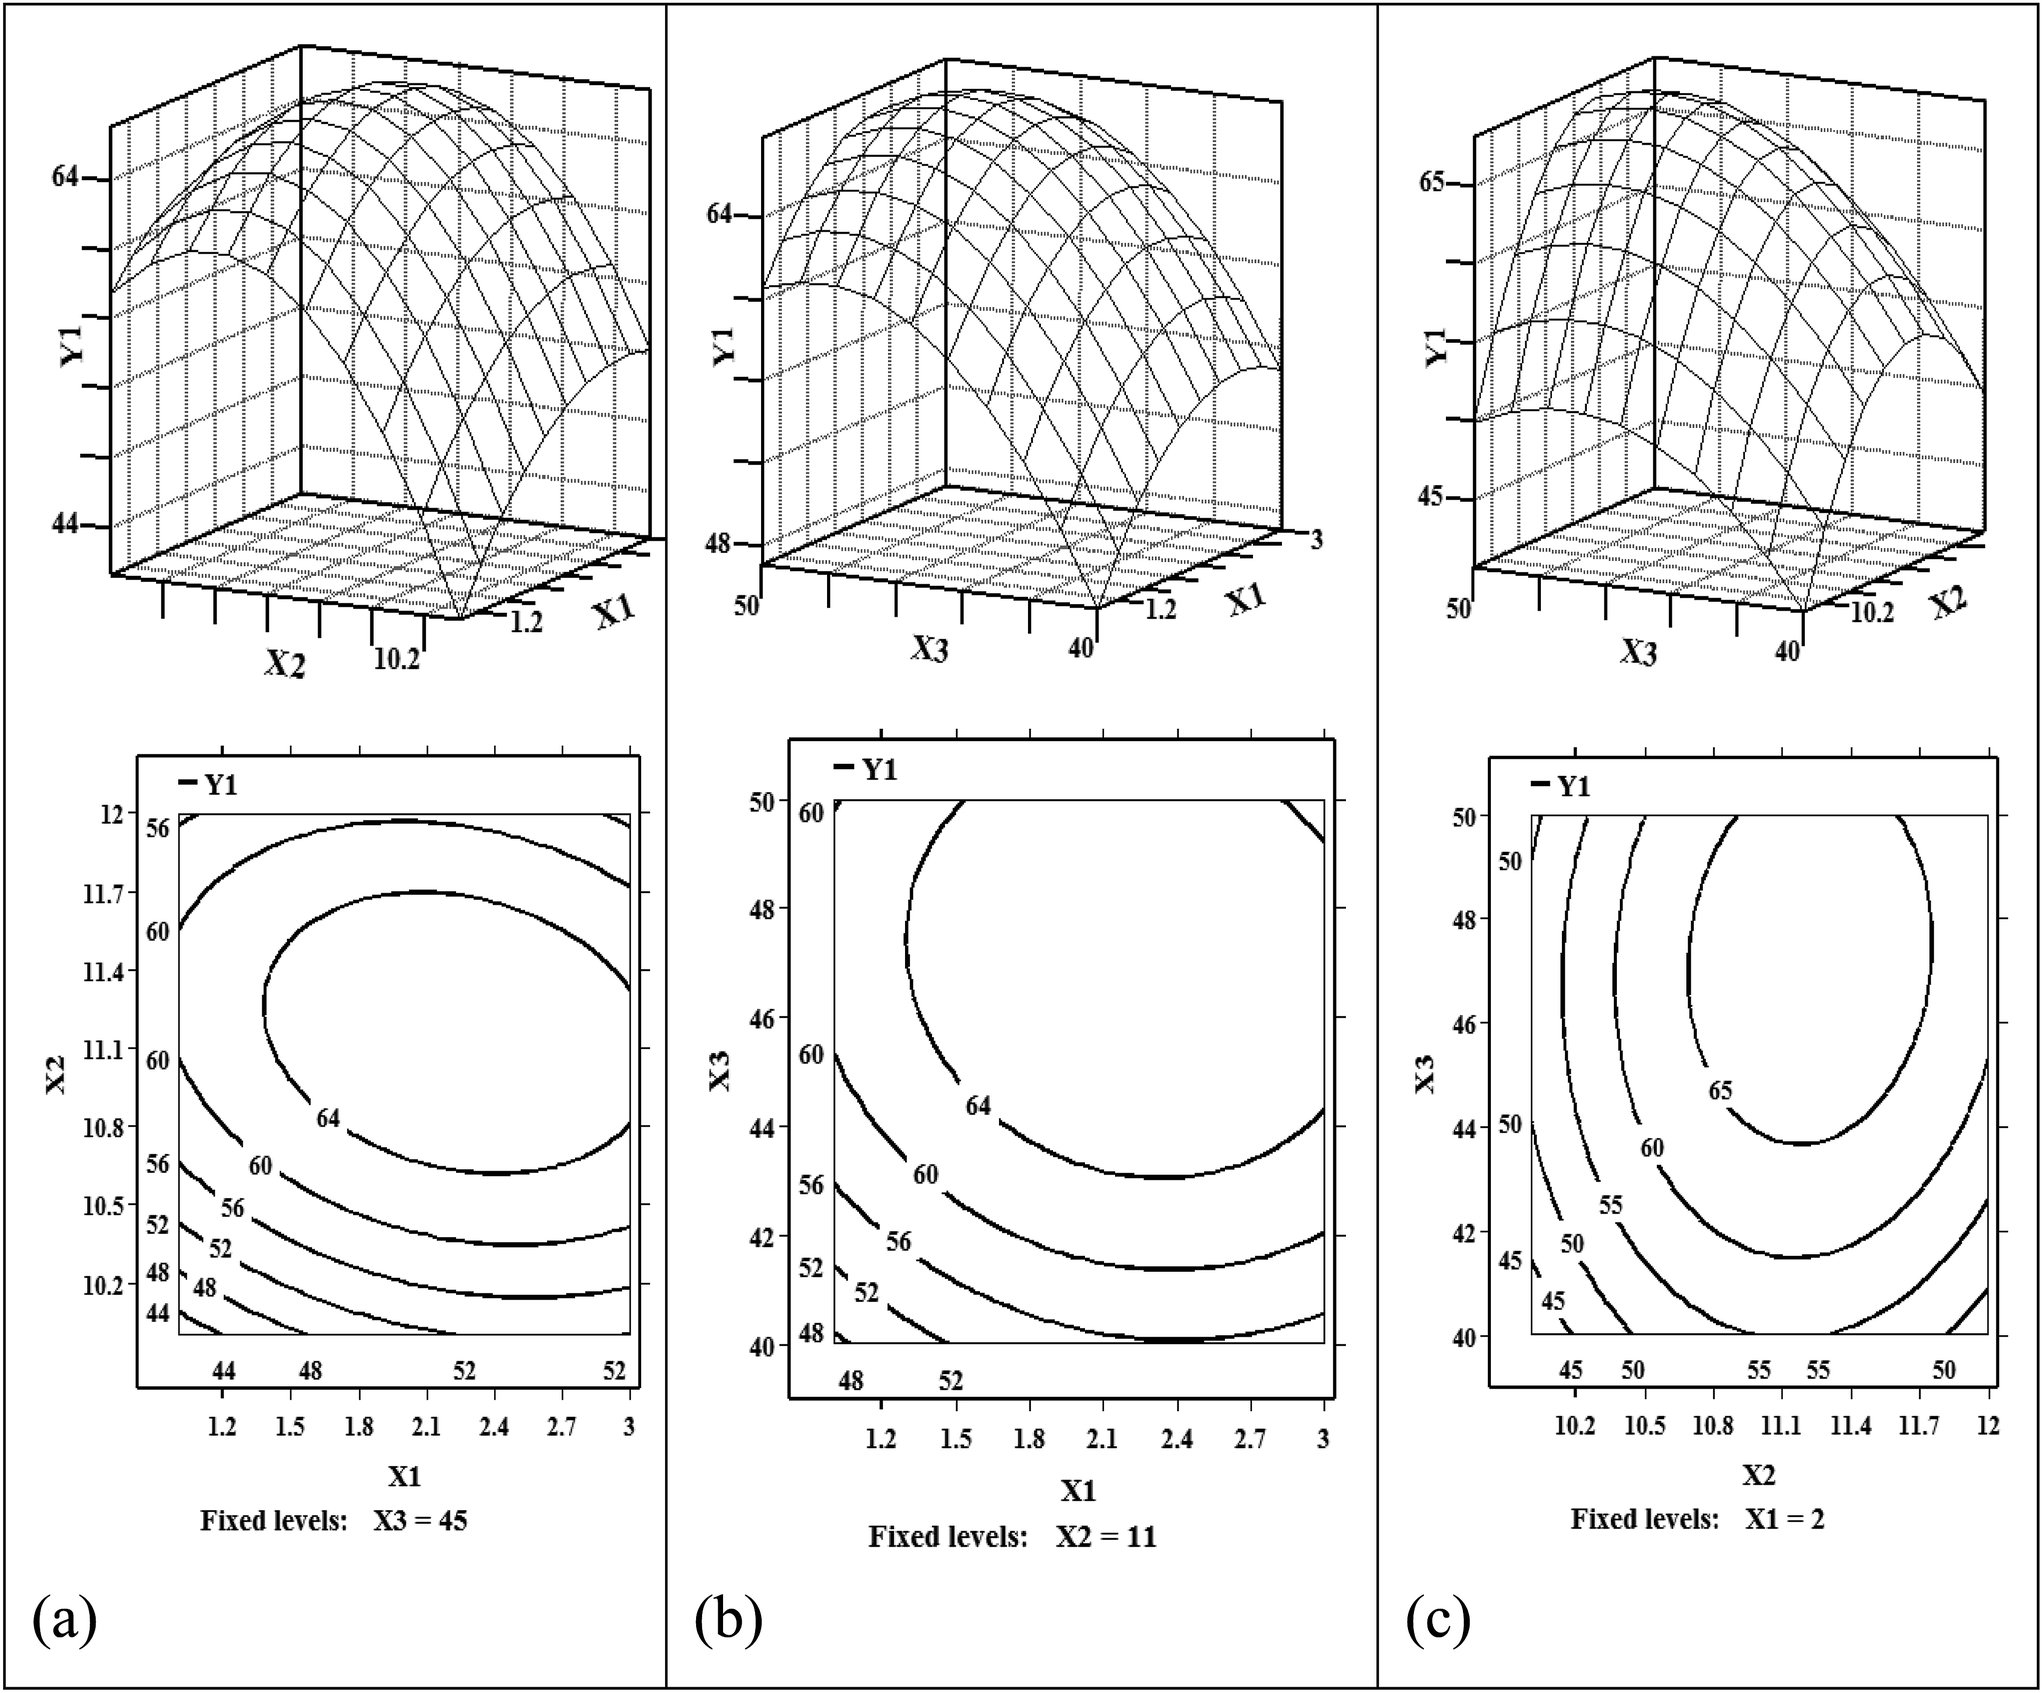 | ||
| Fig. 4 Response surface plots and contour plots of interaction between the three independent factors on increased hydroxyl value (a) X1 (molar ratio) and X2 (reaction time), (b) X1 (molar ratio) and X3 (reaction temperature), (c) X2 (reaction time) and X3 (reaction temperature). | ||
3.1.2.2 Validation of the RSM model. The optimized reaction conditions estimated through the model were a molar ratio of H2O to polyol-143 of 2.2
:1, a reaction time of 11.2 h, and a reaction temperature of 47.2 °C. Triplicate experiments were then conducted under the optimal conditions to validate the precision of the RSM model. The increased hydroxyl value of the polyol was 67.9 mg KOH per g, which perfectly coincided with the model predicted value of 68.3 ± 0.9. Thus, the developed model was accurate and suitable for predicting the hydroxyl value of the polyol.
| Sample | Hydroxyl value (mg KOH per g) | Acid value (mg KOH per g) | Viscosity (25 °C) (mm2 s−1) | Mw (g mol−1) |
|---|---|---|---|---|
| Polyol-143 | 143 | 1.4 | 2569 | 3010 |
| Polyol-211 | 211 | 3.2 | 3874 | 2180 |
C. rugosa lipase contains tunnel-like binding sites and prefers to bind to straight chain fatty acids rather than to bulky substrates.15 The fatty acid moieties with secondary alcohol groups on polyol-143 tend to bend and be bulky, and saturated fatty acid groups can probably fit more easily and rapidly into the active sites of C. rugosa lipase. Therefore, lipase partial hydrolysis can remove the undesirable saturated fatty acid moieties from polyol-143, and tends to produce a certain amount of primary alcohol groups.
The C. rugosa lipase powder solid from Sigma Aldrich contain not only the lipase catalyst, but also other auxiliary components such as enzyme stabilizer, inhibitor and preservative, which can inhibit the inactivation and oxidation of enzyme. After the lipase-catalyzed hydrolysis reaction, the product was treated by high speed centrifugation, but there were still some enzyme auxiliary agent residues in the ether phase. Therefore, the obtained polyol-211 had a greater viscosity and a lower molecular weight, compared to polyol-143.
High acid value of the polyol obtained by lipase hydrolysis can prolong reaction times in PU synthesis, as the carboxylic groups will undesirably consume isocyanates, forming unstable anhydrides.7 The high acid number product was therefore subjected to a washing step to remove most of the hydrolyzed acid groups and to reduce the acid number. Na2CO3 solution with pH in the range 11.0–13.0 could effectively saponify and remove most of the fatty acids in the ester glyceride phase.16
| Name | Palmitic | Stearic | Oleic | Linoleic | Linolenic | Iodine value (g of I2/100 g) |
|---|---|---|---|---|---|---|
| Soybean oil | 14.0 | 4.0 | 23.3 | 52.2 | 5.6 | 128.7 |
| Linseed oil | 5.0 | 4.0 | 22.0 | 17.0 | 52.0 | 180.0 |
| Sunflower oil | 6.5 | 2.0 | 45.4 | 46.0 | 0.1 | 120.2 |
| Peanut oil | 11.6 | 2.2 | 46.5 | 32.2 | — | 97.6 |
| Cottonseed oil | 22.1 | 2.8 | 19.4 | 53.5 | 2.3 | 109.4 |
| Palm oil | 41.8 | 3.4 | 41.9 | 11.0 | — | 43.3 |
| Rapeseed oil | 4.0 | 2.0 | 56.0 | 26.0 | 10.0 | 102.0 |
| Castor oil | 1.5 | 0.5 | 5.0 | 4.0 | 0.5 | 102.2 |
| Corn oil | 10.0 | 4.0 | 34.0 | 48.0 | — | 123.5 |
| SSO | 7.1 | 2.0 | 14.2 | 29.8 | 42.7 | 186.8 |
The SSO triglycerides have more than 10% of saturated fatty acid chains including 7.1% palmitic (16:0) and 2.0% stearic (18:0) fatty acid chains. And the largest non-functional branches on SSO-based polyols synthesized by epoxidation-hydroxylation are the saturated fatty acid branches. These saturated fatty acids reduce the reactivity of SSO-based polyols and affect the final PU properties.18 Lipase hydrolysis method can produce the primary alcohol groups in SSO-based polyol and replace the undesirable saturated fatty acid moieties. Furthermore, primary alcohols are usually more reactive with isocyanate than secondary alcohols. Therefore, the high reactivity of primary alcohol groups could improve the formulation of PU synthesis, for example it could reduce catalyst loading, or additive loading in the formulations.7
![[double bond, length as m-dash]](https://www.rsc.org/images/entities/char_e001.gif) O stretching vibration), 1562 cm−1 (N–H out-of-plane bending and C–N stretching vibrations), and 1244 cm−1 (ester C–O stretching vibration) confirmed the formation of urethane groups (–NH–(CO)–O–) after the reaction.19 The results suggest that PU143 and PU211 had been successfully prepared.
O stretching vibration), 1562 cm−1 (N–H out-of-plane bending and C–N stretching vibrations), and 1244 cm−1 (ester C–O stretching vibration) confirmed the formation of urethane groups (–NH–(CO)–O–) after the reaction.19 The results suggest that PU143 and PU211 had been successfully prepared.
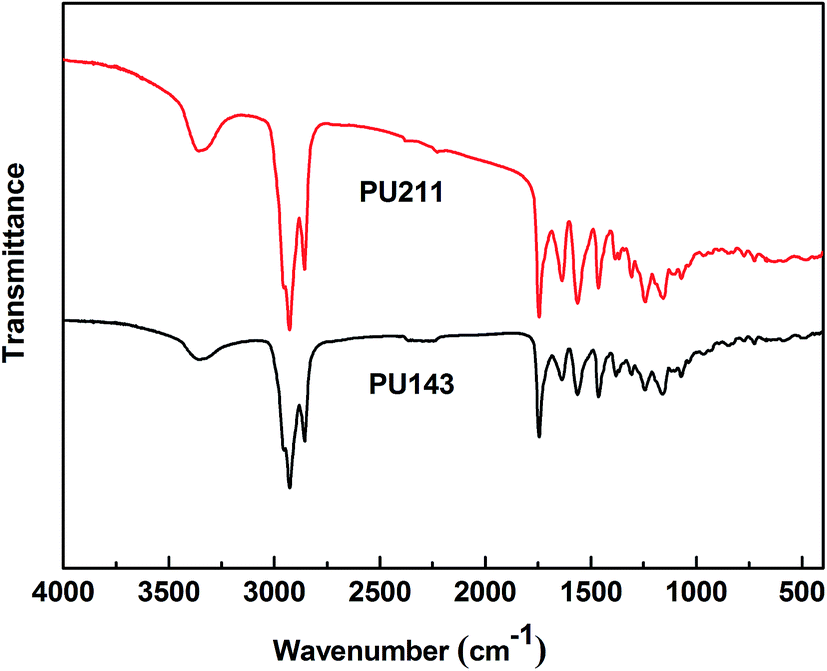 | ||
| Fig. 5 FTIR spectra of PU143 and PU211. | ||
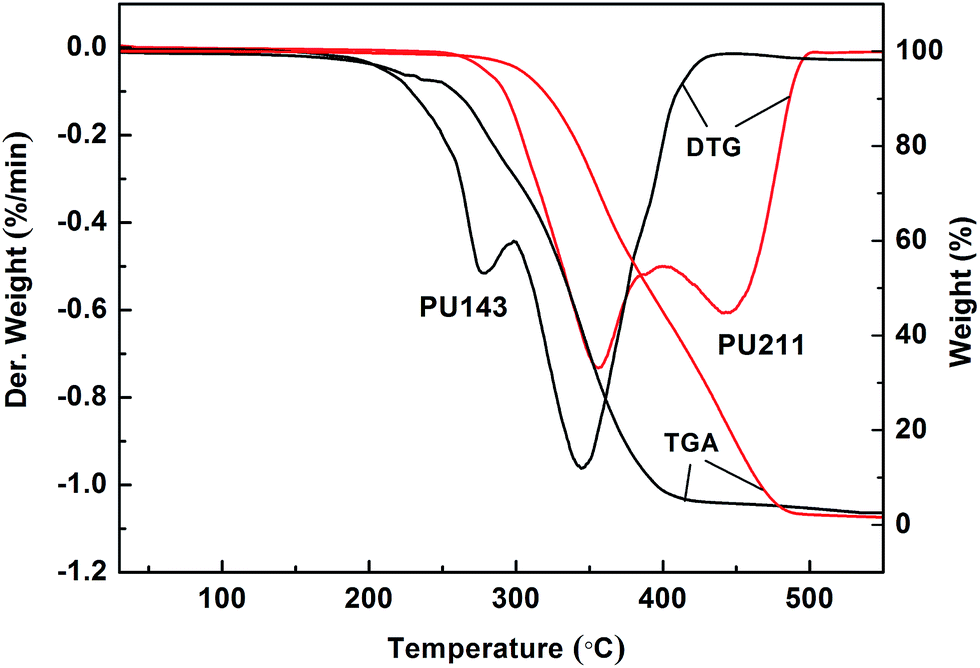 | ||
| Fig. 6 TGA and DTG curves of PU143 and PU211. | ||
DSC curves of PU143 and PU211 are presented in Fig. 7. The Tgs of PU143 and PU211 were determined as 40.9 °C and 60.6 °C, respectively. Therefore, the Tg value of PU211 was distinctly higher than that of PU143. Tg represents the mobility of polymer chains in the matrix at the molecular level, and an increase therein indicates a decrease in molecular movement in the polymer.21 Because polyol-211 with primary alcohol groups bears more hydroxyl groups than polyol-143, it can engage in more chemical interactions with isocyanate, resulting in more networks of polymer molecules and a higher Tg for PU211 compared with those for PU143. The increase in Tg for PU211 corresponds to an improvement in its mechanical properties, such as tensile strength and modulus.
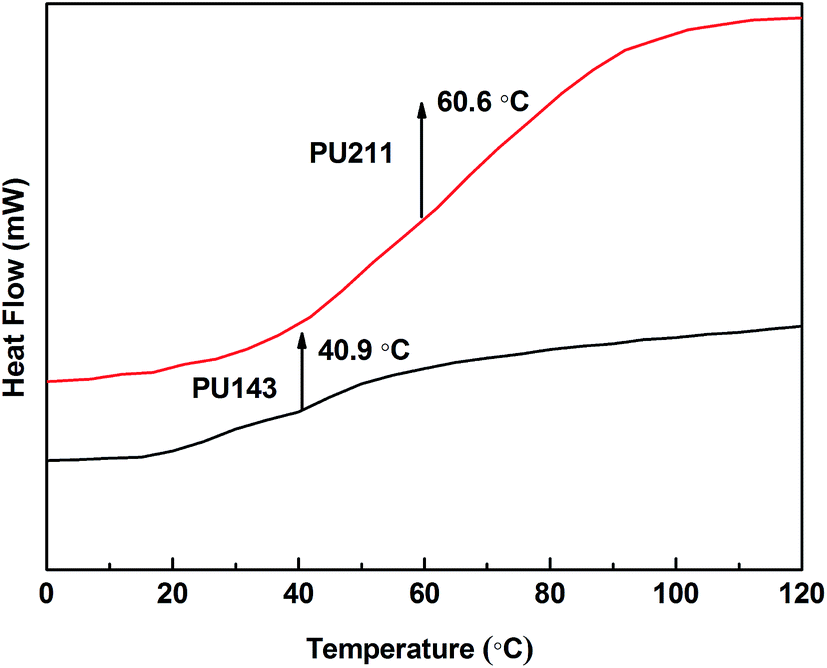 | ||
| Fig. 7 DSC curves of PU143 and PU211. | ||
| Sample | Tensile strength (MPa) | Elongation at break (%) | Young's modulus (MPa) |
|---|---|---|---|
| PU143 | 3.7 ± 0.2 | 293.5 ± 18.4 | 10.4 ± 0.9 |
| PU211 | 12.5 ± 0.8 | 168.3 ± 13.2 | 22.3 ± 2.4 |
Table 7 presents the thermal and mechanical properties of the PUs from SSO and other plant oils, such as soybean oil,26 linseed oil,27 sunflower oil,28 cottonseed oil,29 palm oil,30 rapeseed oil,31 castor oil,32 peanut oil and corn oil.33 The properties of PUs depend on the reactivity of plant oils, the properties of fatty acids, and their relative percentages.34 Table 7 lists the properties of SSO-based PU synthesized by epoxidation–hydroxylation and lipase hydrolysis, such as thermal stability, tensile strength and elongation at break, which are well matched with other types of plant-oil-PUs. Furthermore, DSC results illustrate Tg value of SSO-based PU211 is higher than that of other plant-oil-PUs. The rich hydroxyl numbers and primary alcohol groups of the polyol result in the higher cross-linking density in SSO-based PU211 chemical structure, which can benefit its properties.
| Sample | Tg (°C) | TGA | Tensile strength (MPa) | Elongation at break (%) | ||
|---|---|---|---|---|---|---|
| IDT (°C) | Tmax1 (°C) | Tmax2 (°C) | ||||
| Soybean oil | 20.9 | 242 | — | — | 4.5 ± 0.6 | 329.6 ± 47.2 |
| Linseed oil | 35.9 | 150 | 267 | 312 | 3.8 ± 1 | 256 ± 6 |
| Sunflower oil | 41 | — | 284 | 408 | 23.18 ± 0.8 | 750 ± 5 |
| Peanut oil | −9.2 | — | — | — | 2.27 ± 0.03 | 343 ± 10 |
| Cottonseed oil | — | — | — | — | 3.26 ± 0.50 | 2.44 ± 0.27 |
| Palm oil | 39.7 | 191.9 | 275 | 447 | 1.5 ± 0.3 | — |
| Rapeseed oil | 43.9 | 256 | 282 | 423 | 11.7 ± 0.8 | 420 ± 10 |
| Castor oil | −40.2 | 281 | 354 | 434 | 6.3 ± 0.3 | 389.1 ± 12.3 |
| Corn oil | −6.6 | — | — | — | 3.40 ± 0.23 | 322 ± 12 |
| SSO | 60.6 | 307.2 | 356.7 | 443.1 | 12.5 ± 0.8 | 168.3 ± 13.2 |
4. Conclusion
After epoxidation-hydroxylation of SSO to generate polyol-143, a single-factor design and RSM design methodology have been applied to optimize the lipase-catalyzed modification of polyol-143 to increase the number of primary alcohol groups. The results show good consistency between the predicted and experimental values, and R2 = 98.68% demonstrates a high significance for the regression model. The best result in terms of hydroxyl value of the modified polyol reached 211 mg KOH per g under optimal conditions of a molar ratio of H2O to polyol-143 of 2.2:1, a reaction time of 11.2 h, and a reaction temperature of 47.2 °C. Furthermore, two PUs have been synthesized from the obtained SSO-based polyols and IPDI by in situ polymerization. Characterization results revealed that the Tg of PU211 derived from the modified polyol-211 was 60.6 °C and its IDT was 307.2 °C, as compared to respective values of 40.9 °C and 224.6 °C for PU143 derived from polyol-143 directly generated by epoxidation-hydroxylation. The tensile strength and Young's modulus were also enhanced by 238% and 114%, respectively. This was because of the more extensive cross-linking networks in PU211 as compared to PU143 due to the higher reactivity of modified polyol-211 bearing primary alcohol groups introduced by lipase-catalyzed hydrolysis.
Acknowledgements
This work was financially supported by the National Natural Science Foundation of China (No. 31170078), the National High Technology Research and Development Program of China (No. 2011AA02A204 and 2013AA065805), the Natural Science Foundation of Hubei Province (No. 2015CFA085), and the Fundamental Research Funds for HUST (No. 2014NY007 and 2014QN119). We are indebted to the staff of the Analytical and Testing Center of HUST for their valuable assistance in obtaining the FTIR, TGA, and DSC measurements.References
- M. Desroches, M. Escouvois, R. Auvergne, S. Caillol and B. Boutevin, Polym. Rev., 2012, 52, 38–79 CrossRef CAS.
- A. Zlatanić, C. Lava, W. Zhang and Z. S. Petrović, J. Polym. Sci., Part B: Polym. Phys., 2004, 42, 809–819 CrossRef.
- P. P. Kiatsimkul, G. J. Suppes, F. H. Hsieh, Z. Lozada and Y. C. Tu, Ind. Crops Prod., 2008, 27, 257–264 CrossRef CAS.
- Y. Y. Gao, W. W. Chen, H. Lei, Y. Liu, X. Lin and R. Ruan, Biomass Bioenergy, 2009, 33, 277–282 CrossRef CAS.
- A. E. Atabani, A. S. Silitonga, H. C. Ong, T. M. I. Mahlia, H. H. Masjuki, I. A. Badruddin and H. Fayaz, Renewable Sustainable Energy Rev., 2013, 18, 211–245 CrossRef CAS.
- A. L. Ahmad, N. H. M. Yasin, C. J. C. Derek and J. K. Lim, Renewable Sustainable Energy Rev., 2011, 15, 584–593 CrossRef CAS.
- P. P. Kiatsimkul, G. J. Suppes and W. R. Sutterlin, Ind. Crops Prod., 2007, 25, 202–209 CrossRef CAS.
- C. Ke, X. Li, S. Huang, L. Xu and Y. Yan, RSC Adv., 2014, 4, 57810–57818 RSC.
- P. P. Kiatsimkul, W. R. Sutterlin and G. J. Suppes, J. Mol. Catal. B: Enzym., 2006, 41, 55–60 CrossRef CAS.
- G. Wu, X. He, L. Xu, H. Zhang and Y. Yan, RSC Adv., 2015, 5, 27097–27106 RSC.
- G. E. P. Box and K. B. Wilson, J. R. Stat. Soc. Series B Stat. Methodol., 1951, 13, 1–45 Search PubMed.
- G. Wu, Y. Fan, X. He and Y. Yan, RSC Adv., 2015, 5, 80893–80900 RSC.
- X. Yao, G. Wu, L. Xu, H. Zhang and Y. Yan, RSC Adv., 2014, 4, 31062–31070 RSC.
- Y. Fan, G. Wu, F. Su, K. Li, L. Xu, X. Han and Y. Yan, Fuel, 2016, 178, 172–178 CrossRef CAS.
- S. H. Krishna and N. G. Karanth, Catal. Rev.: Sci. Eng., 2002, 44, 499–591 CAS.
- D. G. Hayes, K. D. Carlson and R. Kleiman, J. Oil Fat Ind., 1996, 73, 1113–1119 CAS.
- M. A. Mosiewicki and M. I. Aranguren, Eur. Polym. J., 2013, 49, 1243–1256 CrossRef CAS.
- Z. S. Petrović, A. Wei Zhang and I. Javni, Biomacromolecules, 2005, 6, 713–719 CrossRef PubMed.
- C. Wang, X. Chen, H. Xie and R. Cheng, Composites, Part A, 2011, 42, 1620–1626 CrossRef.
- A. K. Barick and D. K. Tripathy, Mater. Sci. Eng., B, 2011, 176, 1435–1447 CrossRef CAS.
- J. Wang and H. Xie, Soft Matter, 2005, 1, 962–964 Search PubMed.
- X. Kong, G. Liu, H. Qi and J. M. Curtis, Prog. Org. Coat., 2013, 76, 1151–1160 CrossRef CAS.
- K. Dusek, Macromolecules, 1984, 17, 716–722 CrossRef CAS.
- Y. L. Lee, P. H. Sung, H. T. Liu, L. C. Chou and W. H. Ku, J Appl. Polym. Sci., 1993, 49, 1013–1018 CrossRef CAS.
- A. Zlatanić, Z. S. Petrović and K. Dusek, Biomacromolecules, 2002, 3, 1048–1056 CrossRef.
- Y. Lu, Y. Xia and R. C. Larock, Prog. Org. Coat., 2011, 71, 336–342 CrossRef CAS.
- C. W. Chang and K. T. Lu, Prog. Org. Coat., 2013, 76, 1024–1031 CrossRef CAS.
- B. Das, U. Konwar, M. Mandal and N. Karak, Ind. Crops Prod., 2013, 44, 396–404 CrossRef CAS.
- Z. He, D. C. Chapital, H. N. Cheng, K. T. Klasson, O. M. Olanya and J. Uknalis, Ind. Crops Prod., 2014, 61, 398–402 CrossRef CAS.
- K. Haji, Biobased Polyurethane from Palm Kernel Oil-Based Polyol, 2012 Search PubMed.
- A. Fridrihsone, U. Stirna, B. Lazdiņa, M. Misāne and D. Vilsone, Eur. Polym. J., 2013, 49, 1204–1214 CrossRef CAS.
- T. Gurunathan, S. Mohanty and S. K. Nayak, Prog. Org. Coat., 2015, 80, 39–48 CrossRef CAS.
- T. F. Garrison, M. R. Kessler and R. C. Larock, Polymer, 2014, 55, 1004–1011 CrossRef CAS.
- M. R. Islam, M. D. H. Beg and S. S. Jamari, J. Appl. Polym. Sci., 2014, 131, 9016–9028 CrossRef.
| This journal is © The Royal Society of Chemistry 2017 |