 Open Access Article
Augmentation of air cathode microbial fuel cell performance using wild type Klebsiella variicola
M. Amirul Islama,
Ahasanul Karimb,
Chee Wai Woona,
Baranitharan Ethiraja,
Chin Kui Cheng ac,
Abu Yousufb and
Md Maksudur Rahman Khan
 *ac
*ac
aChemical and Natural Resources Engineering, University Malaysia Pahang, 26300, Pahang, Malaysia. E-mail: mrkhancep@yahoo.com
bFaculty of Engineering Technology, University Malaysia Pahang, 26300, Pahang, Malaysia
cCentre of Excellence for Advanced Research in Fluid Flow (CARIFF), University Malaysia Pahang, 26300, Pahang, Malaysia
First published on 17th January 2017
Abstract
In the present work, simultaneous power generation and wastewater treatment in the single chamber air cathode microbial fuel cell (MFC) have been enhanced by introducing wild-type Klebsiella variicola (K. variicola) as an efficient inoculum for the anode operated with palm oil mill effluent (POME). K. variicola was isolated from municipal wastewater (MWW) and identified using BIOLOG gene III analysis, PCR and sequencing. The performance of K. variicola in MFC was evaluated by polarization curve measurement, electrochemical impedance spectroscopy (EIS) and cyclic voltammetry (CV) analysis. The MFC with K. variicola achieved a maximum power density of about 1.7 W m−3 which is comparatively higher than most widely used anaerobic sludge (215 mW m−3) as an inoculum whereas COD removal efficiency is (43%) lower than anaerobic sludge (74%). Moreover, K. variicola has the ability to produce electron shuttles and to form biofilms on the electrode surface which helps to significantly reduce the anode charge transfer (Rct) resistance compared to the anaerobic sludge. These results revealed the potential of K. variicola to be used in MFC.
1. Introduction
Energy needs are increasing day by day in the contemporary world and in an attempt to aid energy friendliness, research initiatives are being emphasized on alternative and renewable energy sources.1 Conversion of biological energy to electrical energy using electrochemically active microorganisms through microbial fuel cells (MFCs) is one of the environmentally friendly, renewable and sustainable technologies.2 Microbial fuel cells can utilize both simple (glucose, acetate, sucrose and amino acid) and complex substrates such as palm oil mill effluent (POME),3 municipal, dairy, brewery, paper mill and swine wastewater, etc. by using microorganisms.4 Conventionally the anaerobic sludge (AS) is proffered as an inoculum for electricity generation and treatment of industrial wastewater using MFC technology.1 However, AS shows very poor performance in electricity generation1,3 due to the presence of unwanted microorganisms such as methanogenic microorganisms which suppresses the growth of electrogenic bacteria. Moreover, methanogenesis diverts energy away from electrogenesis, thus it may reduce coulombic energy from electrogenesis.5 Chae et al., 2010 (ref. 6) reported that 66% of electron loss occurred solely due to methanogenesis while AS was used as inoculum in MFC.Until now, very few pure cultures have been studied in MFC operated with wastewater.3 reported that the pure culture P. aeruginosa ZH1 produced 451.26 mW m−2 using POME as substrate. Pure isolates, such as Geobacter, Shewanella, Clostridium and Klebsiella species7 proved their superior performance in the MFCs using simple substrates. But, all the fermentative and electrogenic bacteria are not capable to utilize all types of complex substrates like industrial and domestic wastewater. Therefore, finding microorganisms which are capable of utilizing a diverse range of substrates and generating electricity will be beneficial for the practical application of MFC.7
K. variicola (Enterobacteriaceae) has been described recently as a new bacterial species and is closely related to K. pneumoniae and also identical in phenotypic and biochemical characteristics.8 K. variicola can consume polysaccharides and be able to use xylan and lignin as the sole carbon source more effectively than other isolates9. K. variicola is a typical member of Klebsiella (genera) which utilizes various kinds of substrates such as alanine, arabinose, D-arabitol, L-aspartate, D-cellobiose, citrate, D-fructose, L-fructose, D-galactose, gentiobiose, glucose, glycerol, myoinositol, lactate, lactose, malate, maltose, D-mannitol, D-mannose, D-melibiose, L-proline, D-raffinose, L-rhamnose, L-serine, D-sorbitol, sucrose and D-trehalose.10
POME is considered as one of the complex substrates comprising various range of nutrients such as cellulose, lignin, lipids, amino acids, organic acids etc.11 As far as the authors are concerned, none reported on wild type K. variicola which utilizes broad range of substrates for electricity generation in MFC especially those fuelled with POME wastewater. Therefore, in this present work, wild type K. variicola was studied as biocatalyst in single chamber air cathode MFC using POME as substrate and the performance was compared with the AS. The electrochemical properties of the biofilm formed by K. variicola was characterized by cyclic voltammetry (CV) and electrochemical impedance spectroscopy (EIS) and correlated with the MFC performances as a function of time.
2. Materials and methods
2.1 Sample collection and characterization
Palm oil mill effluent (POME) was collected from Panching Palm Oil Mill (FELDA) in Kuantan, Pahang, Malaysia. The sample was collected before the effluent discharge into the mixing pond at about 80–90 °C. Anaerobic sludge was collected from bottom sampling port of currently running anaerobic digester of palm oil mill and municipal wastewater (MWW) was collected from drainage discharge point of Kuantan city, Malaysia and filtered using A1 filter paper to be used as an inoculum in the anode chamber of air cathode MFC. All samples were stored in sterilized glass bottle at 4 °C. The chemical oxygen demand (COD), biological oxygen demand (BOD), total solids (TS), total suspended solids (TSS), nitrate nitrogen (NN) and total dissolved solids (TDS) were analyzed by standard methods (APHA 1995).2.2 Isolation of microorganism
An air cathode MFC was operated in batch mode using POME as substrate and MWW as inoculum. After 12 days of operation, the biofilm present on the anode surface was carefully scraped using sterile spatula and suspended in a phosphate buffer solutions (pH = 7). The bacterial suspension was serially diluted (10−1 to 10−6) and the pure culture bacteria were obtained from 10−6 dilution using the spread plate technique. The enrichment of the cultures was carried out by preparing an overnight culture in LB (Luria Bertani) broth (10% v/v) incubated at 37 °C with shaking at 150 rpm. Biochemical tests were done for the primary identification of the isolated bacteria and it was found as Klebsiella.2.3 16S rRNA analysis of microorganisms
2.4 Cathode preparation
The electrocatalyst, MnO2 and the electrode were prepared using the method as described by ref. 13. In brief, the catalyst ink was prepared by mixing as-prepared MnO2 with 0.15 mL of 5 wt% Nafion solution and 0.15 mL of isopropanol. The catalyst ink was ultrasonicated for 20 min. The prepared MnO2 ink was evenly dispersed onto a 2 mm thick polyacrylonitrile carbon felt (PACF) surface with the dispersion area of 7 cm2. The Nafion 117 membrane (Dupont Co., USA) with a dimension of 5 cm × 5 cm was boiled in 0.1 M H2SO4 solution for 30 min, followed by boiling in deionized water for 1 h. Pre-treated membranes were kept in deionized water overnight at room temperature before use. The membrane-electrode-assembly (MEA) was prepared by hot pressing catalyst/PACF with the pre-treated Nafion 117 membrane for 2 min at both sides. The press temperature and pressure were set at 100 °C and 1 bar, respectively.2.5 MFC construction
The single chamber air cathode MFC was built with a cubic plexi glass which has a dimension of 5 cm × 5 cm (Shanghai, Sunny Scientific, China) and a total working volume of 25 mL. Carbon brush and PACF were used as anode and cathode electrode respectively. The membrane electrode assembly (MEA) was placed at the front opening side of the cubic chamber by facing the membrane side towards the anode substrate and the cathode (PACF) towards the open part of the MFC. After that, the whole MFC setup was tighten up with screws. The anode compartment was then filled with POME and the pure culture bacteria were subsequently inoculated into it. Finally, the anode chamber was flushed with N2 for 1 h and tightly closed. The anode and cathode electrodes were connected by using titanium wires with a rheostat (Crotech DRB-9, UK) to form a circuit. The single chamber fuel cells were operated in batch condition for 12 days at ambient temperature from 25 to 28 °C. The schematic diagram of single chamber microbial fuel cell is shown in Fig. 1.2.6 Measurement and analyses
The voltage across an external resistance (1 kΩ) in the MFC circuit was monitored at regular intervals (15 min) using a digital multimeter with data logger (Fluke 289 True RMS Multimeter, USA). Polarization curves at different time intervals were obtained by varying the external resistance from 50 to 20![[thin space (1/6-em)]](https://www.rsc.org/images/entities/char_2009.gif) 000 Ω using the rheostat (Crotech DRB-9, UK). Power density normalized by volume (PV, W m−3) was calculated using the following equation.
000 Ω using the rheostat (Crotech DRB-9, UK). Power density normalized by volume (PV, W m−3) was calculated using the following equation.| P = VI | (1) |
| PV = V2/vR | (2) |
2.7 FESEM analysis of biofilm
Biofilm formation was visualized at different time intervals of anode electrode using FESEM (Model: JEOL JSM7800F) at 5 kV. The samples were prepared by cutting small portions (1 cm) of the anode electrodes with bacteria on the surface from the anode chamber thereafter it was rinsed with sterile medium and followed by immediate soaking of samples into the anaerobic solution of 3% glutaraldehyde. The samples were then washed twice with 0.1 M phosphate buffer and dehydrated by successive 10 minutes incubations in 40%, 60%, 80%, 90% and 100% ethanol. The samples were then dried with a critical-point drier and coated with platinum using an ion-sputter to a thickness of 10 nm. Finally, the specimens were examined by FESEM.2.8 FTIR analysis of biofilm
The FTIR samples (carbon brush) were prepared by oven drying at 103 °C for 24 hours to remove water, and followed by grinding with dry KBr at 1 wt% of sample. Thereafter, Nicolet Avatar 370 DTGS FT-IR spectrophotometer was used to analyze the samples under N2 with a dry KBr background.2.9 Cyclic voltammetry analysis
Cyclic voltammetry (CV) was used to analyze the catalytic behaviour of the MFCs. The electrocatalytic behaviour and interaction between the biofilm (biocatalyst) and the anode of the MFC can be characterized by CV analysis. Moreover, it helps to elucidate the specific role of redox mediators, membrane bound cytochrome and electron conducting pili in the electrochemical reactions.14 The CV was conducted in turnover conditions where the electron donor is provided to cells, causing an electron flow that can be varied as a function of electrode potential. The potential is typically changed very slowly, so that at each applied potential, all proteins involved in the pathway are oxidized and reduced.15 The CV data was recorded by using a PARSTAT 2273 electrochemical system (USA). In order to collect CV data three electrode system was applied where anode and cathode were used as working and counter electrodes respectively. Ag/AgCl (sat. KCl, 222 mV vs. SHE) electrode was used as reference electrode which was placed in the vicinity of the anode electrode surface during CV operation. Before plugging the reference electrode in the anode chamber, it was disinfected by 75% ethanol (Sigma). The CV was performed using 30 mV s−1 scan rate at potential range from +1.0 to −1.0 V. Nitrogen gas was purged for 15 min before the electrochemical measurements.2.10 Electrochemical impedance spectroscopy
Electrochemical impedance spectroscopy (EIS) study was performed using an electrochemical workstation (PARSTAT 2273, USA). A three electrode system was used to examine the anode electrode where anode, cathode and saturated Ag/AgCl electrodes were used as working, counter and reference electrode respectively. The reference electrode was placed as close as possible to the anode electrode.16 EIS tests were performed with AC signal amplitude of 10 mV, at 40 logarithmic frequency steps between 100 kHz and 5 mHz. To obtain key parameters such as electrochemical ohmic resistance, charge transfer resistance, mass transfer resistance etc. for the anode, the impedance data were fitted to R(Q[RW]) equivalent electrical circuit. The impedance spectra (Nyquist plots) were analyzed using Zview software.3. Results and discussion
3.1 Isolation and characterization of predominant microorganisms in the biofilm
The most predominant microorganism present in the MWW was isolated and identified as K. variicola. The 16S rRNA sequence data of the isolate K. variicola was deposited into the Genbank database under the accession number of KT716257. K. variicola is a Gram negative, rod-shaped bacterium from the Enterobacteriaceae family and it is non-spore forming, non-motile, and fermentative bacteria which can be readily isolated from water and soil environments.8,17 The phylogenetic relationship of the isolate K. variicola is shown in Fig. 2.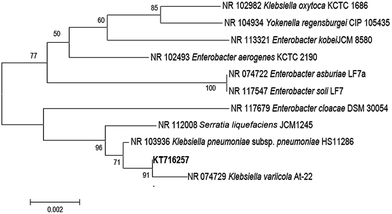 | ||
| Fig. 2 Phylogenetic tree was constructed using neighbor-joining method and numbers indicated the bootstrap values derived from 1000 replicates. Sequences were aligned using Clustal W and MEGA 5.0 was used to construct phylogenetic tree.18 | ||
3.2 Performance of K. variicola in MFC
The MFCs were fed with different concentrations of POME with an initial COD of 68![[thin space (1/6-em)]](https://www.rsc.org/images/entities/char_2009.gif) 360 mg L−1 (100%), 34
360 mg L−1 (100%), 34![[thin space (1/6-em)]](https://www.rsc.org/images/entities/char_2009.gif) 180 mg L−1 (50%), 17
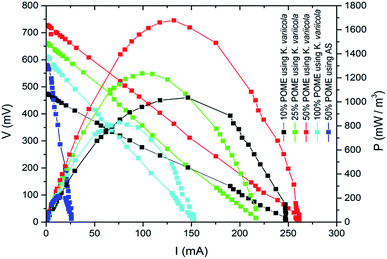
180 mg L−1 (50%), 17![[thin space (1/6-em)]](https://www.rsc.org/images/entities/char_2009.gif) 090 mg L−1 (25%) and 6836 mg L−1 (10%). Wild type K. variicola was used as inoculum for all the experiments. The 1 mL of inoculum was pipetted from K. variicola liquid culture and added into anode compartments of each MFC containing 20 mL of POME with different concentrations of COD. Generally, longer time is required to achieve significant power generation in MFC while operated with pure culture bacteria rather than with the anaerobic sludge.3 But in this experiment, higher power was generated within few hours in a single chamber air cathode reactor inoculated with K. variicola using POME. Fig. 3 depicts the power density of MFC with K. variicola and AS varies with different dilutions of initial COD. Among the different concentrations of MFC with K. variicola, 50% of initial COD showed higher volumetric power density of 1677.61 mW m−3 compared to 25% (1236.77 mW m−3), 10% (1040.58 mW m−3) and 100% (805.35 mW m−3) of initial COD. In 100% POME, lower power output was obtained due to higher substrate concentrations which might have inhibited the growth and distorted the metabolism of microorganisms.19 The power generation from POME in the MFC system using AS and K. variicola was compared and presented in Fig. 3. It was found that the power density obtained in MFC with 50% of initial COD was about eight times higher compared to the MFC using AS (215 mW m−3).
090 mg L−1 (25%) and 6836 mg L−1 (10%). Wild type K. variicola was used as inoculum for all the experiments. The 1 mL of inoculum was pipetted from K. variicola liquid culture and added into anode compartments of each MFC containing 20 mL of POME with different concentrations of COD. Generally, longer time is required to achieve significant power generation in MFC while operated with pure culture bacteria rather than with the anaerobic sludge.3 But in this experiment, higher power was generated within few hours in a single chamber air cathode reactor inoculated with K. variicola using POME. Fig. 3 depicts the power density of MFC with K. variicola and AS varies with different dilutions of initial COD. Among the different concentrations of MFC with K. variicola, 50% of initial COD showed higher volumetric power density of 1677.61 mW m−3 compared to 25% (1236.77 mW m−3), 10% (1040.58 mW m−3) and 100% (805.35 mW m−3) of initial COD. In 100% POME, lower power output was obtained due to higher substrate concentrations which might have inhibited the growth and distorted the metabolism of microorganisms.19 The power generation from POME in the MFC system using AS and K. variicola was compared and presented in Fig. 3. It was found that the power density obtained in MFC with 50% of initial COD was about eight times higher compared to the MFC using AS (215 mW m−3).
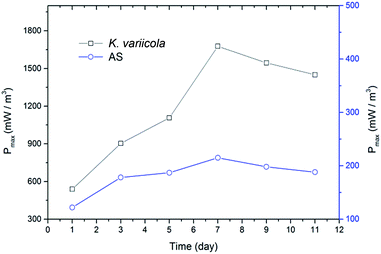
K. variicola might have produced electron shuttle for facilitating the extracellular electron transfer as reported in Klebsiella pneumoniae which produces 2,6-DTBBQ as electron shuttle.20 Since K. variicola is closely related to an electrogen K. pneumoniae and also very identical in phenotypic and biochemical characteristics,20 it might have similar properties as that of K. pneumoniae. Therefore, the production of electron shuttles could be the reason for the higher power generation in this experiment. Fig. 4 shows the maximum power densities obtained from polarization curve with 50% of initial COD over time. It can be seen that, the maximum power density gradually increased with time and reached a peak on 7th day of MFC operation and thereafter it slightly declined.
The maximum power generation in the present study has been compared with the literature and presented in Table 1. Although, the power generation of MFC can be influenced by different factors such as cathode catalysts, anode inoculum, substrate concentration, reactor design, type of electrodes etc. However, among them, anode inoculum plays an important role in influencing the performance of MFC.21 Therefore, in our study, anode inoculum was considered for comparison21 with literature reports. Usually for complex wastewater, AS was used as inoculum because it has variety of microorganisms that can utilize wide range of substrates.13,20–22 But AS was not be able to produce higher power due to the presence of dominant unwanted microorganisms (non electricity producing microorganisms) which suppresses the growth of electricity producing microorganisms. Even some pure cultures such as Pseudomonas putida25 also used in MFC with complex wastewater as shown in Table 1 however the performance was not satisfactory. But, since K. variicola has the ability to utilize broad range of substrates, it can be used as an inoculum for complex wastewater. Even the COD removal efficiency results clearly showed its ability to utilize the broad range of substrates. As can be seen from the results K. variicola has potential to show better power performance than AS using complex wastewater and the performance can be improved by mixing K. variicola with other microorganisms in the future. Moreover, further research is required to observe the influence of different cathode catalysts on the power generation of MFCs.
| Type of substrate | COD (mg L−1) | Type of electrode material | Inoculum | Power density (W m−3) | Cathode catalyst | COD removal efficiency | Anode volume (mL) | Reference |
|---|---|---|---|---|---|---|---|---|
| a The values were recalculated to show in W m−3 but originally it was reported in W m−2, SS – stainless steel, PT – polytetra. | ||||||||
| POME | 34![[thin space (1/6-em)]](https://www.rsc.org/images/entities/char_2009.gif) 180 180 |
Carbon brush | K. variicola | 1.667 | MnO2 | 43 | 20 | This study |
| POME | 34![[thin space (1/6-em)]](https://www.rsc.org/images/entities/char_2009.gif) 180 180 |
Carbon brush | AS | 0.215 | MnO2 | 74 | 20 | This study |
| POME | 1060 | Carbon brush | AS | 0.671 | MnO2–CNT | 22 | 20 | 13 |
| University Connecticut wastewater | 300 | Carbon cloth | AS | 1.10 | PT ethylene | 70 | 100 | 22 |
| Dairy wastewater | 2800 | Carbon cloth | AS | 0.0442 | SS mesh | 82 | — | 23 |
| Canteen wastewater | 1130 | Graphite plate | AS | 0.08a | — | 65 | — | 24 |
| Oil refinery wastewater | 2213 | Carbon cloth | Pseudomonas putida | 0.09a | PT ethylene | 0.06 | — | 25 |
3.3 POME treatment efficiency
POME was characterized before and after treatment and as presented in Table 2. It can be seen that, MFC inoculated with K. variicola achieved maximum COD removal efficiency of 43% after 12 days of operation which was comparatively lower than AS (74%). Moreover, the significant amount of COD removal achieved in this study using K. variicola suggesting that it can able to utilize complex substrates. Although, AS obtained higher COD removal efficiency but achieved significantly lower power compared to K. variicola indicating that the COD was lost mainly due to hydrogen production, methanogenesis and aerobic degradation.26| Parameters | Before treatment (mg L−1) | After 12 days of treatment (mg L−1) | Removal efficiency (%) |
|---|---|---|---|
| a COD-chemical oxygen demand, BOD-biological oxygen demand, TS-total solids, TSS-total suspended solids, NN-nitrite nitrogen, TDS-total dissolve solids. | |||
| COD | 34![[thin space (1/6-em)]](https://www.rsc.org/images/entities/char_2009.gif) 180 180 |
19![[thin space (1/6-em)]](https://www.rsc.org/images/entities/char_2009.gif) 538 538 |
42.83 |
| BOD | 14![[thin space (1/6-em)]](https://www.rsc.org/images/entities/char_2009.gif) 100 100 |
8648 | 38.66 |
| TS | 14![[thin space (1/6-em)]](https://www.rsc.org/images/entities/char_2009.gif) 054 054 |
5613 | 60.06 |
| TSS | 4790 | 1579 | 65.59 |
| NN | 78 | 43 | 44.87 |
| TDS | 7400 | 3616 | 51.12 |
3.4 FESEM and FTIR analysis of biofilm
The formation of biofilm is vital for MFC because it significantly influences the electron transfer through the extracellular polymeric substances.27 FESEM analysis was done to visualize the biofilm on anode electrode surface before and after operation (on 3rd, 7th and 11th day) of MFC, and the results have been presented in Fig. 5a–d. On day 3, as shown in Fig. 5b, rod shaped K. variicola were scattered around the electrode and loosely associated microbial clumps were observed in some places of electrode surface. Besides that, it can be seen that on 3rd day, incomplete biofilm was formed because during the initial period, bacteria started to colonize on the electrode surface thereby achieved lower performance. Thereafter, these cells adhered to each other and frequently embedded within a self-produced matrix of extracellular polymeric substance (EPS) that transformed to effective biofilm and exhibited higher performance on day 7 as shown, Fig. 5c. However, on day 11, it can be seen that the higher number of bacterial cells colonized on the electrode surface and therefore the electrode was almost covered by the biofilm as shown in Fig. 5d. Our previous study showed that the anode biofilm accumulated dead cells over time and which can be particularly detrimental for the performance of MFCs.28 The dead cells accumulated over the time might be the reason for achieving lower performance on 11th day of operation (Fig. 4). Anodic electrode materials (carbon brush) were tested by FT-IR before and after MFC treatment with K. variicola and the results are shown in Fig. 6. The band at 3050 cm−1 can be attributed to the functional group of C–H and at 2850 cm−1 can be attributed to the characteristic C–H stretching vibrations of –CH3 and![[double bond, length as m-dash]](https://www.rsc.org/images/entities/char_e001.gif) CH2 functional groups dominate.29 The peak from 2930 to 2860 cm−1 might be due to the presence of lipids in the biofilm30 while the band observed between 2200–2260 cm−1 attributed to (–C
CH2 functional groups dominate.29 The peak from 2930 to 2860 cm−1 might be due to the presence of lipids in the biofilm30 while the band observed between 2200–2260 cm−1 attributed to (–C![[triple bond, length as m-dash]](https://www.rsc.org/images/entities/char_e002.gif) N) nitrile groups of carbon brush.1 The bands observed at 1700–1500 cm−1 is characteristic of aromatic C
N) nitrile groups of carbon brush.1 The bands observed at 1700–1500 cm−1 is characteristic of aromatic C![[double bond, length as m-dash]](https://www.rsc.org/images/entities/char_e001.gif) C bands suggests existence of protein in the microorganisms (biofilm).30 The bands from 1780–1710 cm−1, 1750–1735 cm−1 and 1690–1630 cm−1 represents C
C bands suggests existence of protein in the microorganisms (biofilm).30 The bands from 1780–1710 cm−1, 1750–1735 cm−1 and 1690–1630 cm−1 represents C![[double bond, length as m-dash]](https://www.rsc.org/images/entities/char_e001.gif) O of carboxylic acid, C
O of carboxylic acid, C![[double bond, length as m-dash]](https://www.rsc.org/images/entities/char_e001.gif) O of ester and C
O of ester and C![[double bond, length as m-dash]](https://www.rsc.org/images/entities/char_e001.gif) O of amide groups respectively. The C
O of amide groups respectively. The C![[double bond, length as m-dash]](https://www.rsc.org/images/entities/char_e001.gif) O of amide groups also attributed to functional groups of membrane fatty acids. The band at 1460 cm−1 is attributed to
O of amide groups also attributed to functional groups of membrane fatty acids. The band at 1460 cm−1 is attributed to ![[double bond, length as m-dash]](https://www.rsc.org/images/entities/char_e001.gif) CH2 functional groups. The band from 1300–900 cm−1 indicates the presence of polysaccharides and nucleic acids.30 The more peaks were obtained after the MFC treatment attributed to the existence of lipids, polysaccharides and proteins on the anode electrode.
CH2 functional groups. The band from 1300–900 cm−1 indicates the presence of polysaccharides and nucleic acids.30 The more peaks were obtained after the MFC treatment attributed to the existence of lipids, polysaccharides and proteins on the anode electrode.
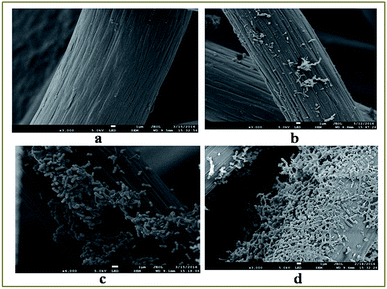 | ||
| Fig. 5 FESEM images on anode carbon brush (a) before operation, on (b) day 3, (c) day 7 and (d) day 11 in the MFC fed with POME as substrate. | ||
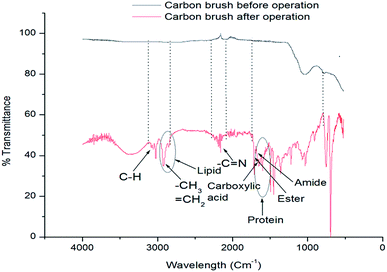 | ||
| Fig. 6 IR spectra of carbon brush anodes before and after MFC operation with wild type K. variicola. | ||
3.5 Cyclic voltammograms
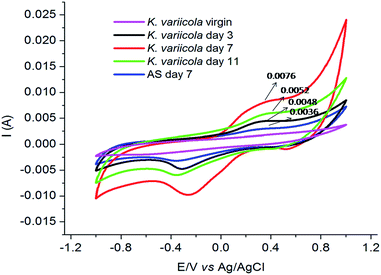
CV analysis has been extensively used to evaluate the bioelectrocatalytic activity of anodic biofilms and to determine the electron transfer mechanisms.31 The CV was conducted before and after inoculation on day 3, 7 and 11 while for AS on day 7 as shown in Fig. 7. Before inoculation (virgin), no redox peak was observed suggesting that there was no redox compound in the anolyte of MFC. After 3 days of operation, small redox peak was observed which revealed that K. variicola excreted redox mediators that were not initially detected indicating that the electrochemical reactions occurred mainly due to the excreted redox mediators. Moreover, reversible CV peak apparently demonstrates the redox transformation of electro chemically active species. Zhang et al., 2008 (ref. 7) observed similar CV peak range in K. pneumoniae L17 microorganism indicates that K. variicola might also have similar redox mechanisms. The electrochemical activity of K. variicola behaved distinctly different during different stages, suggesting that suspension cells were growing or adhering onto the anode to form biofilm in the MFC. However, further study is needed in order to identify the redox compound produced by K. variicola.On day 7, prominent redox peak was noticed which suggested the formation of matured and conductive biofilm on the anode surface and thus enhanced the electron transfer efficiency of K. variicola on the anode of MFC.32 Moreover, because of the minimum diffusion path, the redox compound required less time to reach the electrode thereby facilitated the electron transfer between microbes and anode. The conductive biofilm formation comprising with predominant live cells produced more redox compounds which exhibited maximum performance of MFC. Interestingly, AS also showed redox peaks suggesting that AS also contained electrogenic bacteria which might have produced electron shuttle compounds. However, compared to K. variicola, AS showed less intense peak which indicated its poor catalytic efficiency and thus resulted in lower power production in MFC.
On day 11, CV peak was significantly reduced which might be due to the formation of thick biofilm on anode surface (Fig. 5). Sun et al., 2015 (ref. 33) reported that the thick biofilm formation consists of more number of dead cells than live cells and that would have hindered the electron transfer to the anode surface resulted in lower power generation in MFC. In addition, spatial obstruction caused by the biofilm (Fig. 5), resulted in diffusion limitation between the solution and the anode electrode. These results revealed that the CV data were consistent with the MFC performance.
3.6 Electrochemical impedance spectroscopy
Nyquist plots for the anode configuration on different days are shown in Fig. 8. The measurement of EIS spectra of the anode demonstrates key information of resistance created by electrode and bacterial metabolism. The impedance at the high frequency region is attributed to the ohmic resistance and the diameter of the semicircle represents the polarization resistance (or charge transfer resistance) which is affected by the kinetics of electrode reactions.16 The electrochemical polarization resistance of the working electrode in anode configuration can be qualitatively determined from the magnitude of Nyquist arc whereas the quantitative values can be obtained by an equivalent circuit (EC) fitting of the data.34 The impedance spectra of the anode MFC were analyzed by fitting to the EC: R(Q[RW]) as shown in Fig. 8 where Rohm, Rct, Q and W represent the ohmic resistance, charge transfer resistance, constant phase element (CPE) and mass transfer resistance respectively.35 Constant phase element (CPE) was used rather than capacitor in order to model double layer capacitor; because the surface roughness or a distribution of reactions across the surface can affect overall kinetics.35 The low frequency regions of the Nyquist plots were dominated by the finite Warburg diffusion element.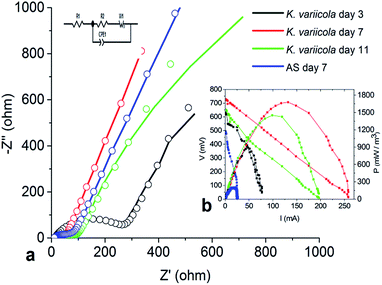 | ||
| Fig. 8 Fitting results of MFC Nyquist plots and polarization curve using K. variicola and AS on different days of operation, (a) fitting results of Nyquist plots, (b) polarization curve (inset). | ||
The ohmic resistance is the resistance produced by electron transfer because of electrolyte and electrode material. It is also manifested as solution resistance.36 The Rohm values on 3rd, 7th and 11th day were obtained as 10.36, 29.31 and 12.36 Ω respectively. The initial increase from 3rd to 7th day might be due to the increase in the microbial growth which eventually increased the solution resistance (ohmic resistance) while from 7th day to 11th day the solution resistance decreased which is due to the accumulation of protons and it helps to increase the conductivity of the solution.
The charge transfer resistance (Rct) values using K. variicola on 3rd, 7th and 11th day were found to be 276.7 Ω, 29.16 Ω and 47.57 Ω, respectively. The higher Rct using K. variicola (276.7 Ω) on 3rd day might be due to the absence of mature biofilm on electrode surface (Fig. 5). However, on 7th day, the Rct was reduced by 89.46% (29.16 Ω) which indicates that the K. variicola formed effective biofilm on the anode thus it decreases the anode activation losses by enhancing the kinetics of the bio-electrochemical reaction.37 While on day 7 the Rct using AS was observed as 49.23 Ω which is significantly higher than using K. variicola (29.16) and thus it revealed the presence of less conductive biofilm. But on day 11, the Rct was increased and reached to 47.57 Ω indicating that the dead cell accumulation in the thick biofilm might have hindered the electron transfer process.
The anode Rct predominantly influences the performance of MFCs. However, the formation of effective biofilm on anode surface also plays an important role in the performance of MFC.37 Therefore, in this study, it can be seen that, although the Rct on day 3 with K. variicola was quite high compared to that of MFC with AS on day 7 (Table 3), the power density showed higher on day 3 with K. variicola which might be due to the presence of some electrogenic bacteria in the AS and that might have reduced the Rct. But, MFC with AS was not able to achieve higher power because of the formation of ineffective biofilm (less conductive) comprising predominantly with methanogenic and other non nonelectrogenic bacteria.5
| Day 3 (K. variicola) | Day 7 (K. variicola) | Day 11 (K. variicola) | Day 7 (AS) | |
|---|---|---|---|---|
| RΩ (Ω) | 10.36 | 29.31 | 12.36 | 14.23 |
| Rct (Ω) | 267.7 | 29.16 | 47.57 | 49.23 |
| Rdif (Ω) | 146.7 | 0.26 | 0.45 | 149.2 |
While the diffusion resistance on 3rd day (146.7 Ω) was higher for K. variicola and that might be due to the electrons from microbes which travel for a long distance using electron shuttles to deliver it on electrode surface. On 7th day (0.262 Ω), the diffusion resistance was drastically reduced because of the presence of active biofilm on the surface (interface) resulting in reduction of diffusion path of redox mediators. However, the diffusion resistance was very less compared to AS (149.2 Ω) suggesting that the AS could have produced nonconductive biofilm thereby increased the diffusion resistance. On 11th day (0.450 Ω), the diffusion resistance increased two times which might be due to the formation of multilayer biofilm (Fig. 5). The EIS results are consistent with the CV and polarization data.
4. Conclusions
In this study the wild type K. variicola showed the significant power production of about 1.7 W m−3 in air cathode MFC using POME as substrate which is about eight times higher power than AS. The effective biofilm formation capability of K. variicola significantly influenced the electron transfer process in the MFC. Besides that, the reversible CV peak confirmed that K. variicola produced electron shuttle compound which enhanced the electron transfer efficiency. Anode charge transfer resistance using K. variicola is comparatively lower than anaerobic sludge which showed the presence of efficient biofilm formation. The COD removal efficiency using K. variicola (43%) proves that this microorganism can able to utilize POME efficiently. The MFC with AS showed higher COD removal (74%) with lower performance indicates that the considerable proportion of the substrates were being consumed without electrogenesis. The results of the study suggest that K. variicola is an efficient microorganism to be used as inoculum in MFC. Further developments can be made by mixing different kinds of microorganisms with K. variicola may improve the power generation of MFC.Acknowledgements
The authors are grateful for financial support from the University Malaysia Pahang, Malaysia for funding (RDU 140322 and GRS 150371) this project.Notes and references
- E. Baranitharan, M. R. Khan, A. Yousuf, W. F. A. Teo, G. Y. A. Tan and C. K. Cheng, Fuel, 2015, 143, 72–79 CrossRef CAS
.
- D. Pant, A. Singh, G. Van Bogaert, S. I. Olsen, P. S. Nigam, L. Diels and K. Vanbroekhoven, RSC Adv., 2012, 2, 1248–1263 RSC
.
- M. H. M. Nor, M. F. M. Mubarak, H. S. A. Elmi, N. Ibrahim, M. F. A. Wahab and Z. Ibrahim, Bioresour. Technol., 2015, 190, 458–465 CrossRef CAS PubMed
.
- A. S. Mathuriya and V. Sharma, J. Biochem. Technol., 2010, 2, 133–137 Search PubMed
.
- S. Freguia, K. Rabaey, Z. Yuan and J. Keller, Environ. Sci. Technol., 2007, 41, 2915–2921 CrossRef CAS PubMed
.
- K.-J. Chae, M.-J. Choi, K.-Y. Kim, F. Ajayi, W. Park, C.-W. Kim and I. S. Kim, Bioresour. Technol., 2010, 101, 5350–5357 CrossRef CAS PubMed
.
- L. Zhang, S. Zhou, L. Zhuang, W. Li, J. Zhang, N. Lu and L. Deng, Electrochem. Commun., 2008, 10, 1641–1643 CrossRef CAS
.
- U. Garza-Ramos, J. Silva-Sánchez, E. Martínez-Romero, P. Tinoco, M. Pina-Gonzales, H. Barrios, J. Martínez-Barnetche, R. E. Gómez-Barreto and J. Tellez-Sosa, BMC Microbiol., 2015, 15, 64 CrossRef PubMed
.
- M. Taha, K. K. Kadali, A.-H. Khalid, A. T. Smith, A. S. Ball and E. M. Adetutu, Ann. Microbiol., 2015, 1–12 Search PubMed
.
- L. Lin, C. Wei, M. Chen, H. Wang, Y. Li, Y. Li, L. Yang and Q. An, Order, 2015, 14, 15 Search PubMed
.
- S. J. Santosa, Clean: Soil, Air, Water, 2008, 36, 453–465 CrossRef CAS
.
- M. Kimura, J. Mol. Evol., 1980, 16, 111–120 CrossRef CAS PubMed
.
- C. W. Woon, J. H. Lim, H. R. Ong and M. R. Khan, International Journal of Material Science Innovations, 2015, 3, 33–41 Search PubMed
.
- J. L. Varanasi, A. K. Nayak, Y. Sohn, D. Pradhan and D. Das, Electrochim. Acta, 2016, 199, 154–163 CrossRef CAS
.
- D. Baron, E. LaBelle, D. Coursolle, J. A. Gralnick and D. R. Bond, J. Biol. Chem., 2009, 284, 28865–28873 CrossRef CAS PubMed
.
- Z. He and F. Mansfeld, Energy Environ. Sci., 2009, 2, 215–219 CAS
.
- T. Suzuki, C. Nishikawa, K. Seta, T. Shigeno and T. Nakajima-Kambe, New Biotechnol., 2014, 31, 246–253 CrossRef CAS PubMed
.
- Q. Ma, Y. Qu, X. Zhang, Z. Liu, H. Li, Z. Zhang, J. Wang, W. Shen and J. Zhou, Sci. Rep., 2015, 5, 436–443 Search PubMed
.
- V. H. Edwards, Biotechnol. Bioeng., 1970, 12, 679–712 CrossRef CAS PubMed
.
- L. Deng, F. Li, S. Zhou, D. Huang and J. Ni, Chin. Sci. Bull., 2010, 55, 99–104 CrossRef CAS
.
- S. V. Mohan, S. V. Raghavulu and P. Sarma, Biosens. Bioelectron., 2008, 24, 41–47 CrossRef PubMed
.
- U. Karra, S. S. Manickam, J. R. McCutcheon, N. Patel and B. Li, Int. J. Hydrogen Energy, 2013, 38, 1588–1597 CrossRef CAS
.
- S. Velasquez-Orta, I. Head, T. Curtis and K. Scott, Bioresour. Technol., 2011, 102, 5105–5112 CrossRef CAS PubMed
.
- R. K. Goud, P. S. Babu and S. V. Mohan, Int. J. Hydrogen Energy, 2011, 36, 6210–6218 CrossRef CAS
.
- D. Majumder, J. P. Maity, M.-J. Tseng, V. R. Nimje, H.-R. Chen, C.-C. Chen, Y.-F. Chang, T.-C. Yang and C.-Y. Chen, Int. J. Mol. Sci., 2014, 15, 16772–16786 CrossRef PubMed
.
- L. Huang and B. E. Logan, Appl. Microbiol. Biotechnol., 2008, 80, 349–355 CrossRef CAS PubMed
.
- E. Marsili, J. B. Rollefson, D. B. Baron, R. M. Hozalski and D. R. Bond, Appl. Environ. Microbiol., 2008, 74, 7329–7337 CrossRef CAS PubMed
.
- M. A. Islam, C. W. Woon, B. Ethiraj, C. K. Cheng, A. Yousuf and M. M. R. Khan, Energy Fuels, 2016 DOI:10.1021/acs.energyfuels.6b02294
.
- P. Nanda, K. Rao and P. Nayak, J. Appl. Polym. Sci., 2007, 103, 3134 CrossRef CAS
.
- Y. Jiao, G. D. Cody, A. K. Harding, P. Wilmes, M. Schrenk, K. E. Wheeler, J. F. Banfield and M. P. Thelen, Appl. Environ. Microbiol., 2010, 76, 2916–2922 CrossRef CAS PubMed
.
- N. Samsudeen, T. Radhakrishnan and M. Matheswaran, Bioresour. Technol., 2015, 195, 242–247 CrossRef CAS PubMed
.
- O. Tkach, L. Liu and A. Wang, J. Clean Energy Technol., 2015, 4, 36 CrossRef
.
- D. Sun, S. Cheng, A. Wang, F. Li, B. E. Logan and K. Cen, Environ. Sci. Technol., 2015, 49, 5227–5235 CrossRef CAS PubMed
.
- E. Baranitharan, M. R. Khan, D. Prasad, W. F. A. Teo, G. Y. A. Tan and R. Jose, Bioprocess Biosyst. Eng., 2015, 38, 15–24 CrossRef CAS PubMed
.
- Z. He, N. Wagner, S. D. Minteer and L. T. Angenent, Environ. Sci. Technol., 2006, 40, 5212–5217 CrossRef CAS PubMed
.
- Y. Du, Y. Feng, Q. Teng and H. Li, Int. J. Electrochem. Sci., 2015, 10, 1316–1325 Search PubMed
.
- R. P. Ramasamy, Z. Ren, M. M. Mench and J. M. Regan, Biotechnol. Bioeng., 2008, 101, 101–108 CrossRef CAS PubMed
.
| This journal is © The Royal Society of Chemistry 2017 |


