 Open Access Article
Creative Commons Attribution 3.0 Unported Licence
The role of Yb3+ concentrations on Er3+ doped SrLaMgTaO6 double perovskite phosphors
Do Rim Kima,
Sung Wook Parka,
Byung Kee Moona,
Sung Heum Parka,
Jung Hyun Jeong*a,
Haeyoung Choib and
Jung Hwan Kim*b
aDepartment of Physics, Pukyong National University, Busan 608-737, Republic of Korea. E-mail: jhjeong@pknu.ac.kr
bDepartment of Physics Dongeui University, Busan 614-714, Republic of Korea. E-mail: kimjh@deu.ac.kr; Fax: +82-51-629-5549; Tel: +82-51-629-5564
First published on 5th January 2017
Abstract
Er3+, Yb3+ co-doped SrLaMgTaO6 phosphors have been synthesized by a solid state reaction method. Under a 975 nm excitation, the SrLaMgTaO6:Er3+/Yb3+ phosphors exhibited strong green luminescence centered at 525 nm and 545 nm and relatively weak red anti-stokes luminescence centered at 660 nm. Herein, we have established the upconversion mechanism based on the down conversion and upconversion photoluminescence (UCPL) properties. The sensitized energy upconversion [s-ETU2: Yb3+ (2F5/2) + Er3+ (4I11/2) → Yb3+ (2F7/2) + Er3+ (4F7/2)] is a main route of green UCPL, and the energy back transfer [EBT: Er3+ (4S3/2) + Yb3+ (2F7/2) → Er3+ (4I13/2) + Yb3+ (2F5/2)] is a main route of red UCPL, which reduces the green UCPL to a certain degree. The reduced green and red UCPL of the sample with a high concentration of Yb3+ is mainly attributed to the concentration quenching of the Yb3+ ion.
1. Introduction
It is expected that the luminous behavior of lanthanide ions will play a significant role for luminescent materials in specific applications, while the structure of the host matrix imposes great effects on the behavior of the lanthanide phosphors.1,2 Lanthanide doped upconversion phosphors have received growing attention owing to their wide range of potential applications in many fields, including luminescence display panels, biological imaging, solid-state lasers, solar cells, and temperature sensors.3–8 Among the lanthanide ions, Er3+ ion is a promising competitor for UC luminescence centers due to its abundant energy levels with a long lifetime.9 Moreover, Yb3+ ion is usually employed as the sensitizer for Er3+ ion due to its large absorption cross section around 975 nm wavelength and the advantage of an efficient energy transfer process between Yb3+ and Er3+ ions. However, host materials are also important for obtaining efficient luminescent properties by the upconversion process. In order to obtain the efficient UC phosphors, it is generally believed that it requires lower phonon energies of the host materials, which leads to minimizing non-radiative losses. Additionally, the upconversion photoluminescence (UCPL) properties depend on many factors of the host materials such as the symmetry, lattice parameters, doping concentration of the activator and sensitizer ions.10,11 However, the knowledge related to the influence of crystal structure on the UCPL is quite limited.By virtue of quite interesting structural, electronic as well as magnetic properties of the double perovskite,12 the AA′BB′O6 structured phosphors have been well established.13–15 Since the energy transfer mechanism between donor and acceptor species has been treated within the framework of the Förster and Dexter approaches,16,17 it is important to know the symmetry site of the donor and acceptor in the phosphors. In a typical double perovskite structure, both B and B′ are coordinated by orderly arranged six oxygen atoms. A (or A′) site has various coordination numbers from eight to twelve according to the distortion degree of the crystal structure.
In the several mechanisms for the upconversion processes, the main UC processes are ground state absorption followed by excited state absorption (GSA/ESA), energy transfer UC between same kinds of ions (GSA/ETU), and energy transfer UC between activator and sensitizer ion (GSA/s-ETU). The rates of energy transfer (ET) between donor and acceptor are strongly dependent on the crystal structure. In the SrLaMgTaO6 crystal, two kinds of B ions are ordered and formed a three-dimensional network of alternating MgO6 and TaO6 octahedra. Since the tolerance factor (t) of complex perovskite SrLaMgTaO6 are related to the ionic radii of Mg and Ta cations, t = 0.952 < 1,18 both of the MgO6 and the TaO6 octahedral tilting distortions exist in this crystal. To the best of our knowledge, there are no reports available on the synthesis and upconversion properties of the SrLaMgTaO6 except our recent work.19
The present paper deals with the influence of Yb3+ concentration on the luminescence properties in SrLaMgTaO6 phosphors with fixed Er3+ concentration to 7 mol% and inducing Yb3+ concentration from 0% to 10.5 mol%. The crystal structure, optical properties and electronic structure of SrLaMgTaO6 were investigated experimentally and theoretically. The upconversion luminescence behaviors of the phosphor have been discussed in detail with luminescence mechanisms.
2. Experimental and calculation methods
2.1 Sample preparation
Crystalline powder samples of SrLaMgTaO6:Er3+ (7%) codoped with Yb3+ (0%, 3.5%, 7%, 10.5%) were prepared by a solid state reaction method. The SrCO3 (99.994%), La2O3 (99.99%), (MgCO3)4Mg(OH)2·5H2O (99.99%), Ta2O5 (99.99%), Er2O3 (99.9%) and Yb2O3 (99.99%) were used as starting materials. All the reagents were purchased from Sigma-Aldrich. The required amounts were weighed according to the stoichiometric ratio and ground to a fine powder using agate mortar and pestle. The mixture of starting materials was preheated at 600 °C for 2 h and then calcined at 900 °C for another 2 h and slowly cooled down naturally to room temperature. Finally, these materials were annealed at 1400 °C at a rate of 5 °C min−1 and kept for 12 h before cooling down to room temperature.2.2 Characterization and optical measurements
The phase identification of the prepared phosphors was characterized by powder X-ray diffraction (XRD) analysis on a Philips X'Pert MPD diffractometer (Philips, Netherlands) using CuKα radiation (λ = 1.546 Å). The UCPL emission spectra were recorded with a fluorescence spectrophotometer (Acton SpectraPro 750-Triplet Grating Monochromator) from CCD detector (Princeton EEV 10241024 and PI-Max 133 Controller). All the measurements except photoluminescence (PL) spectra of SrLaMgTaO6 were performed at room temperature. The sample was placed in a liquid helium flow cryostat for the measurements of PL spectra of SrLaMgTaO6 at 20–300 K.3. Results and discussion
3.1 XRD patterns and crystal structure
The ionic radii of Er3+ (R = 1.01 Å, CN = 12) and Yb3+ (R = 1.01 Å, CN = 12) are slightly smaller than Sr2+ (R = 1.18 Å, CN = 12) and La3+ (R = 1.17 Å, CN = 12). Therefore, Er3+/Yb3+ can be easily substituted into the Sr2+ and La3+ site, while the Mg2+ (0.72 Å, CN = 6) and Ta5+ (0.64 Å, CN = 6) sites are too small to occupy Er3+/Yb3+ ions. The dopant ions were expected to occupy the site of La3+ ion due to its similar oxidation state and larger ionic radius in the SrLaMgTaO6:Er3+/Yb3+, thus, the nominal formula of phosphors is written as SrLa(1−x−y)MgTaO6:xEr3+,yYb3+. The structure of synthesized samples was examined by the measuring the XRD patterns, and all the samples exhibited monoclinic structure with space group P21/n (Fig. 1). Within the synthesized dopant limits, all the diffraction peaks are well matched with those in the standard card NIMS (National Institute for Materials Science) without any other characteristic peaks related to raw materials or impurities.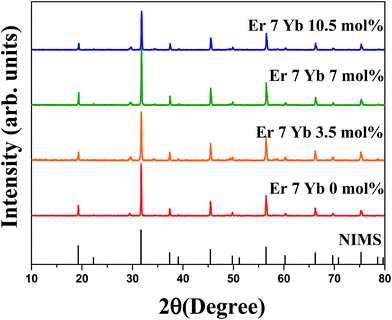 | ||
| Fig. 1 X-ray diffraction patterns of SrLa(0.93−x)MgTaO6:Er3+/xYb3+ phosphors with a fixed Er3+ ions (7 mol%) and different concentrations of Yb3+ ions with the reference data of NIMS. | ||
3.2 Photoluminescence (PL) of SrLaMgTaO6
The sample of SrLaMgTaO6 was placed in a liquid helium flow cryostat for the measurements of PL spectra at 20–300 K. Fig. 2 shows the PL spectra of SrLaMgTaO6 under an excitation wavelength of 355 nm. The broad and strong emission bands centered at 691 nm and 704 nm were observed at low temperature, which might be attributed to the existence of TaO6 emission from SrLaMgTaO6 host crystal. As increasing of the sample temperature, the total PL intensity was slightly reduced, and the PL intensity of the band centered 691 nm was highly reduced compared to that of the band centered 704 nm. To our knowledge, the strong red emission at room temperature has not been reported on tantalum based host lattices so far. However, the TaO6 emission from SrLaMgTaO6 host lattice was observed for the first time. It has been reported that perovskite-like tantalate powders have an intrinsic emission from TaO6 group ranging from 340 nm to 490 nm at low temperature, and the emission is quenched by improving temperature. Some reports about PL emitted from Ta–O bond and Mo–O bond are listed in Table 1.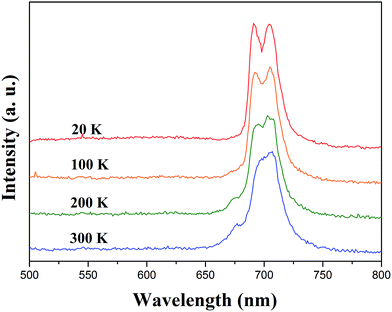 | ||
| Fig. 2 Photoluminescence spectra of SrLaMgTaO6 at different temperature under an excitation wavelength of 355 nm. | ||
3.3 Upconversion photoluminescence of Er3+ in SrLaMgTaO6
The UCPL spectra of SrLaMgTaO6:xEr3+ with different concentration of Er3+ ions under a 975 nm excitation are shown in Fig. 3. Since the UCPL properties depend on the concentrations of the dopant ions of the activator, it is important to know the relative UCPL intensity emitted by a single Er3+ ion as function of Er3+ concentration. In order to compare the green intensities of SrLa(1−x)MgTaO6:xEr3+ (x = 0.01, 0.03, 0.05, 0.07, 0.1, 0.12), same experimental condition was maintained. The PL intensity per mol is the intensity of green UCL emitted from x mol% sample divided by x. We obtained the value for 5 times, and the average values were displayed in inset of Fig. 2. Since the values nearly remained constant up to 7 mol% and then decreased rapidly above 10 mol% of Er3+ concentration, we fixed the Er3+ concentration to 7 mol%. The decrement may be attributed to the concentration quenching effect.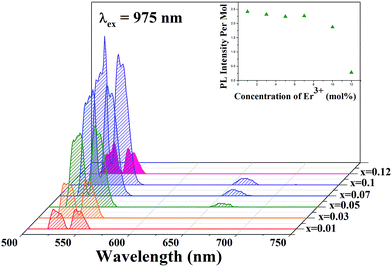 | ||
| Fig. 3 The UCPL spectra of SrLaMgTaO6:xEr3+ with different concentration of Er3+ under a 975 nm excitation. The inset shows the UCPL intensity variation per mol as function of Er3+ concentration. | ||
3.4 Photoluminescence of SrLaMgTaO6:Er3+/Yb3+
Fig. 4(a) shows the photoluminescence (PL) spectra of SrLaMgTaO6:Er3+/Yb3+ under an excitation wavelength of 355 nm. Two typical green emission bands centered at 525 and 545 nm are assigned to the 2H11/2 → 4I15/2, and 4S3/2 → 4I15/2 transitions, respectively. A relatively weak red emission band centered at 660 nm assigned to 4F9/2 → 4I15/2 transition. The strong emission band centered at 704 nm from Er3+ single doped SrLaMgTaO6 host crystal was observed, which was due to the TaO6 emission. By incorporation of Yb3+ ion, dramatically weaken PL seems to be due to the energy transfer from the TaO6 band to 2F7/2 state of Yb3+ which has high absorption cross-section.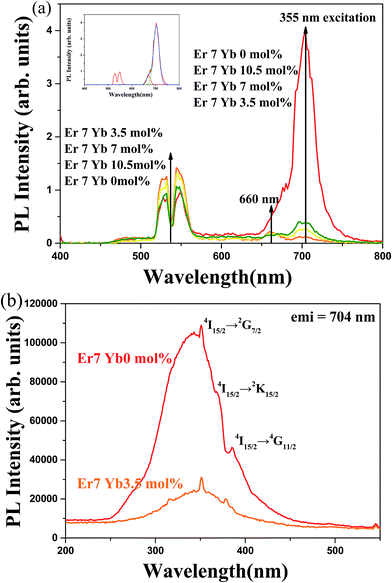 | ||
| Fig. 4 The excitation and emission spectra of SrLaMgTaO6:Er3+/Yb3+ phosphor with different concentration of Yb3+: (a) DCPL spectra under a 355 nm excitation, (b) PLE spectra monitored at 704 nm. | ||
Fig. 4(b) shows the PLE spectra of SrLaMgTaO6:Er3+/Yb3+ monitored at 704 nm host emission. The wide band centered at 348 nm seems to be emitted from exciton of the crystal related to Ta–O charge transfer band. The excitation energy of SrLaMgTaO6 is lower than those of other tantalate as can be seen in Table 1. It is well known that the energy of charge transfer transition from ligand to central metal ion is dependent on the coordination number.24 The orbital mixing of Ta5+ and O2− of TaO6 octahedron is larger than that of TaO4 tetrahedron. Since the required energy decreases to transfer an electron from O2− to Ta5+ ion, the CT band will move to lower energy region. And three sharp peaks at 351 nm, 368 nm and 385 nm comes from 4I15/2 → 2G7/2, 4I15/2 →2K15/2, and 4I15/2 →4G11/2 of the Er3+ ion, respectively. The Stokes shift of the SrLaMgTaO6 crystal is 14![[thin space (1/6-em)]](https://www.rsc.org/images/entities/char_2009.gif) 500 cm−1, which is slightly higher than those of other perovskite-like tantalate. Since the bonding structure of Ta–O in the imperfection crystal is complicated, further specialized research should be performed to obtain exact bonding structure.
500 cm−1, which is slightly higher than those of other perovskite-like tantalate. Since the bonding structure of Ta–O in the imperfection crystal is complicated, further specialized research should be performed to obtain exact bonding structure.
3.5 Upconversion photoluminescence of Er3+/Yb3+ in SrLaMgTaO6
Fig. 5 shows the UCPL spectra of SrLaMgTaO6:Er3+/Yb3+ under an excitation wavelength of 975 nm. Two typical green UCPL bands and a relatively weak red UCPL band are observed, which are similar to those of down conversion luminescence (DCPL) bands shown in Fig. 4(a). However, the intensity of green DCPL is nearly independent on the concentration of Yb3+, the overall UCPL intensities are greatly enhanced with introducing sensitizer Yb3+ ion owing to the efficient energy transfer from Yb3+ to Er3+, which is also known as sensitized energy transfer upconversion (s-ETU). The intensity of UCPL has been continuously enhanced with increasing the Yb3+ ion and reaches a maximum value at a concentration of 7 mol%. As the concentration of Yb3+ has further increased, the UCPL intensity had reduced. Both of the concentration quenching rate among Yb3+ ions and the rate of the energy back transfer (EBT) from Er3+ to Yb3+ [Er3+ (4S3/2) + Yb3+ (2F7/2) → Er3+ (4I13/2) + Yb3+ (2F5/2)] become active with further doping of Yb3+, which seems to be the main reasons of the reducing UCPL intensity.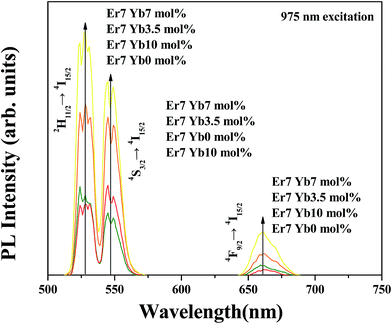 | ||
| Fig. 5 Upconversion photoluminescence spectra of SrLaMgTaO6:Er3+/Yb3+ phosphors with different concentration of Yb3+:UCPL spectra under a 975 nm excitation. | ||
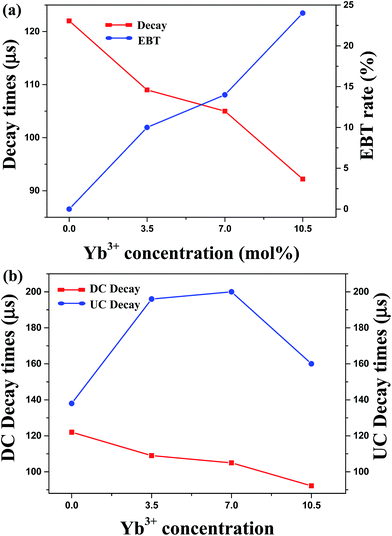
Fig. 6 shows the temporal behaviours of the green emission of the 4S3/2 level under a 355 nm excitation with pulse duration of 6 ns. The decay times of the 4S3/2 level become shorter from 122 to 92 μs as the Yb3+ concentrations increases from 0 to 10.5 mol%. It is attributed to the energy transfer from 4S3/2 state of Er3+ to Yb3+ ion. Since Yb3+ ion has only two levels, the energy transfer from Er3+ to Yb3+, so called EBT [EBT: Er3+ (4S3/2) + Yb3+ (2F7/2) → Er3+ (4I13/2) + Yb3+ (2F5/2)] can be possible. The efficiency of EBT defined as the ratio of EBT rate to total emission rate of 4S3/2 state was calculated by the following equation:  where, τ(x) is the decay time of the 4S3/2 level in SrLaMgTaO6 with x mol% concentration of Yb3+ and 7 mol% of Er3+. The efficiency of EBT that has calculated from decay times is displayed in Fig. 7(a). Since the EBT plays a role to reduce the green UCL intensity, it is important to know EBT efficiency. It has increased linearly from 0 to 24% as the Yb3+ concentration increases from 0 to 10.5 mol%.
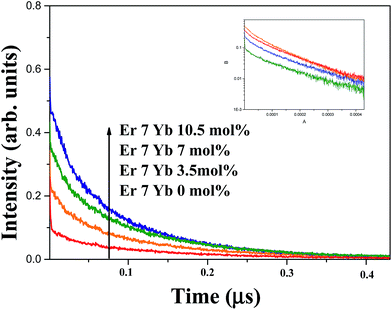 | ||
| Fig. 6 Decay curves of SrLaMgTaO6:Er3+/Yb3+ phosphor monitored at 545 nm under (a) 355 nm excitation and (b) 975 nm excitation. | ||
If the UCPL green emission is only due to the ESA process, the decay times of the 4S3/2 under a 975 nm excitation will be similar with that of 355 nm excitation. However, by incorporation of sensitizer such as Yb3+, the sensitized energy transfer upconversion (s-ETU) process that has additionally participated in the UCPL process makes the decay curves delayed. Two different variations of the decay time as function of the Yb3+ concentration are shown in Fig. 7(b). The pulsed light of a 975 nm was generated from the optical parametric oscillator pumped from the 3rd harmonics of Nd:YAG laser with pulse duration of 6 ns. Small differences of decay time between UCPL and DCPL at x = 0 is attributed to the ETU process which is more active in the highly Er3+ dopant sample. The concentration of Er3+ of all samples is fixed to 7.0 mol%. By addition of sensitizer Yb3+ ion, the DCPL decay times has reduced due to the EBT, however, the UCPL decay times had increased due to the s-ETU from Yb3+ to Er3+. As seen in Fig. 5, increase of the UCPL intensities up to 7 mol% of Yb3+ concentration are attributed to the enhanced s-ETU. At highly dopant sample, the excited state of Yb3+ (2F5/2) will be quenched by the highly enhanced energy migration among Yb3+, which makes the reduction of s-ETU rate. The rate of s-ETU which is dependent on the concentration of sensitizer is limited by the concentration quenching of sensitizer. In short, lower value of the UCPL decay time at x = 10.5 sample are resulted from the concentration quenching of Yb3+ and the EBT from Er3+ to Yb3+.
The possible populating process of the Er3+ and Yb3+ for the UCPL under the excitation of 975 nm are shown in Fig. 8. By absorbing NIR photons, GSA of Yb3+ ion and Er3+ ion takes place as following: 2F7/2 + a photon (975 nm) → 2F5/2 in Yb3+ and 4I15/2 + a photon (975 nm) →4I11/2 in Er3+. Most of incident energy is absorbed by the Yb3+ ions due to the larger absorption cross section around 975 nm wavelength comparing to that of Er3+. Therefore, the population at excited level 4I11/2 mainly occurs through energy transfer from Yb3+ to Er3+ [s-ET: Yb3+ (2F5/2) + Er3+ (4I15/2) → Yb3+ (2F7/2) + Er3+ (4I11/2)]. The two UCPL green emission bands around 525 and 545 nm are radiated from 2H11/2 and 4S3/2 → 4I15/2 transitions, respectively. The green emission levels 2H11/2 and 4S3/2 are populated by multiphonon relaxation from upper level 4F7/2. The excited state of 4F7/2 could be populated through the s-ETU2 process [s-ETU2: Yb3+ (2F5/2) + Er3+ (4I11/2) → Yb3+ (2F7/2) + Er3+ (4F7/2)] or excited state absorption [ESA1: Er3+ (4I11/2) + a photon (975 nm) → Er3+ (4F7/2)]. The UCPL red emitting state 4F9/2 can be populated through three possible processes. The first is multiphonon relaxation from the 4S3/2 level to 4F9/2. The second is due to generation of the 4I13/2 state that can be populated through the cross relaxation process [CR: Er3+ (4I15/2) + Er3+ (4S3/2) → Er3+ (4I9/2) + Er3+ (4I13/2)]. The red 4F9/2 state is populated from 4I13/2 state through the s-ETU1 process [Yb3+ (2F5/2) + Er3+ (4I13/2) → Yb3+ (2F7/2) + Er3+ (4F9/2)] or ESA2 process [(4I13/2) + a photon (975 nm) → Er3+ (4F9/2)]. Another possible mechanism to populate 4I13/2 level is an EBT process [EBT: Er3+ (4S3/2) + Yb3+ (2F7/2) → Er3+ (4I13/2) + Yb3+ (2F5/2)]. As can be seen in Fig. 5, the red UCPL intensity of the sample doped with 7 mol% Er3+ is very smaller than that of co-doped with 7 mol% Er3+ and 7 mol% Yb3+. Considering the multiphonon relaxation and the CR processes are independent of the concentration of Yb3+ ion, the UCPL red emission is mainly attributed to the EBT process. As increasing Yb3+ concentration, the enhanced rate of EBT results in higher red UCPL emission. As further doping of Yb3+ up to 7 mol%, the population of 2F5/2 state that is an initial state of s-ETU2 process will be quickly reduced owing to the concentration quenching of Yb3+. Since the initial state of EBT, Er3+ (4S3/2), is easily populated via a multiphonon relaxation from the final state of s-ETU2, Er3+ (4F7/2), the reduction of s-ETU2 process is followed by reduction of EBT. Consequently, the reduced green and red UCPL of the sample with 10.5 mol% Yb3+ is chiefly attributed to the concentration quenching of Yb3+.
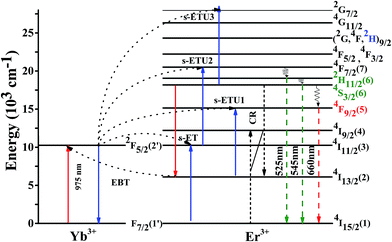 | ||
| Fig. 8 The schematic energy level diagrams of Er3+ and Yb3+ ions in the SrLaMgTaO6:Er3+/Yb3+ and the possible mechanisms of the upconversion. | ||
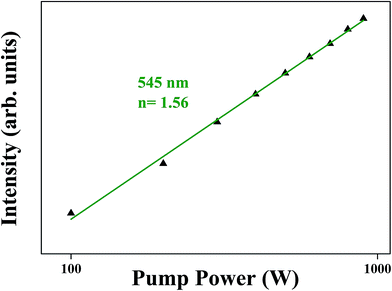
The logarithmic scale dependence of the UC emission intensities of 4S3/2 → 4I15/2 (green) transition on the working pump power over the range of 100 to 1000 W in the SrLaMgTaO6:Er3+/Yb3+ phosphor is shown in Fig. 9. The number of photons required to populate the upper level under unsaturated condition can be described by relation: Iup = (Ppump). Where Iup is the UCPL emission intensity, Ppump is the power of the pump laser and n is the number of pumped photons required in the mechanism which is indicated by the slope. The value of n obtained in SrLaMgTaO6:Er3+/Yb3+ phosphors with the monoclinic structure were 1.56 for green UCL. The slope value of 4S3/2 level of Er3+ indicate that the two photon processes are mainly responsible for green emission.
4. Conclusions
SrLaMgTaO6:0.07Er3+/xYb3+ (x = 0, 0.035, 0.07, 0.105) phosphors were prepared by a solid reaction method. Under a 355 nm excitation, strong red PL was observed at room temperature, which seems to be emitted from Ta–O bond in SrLaMgTaO6 powder. Under 975 nm laser diode excitation, both UCPL green and red emissions are enhanced by incorporation of Yb3+. As the concentration of Yb3+ increases, s-ETU [s-ETU2: Yb3+ (2F5/2) + Er3+ (4I11/2) → Yb3+ (2F7/2) + Er3+ (4F7/2)] process and EBT from Er3+ to Yb3+ [EBT: Er3+ (4S3/2) + Yb3+ (2F7/2) → Er3+ (4I13/2) + Yb3+ (2F5/2)] become more active. The s-ETU2 is a main route of green UCPL, and the EBT process is a main route of red UCPL and can reduce the green UCPL to a certain degree. As further doping of Yb3+ up to 7 mol%, the population of 2F5/2 state that is an initial state of s-ETU2 process was quickly reduced owing to the concentration quenching of Yb3+. Consequently, the reduced green and red UCPL of the sample at 10.5 mol% of Yb3+ is chiefly attributed to the concentration quenching of Yb3+.Acknowledgements
This research was supported by the Basic Science Research Program through the National Research Foundation of Korea (NRF) funded by the Ministry of Science, ICT and Future Planning (No. 2015060315). The Er3+ doped SrLaMgTaO6 phosphors are supplied by the Display and Lighting Phosphor Bank at Pukyong National University.References
- B. Zhou, B. Shi, D. Jin and X. Liu, Controlling upconversion nanocrystals for emerging applications, Nat. Nanotechnol., 2015, 10, 924–936, DOI:10.1038/nnano.2015.251.
- J.-M. Li, X.-L. Zeng, Y.-H. Dong and Z.-A. Xu, White-light emission and weak antiferromagnetism from cubic rare-earth oxide Eu2O3 electrospun nanostructures, CrystEngComm, 2013, 2372–2377, 10.1039/c3ce26770a.
- Q. Zuo, L. Luo and Y. Yao, The electrical, upconversion emission, and temperature sensing properties of Er3+/Yb3+-codoped Ba(Zr0.2Ti0.8)O3-(Ba0.7Ca0.3)TiO3 ferroelectric ceramics, J. Alloys Compd., 2015, 632, 711–716, DOI:10.1016/j.jallcom.2015.01.296.
- F. Huang, Y. Gao, J. Zhou, J. Xu and Y. Wang, Yb3+/Er3+ co-doped CaMoO4: a promising green upconversion phosphor for optical temperature sensing, J. Alloys Compd., 2015, 639, 325–329, DOI:10.1016/j.jallcom.2015.02.228.
- L. Pihlgren, T. Laihinen, L. C. V Rodrigues, S. Carlson, K. O. Eskola, A. Kotlov, M. Lastusaari, T. Soukka, H. F. Brito and J. Hölsä, On the mechanism of persistent up-conversion luminescence in the ZrO2:Yb3+,Er3+ nanomaterials, Opt. Mater., 2014, 36, 1698–1704, DOI:10.1016/j.optmat.2014.01.027.
- F. Auzel, Upconversion and Anti-Stokes Processes with f and d Ions in Solids, Chem. Rev., 2004, 104, 139–173, DOI:10.1021/cr020357g.
- V. K. Rai, Temperature sensors and optical sensors, Appl. Phys. B: Lasers Opt., 2007, 88, 297–303, DOI:10.1007/s00340-007-2717-4.
- J. Holsä, Persistent Luminescence Beats the Afterglow: 400 Years of Persistent Luminescence, Electrochem. Soc. Interface, 2009, 4, 42–45 Search PubMed , http://www.electrochem.org/dl/interface/wtr/wtr09/wtr09_p042-045.pdf.
- C. Mi, J. Wu, Y. Yang, B. Han and J. Wei, Efficient upconversion luminescence from Ba5Gd8Zn4O21:Yb3+, Er3+ based on a demonstrated cross-relaxation process, Sci. Rep., 2016, 6, 22545, DOI:10.1038/srep22545.
- B. Chen, B. Dong, J. Wang, S. Zhang, L. Xu, W. Yu and H. Song, Amphiphilic silane modified NaYF4:Yb,Er loaded with Eu(TTA)3(TPPO)2 nanoparticles and their multi-functions: dual mode temperature sensing and cell imaging, Nanoscale, 2013, 5, 8541–8549, 10.1039/c3nr02670a.
- S. Song, Y. Kuang, J. Liu, Q. Yang, L. Luo and X. Sun, Separation and phase transition investigation of Yb3+/Er3+ co-doped NaYF4 nanoparticles, Dalton Trans., 2013, 42, 13315–13318, 10.1039/c3dt51652k.
- K. Goodenough, J. B. Longo and J. M. Hellwege, Crystallographic and Magnetic Properties of Perovskite and Perovskite-Related Compounds, New Series, Springer-Verlag, Berlin, 1970 Search PubMed.
- M. T. Anderson, K. B. Greenwood, G. A. Taylor and K. R. Poeppelmeier, B-cation arrangements in double perovskites, Prog. Solid State Chem., 1993, 22, 197–233, DOI:10.1016/0079-6786(93)90004-B.
- W. T. Fu, Y. S. Au, S. Akerboom and D. J. W. IJdo, Crystal structures and chemistry of double perovskites Ba2M(II)M′(VI)O6 (M = Ca, Sr, M′ = Te, W, U), J. Solid State Chem., 2008, 181, 2523–2529, DOI:10.1016/j.jssc.2008.06.024.
- S. Ye, Y. Li, D. Yu, Z. Yang and Q. Zhang, Structural effects on Stokes and anti-Stokes luminescence of double-perovskite (Ba,Sr)2CaMoO6: Yb3,Eu 3, J. Appl. Phys., 2011, 110, 013517, DOI:10.1063/1.3602991.
- D. L. Dexter, A Theory of Sensitized Luminescence in Solids, J. Chem. Phys., 1953, 21, 836, DOI:10.1063/1.1699044.
- T. Förster, Expermentelle und theoretische Untersuchung des zwischengmolekularen übergangs von elektronenanregungsenergie, Naturforscher, 1949, 4a, 321–327, DOI:10.1515/zna-1949-0501.
- Y. Guo, B. Kee Moon, S. Heum Park, J. Hyun Jeong, J. Hwan Kim, K. Jang and R. Yu, A red-emitting perovskite-type SrLa(1−x)MgTaO6:xEu3+ for white LED application, J. Lumin., 2015, 167, 381–385, DOI:10.1016/j.jlumin.2015.06.054.
- D. R. Kim, S. W. Park, J. H. Jeong, H. Choi and J. H. Kim, Upconversion luminescence properties of Er3+ in SrLaMgTaO6 double perovskite phosphor, Mater. Res. Bull., 2017, 85, 216–221, DOI:10.1016/j.materresbull.2016.09.017.
- V. Trepakov, A. Skvortsov, N. Poletaev, Z. Potůček, D. Nuzhnyy, L. Jastrabik and A. Dejneka, An optical and dielectric spectroscopy study of Er3+-doped KTaO3, Phys. Status Solidi, 2011, 248, 2908–2915, DOI:10.1002/pssb.201147080.
- C. C. Hu, C. C. Tsai and H. Teng, Structure characterization and tuning of perovskite-like NaTaO3 for applications in photoluminescence and photocatalysis, J. Am. Ceram. Soc., 2009, 92, 460–466, DOI:10.1111/j.1551-2916.2008.02869.x.
- M. Wiegel, M. H. J. Emond, E. R. Stobbe and G. Blasse, Luminescence of alkali tantalates and niobates, J. Phys. Chem. Solids, 1994, 55, 773–778, DOI:10.1016/0022-3697(94)90030-2.
- M. Wiegel and G. Blasse, The luminescence properties of octahedral and tetrahedral molybdate complexes, J. Solid State Chem., 1992, 99, 388–394, DOI:10.1016/0022-4596(92)90327-R.
- Y. Li and X. Liu, Sol-gel synthesis, structure and luminescence properties of Ba2ZnMoO6:Eu3+ phosphors, Mater. Res. Bull., 2015, 64, 88–92, DOI:10.1016/j.materresbull.2014.12.041.
| This journal is © The Royal Society of Chemistry 2017 |

