
 Open Access Article
 This Open Access Article is licensed under a
 Creative Commons Attribution 3.0 Unported Licence
High-efficiency electrochemical hydrogen evolution based on the intermetallic Pt2Si compound prepared by magnetron-sputtering†
Yuchan Zhu,
Min Yuan,
Li Deng,
Ruoxi Ming,
Ailian Zhang,
Ming Yang,
Bo Chai and
Zhandong Ren*
School of Chemical and Environmental Engineering, Wuhan Polytechnic University, Wuhan, 430023, P. R. China. E-mail: renzhandong@163.com
First published on 5th January 2017
Abstract
The development of highly active and stable electrocatalysts for the hydrogen evolution reaction (HER) is central to the area of renewable energy. Si nanocomposites exhibited high efficiency in a light-induced hydrogen evolution reaction. However, there are few reports on the experimental application of the electrochemical HER. Herein, we report a simple synthesis of an intermetallic Pt2Si electrode using magnetron sputtering (MS) synthesis. The physical and electrochemical characterization of the materials was achieved by scanning electron microscopy (SEM), atomic force microscopy (AFM), X-ray fluorescence (XRF), X-ray diffraction (XRD), and X-ray photoelectron spectroscopy (XPS). Herein, the electrochemical catalytic activity towards the HER of an intermetallic Pt2Si MS (IM-Pt2Si-MS) electrode is demonstrated for the first time. Cyclic voltammetry (CV) curves reveal that the H underpotential deposition (H-UPD) peaks of the IM-Pt2Si-MS electrode shift to higher potentials than those of a Pt electrode, which indicates that hydrogen is more easily adsorbed on the Pt2Si surface. Thus, the IM-Pt2Si-MS electrode exhibited a higher HER activity than that of a Pt electrode in 0.5 M H2SO4 solution through linear sweep voltammetry (LSV). This is attributed to the electronic structure modification of Pt and the synergistic effect of the Pt–Si binary alloy in the IM-Pt2Si-MS electrode. In addition, the Tafel slope of 30.5 mV dec−1 indicates that the mechanism for the Pt2Si-catalyzed HER is Volmer–Tafel, for which the combined desorption of hydrogen is the rate-limiting step.
Introduction
With the increasing demands for clean and renewable energy to solve the problems related to the emission of greenhouse gases and environmental pollution, hydrogen has attracted much attention as an ideal energy carrier.1–5 Hydrogen has some advantages, such as high energy density, high energy per unit mass, cleanliness, and environmental safety, in comparison to other fuels.6,7 On the other hand, hydrogen is being considered as an energy carrier in the fuel cell technology. Despite its great application prospects, the cost-effective and sustainable production of hydrogen has proven to be a great challenge. To date, extensive efforts have been devoted to exploring the advanced techniques for hydrogen production.7–12The hydrogen evolution reaction (HER) is an electrochemical procedure for hydrogen production, which is considered to be one of the most promising processes and has been extensively investigated.9,13,14 A good catalyst for the HER is required to be able to reduce the overpotential and consequently increase the intrinsic kinetic rate. A volcano curve relates the intrinsic kinetic rate (the exchange current density, j0) to the adsorption free energy of the reaction intermediate.8,15–19 Pt is near to the top of the volcano curve and, therefore, has a slightly negative hydrogen absorption energy. Pt has a high catalytic activity for the HER, but concerns related to its higher cost and rarity are significant hurdles with respect to its practical application. Therefore, intensive efforts have been devoted to the investigation of non-noble-metal alternatives, such as metal sulfides,16,19–31 metal carbides,3,32–36 metal phosphides,37–39 metal alloys,40,41 and metal oxides. On the other hand, Pt is generally inefficient, or not fast enough, for water dissociation.15 Hence, an optimal route to design a high-performance catalyst for the HER is to combine fast water dissociation with the desorption of OH− and the efficient recombination of Had.42–44 Metal hydroxides are effective catalysts for H2O molecule adsorption and dissociation, although they are poor at converting the resulting Had to hydrogen molecules. It has been reported that some metal hydroxides have improved the rate of the HER due to their excellent abilities in cleaving the HO–H bond.2,10,43,45–50
In addition to metal hydroxides, a Si nanocomposite has exhibited a high light-harvesting efficiency and hydrogen evolution performance under both UV-vis and visible light irradiation.51–53 On the surface of the silicon semiconductor, water molecules can spontaneously dissociate at the Si–H and Si–OH bonds.11,54 Moreover, Si can modify the electronic properties of Pt, via a synergistic strain and ligand electronic interaction. So Pt, in combination with Si, could be regarded as an ideal catalyst for the electrochemical generation of hydrogen from aqueous solutions. But, based on our knowledge, there are few reports on the experimental application of Si semiconductors for the electrochemical HER, except for those by Ensafi,55 Vijh,56 and Zhu.57 Vijh's study showed that Si can improve the HER activities of Fe, V, and Co in an acid system, but these are still far lower than that of Pt. Ensafi prepared a Pt/nanoporous silicon catalyst, where the nanoporous silicon was the support. This exhibited good electrocatalytic activity for the HER when compared with commercial Pt/C. Recently, Zhu showed that the hydrogen evolution activity of a Rh–Si composite is better than that of Rh nanoparticles, even exceeding that of commercial Pt/C at high overpotentials. The results reveal that hydrogen adsorbs on Rh and desorbs from Si, which has a lower adsorption energy.
Intermetallic compounds have stoichiometric compositions and ordered lattice structures. The well-defined surface structures of intermetallic compounds are desirable with respect to electrocatalysis, due to their remarkable stability and compatibility. Some intermetallic compounds have been applied for electrocatalysis, such as AuCu and PtPb, which showed striking effects in the oxygen reduction reaction (ORR) and the oxidation of small organic molecules. In this paper, intermetallic Pt2Si was prepared by magnetron-sputtering at room temperature. The structure of the intermetallic Pt2Si MS (IM-Pt2Si-MS) electrode was characterized by scanning electron microscopy (SEM), atomic force microscopy (AFM), X-ray fluorescence (XRF), X-ray diffraction (XRD), X-ray photoelectron spectrometry (XPS), and electrochemical methods. Then, the electrochemical catalytic activity toward the HER of the IM-Pt2Si-MS electrode was demonstrated for the first time.
Results and discussion
The morphologies and structures of the as-prepared IM-Pt2Si-MS electrode were characterized, as shown in Fig. 1. As displayed in Fig. 1a, we can see that the morphology of the IM-Pt2Si-MS electrode is approximately spherical with diameters of about 20 nm. In order to carefully observe the grain size and surface roughness, the IM-Pt2Si-MS electrode was further characterized by AFM. As shown in Fig. 1b, the electrode takes on a flat morphology containing uniformly spherical nanoparticles with sizes of 10–20 nm, which is consistent with the observed results from the SEM image. X-ray fluorescence (XRF) was also applied to confirm the Pt![[thin space (1/6-em)]](https://www.rsc.org/images/entities/char_2009.gif) :Si molar ratio in the IM-Pt2Si-MS electrode, and the result turned out to be 63.4%:36.6%, close to the nominal ratio of 2:1 in the intermetallic Pt2Si phase (see Table S1†).
:Si molar ratio in the IM-Pt2Si-MS electrode, and the result turned out to be 63.4%:36.6%, close to the nominal ratio of 2:1 in the intermetallic Pt2Si phase (see Table S1†).
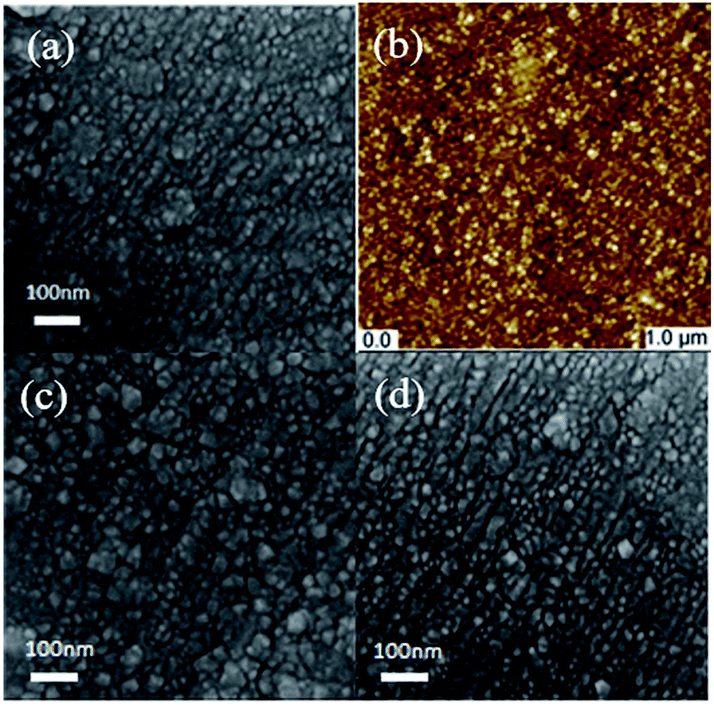 | ||
| Fig. 1 Morphologies of IM-Pt2Si-MS electrode with the SEM images: fresh electrode (a); after 1000 cycles CV in 0.5 mol L−1 H2SO4 (c); after 1000 cycles CV in 1.0 mol L−1 KOH (d). Morphologies of IM-Pt2Si-MS electrode with AFM images (b). | ||
The crystal structure of the IM-Pt2Si-MS electrode was characterized by XRD (Fig. 2). The characteristic diffraction peaks of the (110), (112), (202), (220), and (222) crystal facets are observed clearly, indicating that the IM-Pt2Si-MS electrode possesses a high-quality body-centered tetragonal (bct) crystal structure, comparing with JCPDS no. 17-0683. Moreover, the major peaks located at 2θ values of 32.1° and 44.7° are indexed as the (110) and (112) planes. Their intensity ratio is about 1.71, which is much higher than the data for JCPDS-17-0683 (0.90), confirming that the IM-Pt2Si-MS electrode has a (110)-dominated crystalline structure. The peak position (θmax) and peak width (B2θ) were obtained by curve fitting and were used for the calculation of the particle size (d), according to the Scherrer formula (d = 0.94λ/B2θcosθmax), where λ is 1.5406 Å. The average size of the IM-Pt2Si-MS electrode prepared in the present work was thus calculated to be about 21.86 nm, based on the peak width of the well-shaped (202) reflection.
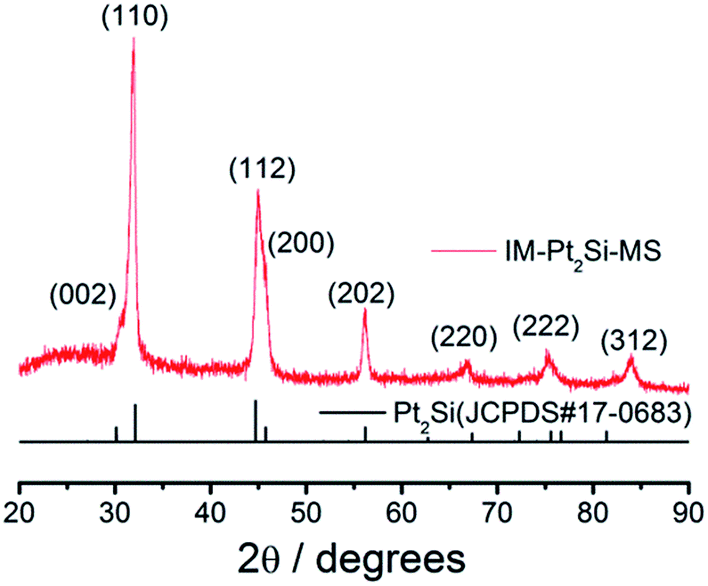 | ||
| Fig. 2 X-ray diffraction curves for IM-Pt2Si-MS electrode. | ||
To the best of our knowledge, the electrochemistry of intermetallic Pt2Si has been seldom reported in the literature.58 Herein, we demonstrate the CV of the IM-Pt2Si-MS electrode in 0.5 mol L−1 H2SO4 with a scan rate of 100 mV s−1. As shown in Fig. 3, the CV curves of both IM-Pt2Si-MS, Pt-MS, and Pt-disk electrodes clearly demonstrate the occurrence of two typical processes, i.e., Hads adsorption–desorption and OHads oxidation–reduction on the surface of Pt. However, it is clear that the peak-potentials of the oxidation and the reduction are different from each other. Firstly, in the high-potential region, the initial oxidation potential of the IM-Pt2Si-MS electrode is 0.72 V (for CV details see Fig. S1†), which is 0.12–0.13 V lower than that of the Pt-MS electrode (0.84 V) and the Pt-disk electrode (0.85 V). These observations indicate that the surface of the IM-Pt2Si-MS electrode is more likely to support electrochemical oxidation. This is understood by considering the existence of Si on the electrode surface, as Si is more active than Pt in terms of oxidation. This judgment is also supported by the negative shift in the reduction-peak potential of the IM-Pt2Si-MS electrode (0.778 V), in comparison to that of the Pt-MS (0.829 V) and Pt-disk (0.819 V) electrodes. As has been said, this is a clear indication that the oxygen affinity of Pt2Si is stronger than that of Pt.
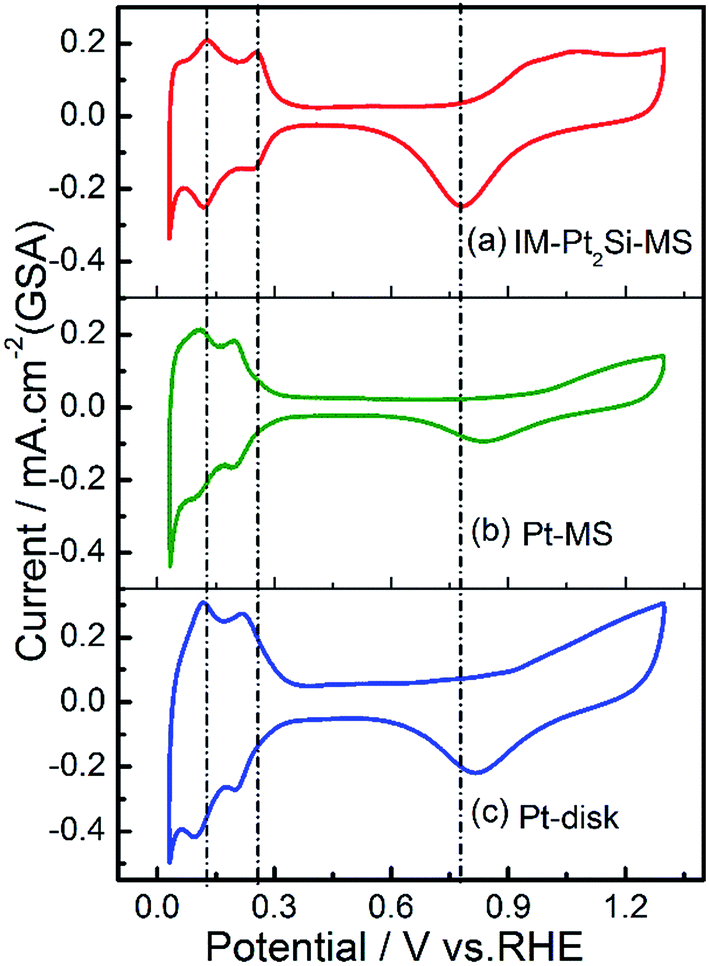 | ||
| Fig. 3 Cyclic voltammograms in 0.5 mol L−1 H2SO4 solution at a sweep rate of 100 mV s−1 for IM-Pt2Si-MS (a), Pt-MS (b) and Pt-disk (c) electrodes with respect to the geometric surface area (GSA). | ||
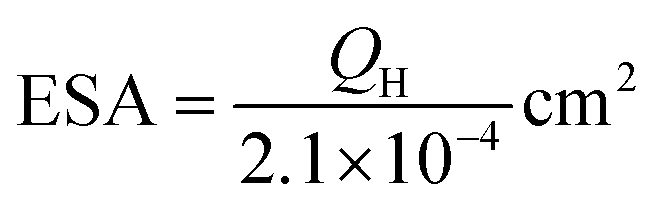
In the low-potential region, there are two hydrogen underpotential deposition (H-UPD) peaks on the surfaces of the three Pt-based electrodes. Careful inspection reveals that the H-UPD peaks of the IM-Pt2Si-MS electrode have shifted to a higher potential compared with those of the Pt-disk and Pt-MS electrodes. The two H-UPD peak-potentials of the IM-Pt2Si-MS electrode are 0.247 V and 0.121 V, which are higher than those of the Pt-MS electrode (about 49 and 26 mV) and the Pt-disk electrode (about 46 and 24 mV). The higher potential of the H-UPD peaks indicate that hydrogen is easily adsorbed on the Pt2Si surface. Therefore, the IM-Pt2Si-MS electrode should have excellent hydrogen evolution reaction activity, which will be discussed in detail later in the article. Moreover, based on the capacitance of hydrogen adsorption, the electrochemically active surface areas (ESA) of the catalysts were determined. The area of H-adsorption can be used to estimate the ESA of the Pt catalysts, according to the following equation:
 | (1) |
LSV measurements were performed to investigate the activity of the HER using a three-electrode system in 0.5 M H2SO4, with a scan rate of 5 mV s−1. This is a systematic and effective method to investigate the electrochemical activity of electrocatalysts. In the linear potential sweep curves, their cathodic currents all appeared from 0.03 V, followed by hydrogen absorption and evolution currents. As expected and clearly represented in Fig. 4, the HER activity of the IM-Pt2Si-MS electrode is higher than that of the Pt2Si-MS and Pt-disk electrodes. For instance, to obtain a current density of 40 mA cm−2 (GSA) in 0.5 M H2SO4, overpotentials of 78 mV, 120 mV, and 174 mV are required for the IM-Pt2Si-MS, Pt-disk, and Pt-MS electrodes (see Fig. 4a). Moreover, the overpotential at 40 mA cm−2 (ESA) is 106 mV for the IM-Pt2Si-MS electrode, while the overpotential for Pt electrodes (Pt-MS and Pt-disk) is 186 mV (see Fig. 4b). Additionally, the IM-Pt2Si-MS electrode exhibited a high current density of 36.1 mA cm−2 (ESA) at −0.1 V, which is much higher than that for Pt electrodes (Pt-MS and Pt-disk) (14.6 mA cm−2). Finally, the apparent activity for the HER of the Pt disk electrode is higher than that of the Pt-MS electrode, because the Pt-disk has a larger electrochemical area than the Pt-MS electrode. If the electrochemical area is normalized, as shown in Fig. 4b, the electrochemical activity of the Pt-MS and Pt-disk is similar. The HER activities of the three electrocatalysts in 1.0 M KOH solution have also been investigated (see Fig. S2†), in which the best is still IM-Pt2Si-MS.
 | ||
| Fig. 4 Linear sweep voltammetry curves of IM-Pt2Si-MS, Pt-MS, and Pt-disk electrodes in 0.5 mol L−1 H2SO4 solution at a sweep rate of 5 mV s−1 with respect to geometric surface area (GSA) (a) and electrochemically active surface area (ESA) (b). | ||
The superior HER activity of the IM-Pt2Si-MS electrode could be attributed to two aspects. First of all, Si atoms can significantly modify the electronic structure of Pt by the so-called ligand effects.15 Based on the volcano curve of the HER, the extremely strong bonding of hydrogen to Pt atoms greatly limits the HER activity. DFT calculations can also offer a closer view of how the inherent electronic structure, especially the metal d-orbital levels, affect the strength of H adsorption on the surface of a given electrode.17,18,59 According to the DOS of Pt2Si, the d-band center has downshifted with respect to the Fermi levels,60 which implies that the adsorption of Hads on the Pt2Si surface would be weakened. To further unambiguously observe the electronic effect of Si, X-ray photoelectron spectroscopy (XPS) was employed to examine the electronic properties of the IM-Pt2Si-MS electrode. Fig. 5a shows the wide-range XPS spectrum of the IM-Pt2Si-MS electrode. Over the whole range of binding energies, there are six clear peaks: Pt 4f, Pt 4d, Pt 4p, Si 2p, C 1s, and O 1s. The oxygen may originate from the oxygen-containing species, which are related to the adsorbed oxygen on the Pt surface and the Si–O–Si caused by the surface oxidation in air. Further analysis of the high-resolution Pt 4f spectrum is shown in Fig. 5b. Here, the IM-Pt2Si-MS electrode shows a spin–orbit coupled doublet (Pt 4f7/2 (71.7 eV), 4f5/2 (75.0 eV)), which is deconvoluted into Pt0 components. By comparison with the peak position of Pt (4f7/2 (71.0 eV), 4f5/2 (74.4 eV)), both the signals of the IM-Pt2Si-MS electrode shift to a higher binding energy by 0.65 eV. This should be ascribed to the interaction of Pt with Si in an intermetallic phase. The electron is transferred from Pt to Si, so the inner-layer electron binding energy of Pt can be increased. The high-resolution Si 2p spectrum is shown in Fig. S3,†in which the two clear peaks (100.1 eV, 102.9 eV) are attributed to the Si–O component. In addition, the surface composition of the IM-Pt2Si-MS electrode is given in Table S2.† The molar ratio of Si and Pt is 62.19:37.81, which is significantly higher than the bulk composition (36.64:63.36). This shows that there is enrichment of silicon on the surface of the IM-Pt2Si-MS electrode.
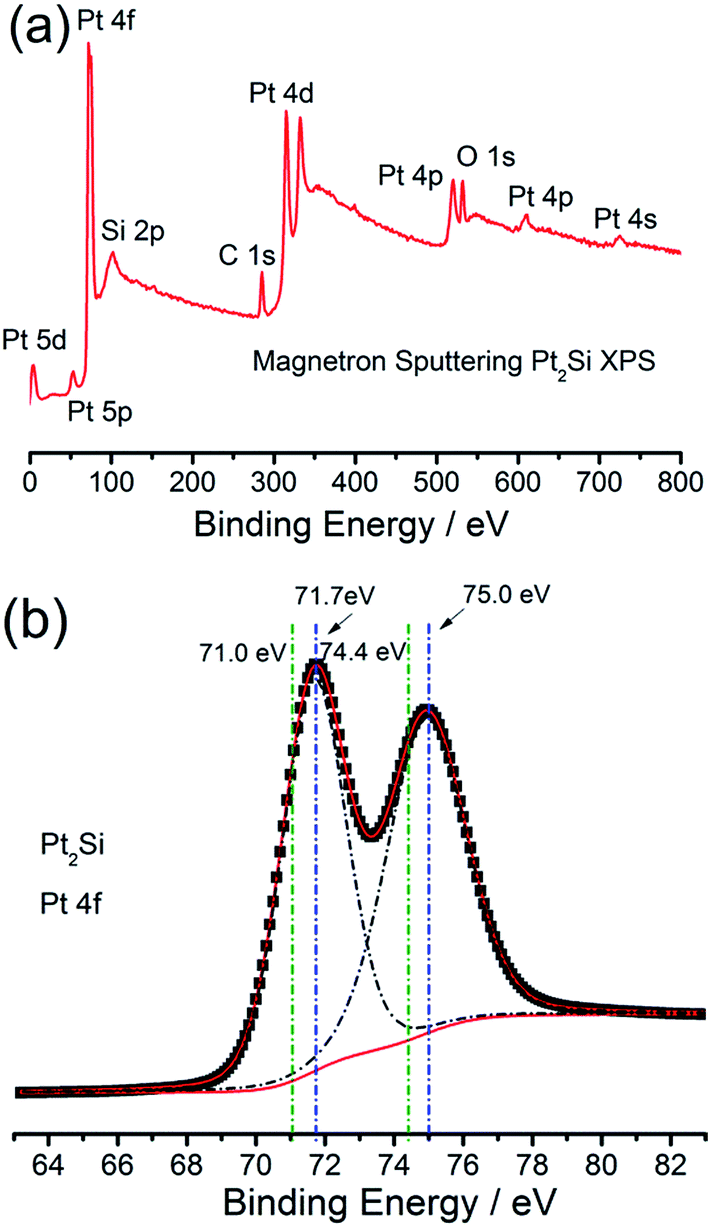 | ||
| Fig. 5 XPS analysis of the IM-Pt2Si-MS electrode for wide-range spectrum (a) and high-resolution spectrum (b). | ||
Secondly, the synergistic effect of Si could play an important role. It is generally known that the adsorbed hydrogen intermediates are facilely converted into molecular hydrogen on the Pt surface. However, Pt is not sufficiently active in water dissociation and cannot effectively interrupt HO–H bonds. But Si can effectively break HO–H bonds, which has been proven by the CV graph of the IM-Pt2Si-MS electrode in Fig. 3. Moreover, the open circuit potential can represent the oxidation state of the electrode surface. Fig. S4† indicates that the open circuit potential of the Pt2Si surface is 0.75 V, which is higher than that of Pt (0.70 V) in 0.5 M H2SO4 solution. This therefore shows that the more oxygen species automatically formed on the IM-Pt2Si-MS electrode surface, the higher the open circuit potential created. In addition, the formation of oxygen species on the electrode surface is favorable to CO oxidation stripping. We find that CO oxidation on Pt2Si does proceed more favorably than on Pt. As depicted in Fig. 6, the peak potential of CO stripping shifts negatively by 100 mV on Pt2Si, in comparison to Pt. This also proves that more oxygen species have been formed on the Pt2Si surface. On the above three bases, this indicates that H2O decomposition on the IM-Pt2Si-MS electrode surface is easier than on the Pt-MS electrode. Thus, the IM-Pt2Si-MS electrode could exhibit significant synergistic effects in the HER process, where Si atoms initiate water dissociation and Pt atoms are responsible for the adsorption of absorbed hydrogen intermediates.
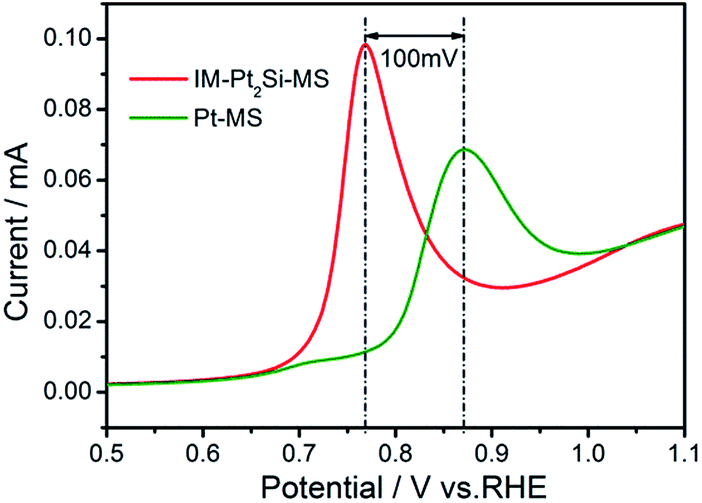 | ||
| Fig. 6 CO stripping curves of IM-Pt2Si-MS and Pt-MS electrodes in 0.5 mol L−1 H2SO4 solution at a sweep rate of 20 mV s−1. | ||
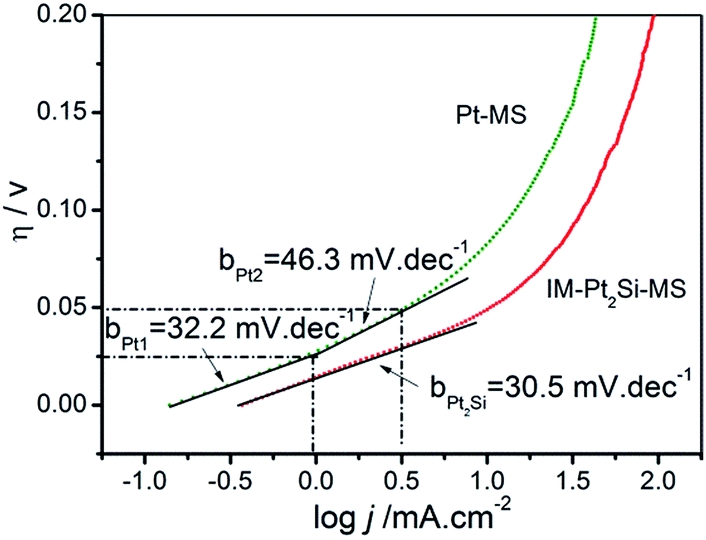
To study the kinetics of the HER process, Tafel analysis was carried out on the polarization curves of the IM-Pt2Si-MS and Pt-MS electrodes in 0.5 mol L−1 H2SO4. The Tafel slope of the IM-Pt2Si-MS electrode is only 30.5 mV dec−1, which is lower than that of the Pt-MS electrode (32.2 mV dec−1 (η < 0.025 V); 46.3 mV dec−1 (0.025 V < η < 0.05 V)). The small Tafel slope shows that the IM-Pt2Si-MS electrode has a faster increase in the HER rate with increasing overpotential. In addition, the exchange current density (j0) of the above electrocatalysts is further calculated by extrapolating the Tafel plots, which is the most inherent measure of HER activity. As expected, the j0 (0.33 mA cm−2) for the IM-Pt2Si-MS electrode is higher than that of the Pt-MS electrode (0.14 mA cm−2).
Using the Tafel plots shown in Fig. 7, it is possible to determine the reaction mechanism and the rate-determining step (rds). In acidic solutions, the mechanism of the HER mainly involves three reactions (eqn (2)–(4)).25,34 The common first step is the Volmer step (2), where water dissociates and forms an absorbed hydrogen (Had). This is followed by either the Tafel step (3) or the Heyrovsky step (4) to give H2. Assuming a small surface coverage of hydrogen, a fast discharge reaction (2) followed by a rate-determining combination reaction (3) results in a theoretical Tafel slope of 29 mV dec−1 (2.303RT/2F) at 25 °C. If the electrochemical desorption step (4) is the rate-determining step, the Tafel slope is 38 mV dec−1 (2.303RT/1.5F) at 25 °C. If reaction (2) is rate-determining or the surface coverage is close to one, the Tafel slope should be 116 mV dec−1.
 | ||
| Fig. 7 Tafel plot curves of IM-Pt2Si-MS and Pt-MS electrodes in 0.5 mol L−1 H2SO4 solution. | ||
The discharge reaction (Volmer step) is:
| H3O+ + e− → Had + H2O |
| b = 2.303RT/αF = 116 mV dec−1 α = 0.5 | (2) |
The combination reaction (Tafel step) is:
| Had + Had → H2 |
| b = 2.303RT/2F = 29 mV dec−1 | (3) |
The ion + atom reaction (Heyrovsky step) is:
| H3O+ + Had + e− → H2 + H2O |
| b = 2.303RT/[(1 + α)F] = 38 mV dec−1 α = 0.5 | (4) |
Thus, based on the electrochemical results in the present work, it can be concluded that the reaction mechanism for Pt2Si is in good agreement with the Volmer–Tafel pathway, and the Tafel step is the rds. Hydrogen is first adsorbed on the electrode surface via the Volmer step and is then absorbed into the lattice. Of course, the adsorbed hydrogen can form gaseous hydrogen, according to the Tafel reactions.
To study the charge-transfer mechanism of the HER on the catalysts, we conducted electrochemical impedance spectroscopy (EIS) measurements. Fig. 8 shows the Nyquist diagrams of catalysts recorded at an overpotential of 50 mV vs. RHE, which possess two well-defined semicircles. The equivalent circuit corresponding to the EIS data of the IM-Pt2Si-MS electrode is fitted with a two-time-constant model (the equivalent circuit, Rs(RfCf)(RctCdl), is shown in Fig. S5†). The values of the electrolyte solution resistance (Rs), the membrane resistance (Rf), the charge-transfer resistance (Rct), and the constant phase element CPE (Cf and Cdl) are listed in Table S3.† The low-frequency semicircle is ascribed to the charge transfer process, while the high-frequency semicircle could be associated with the mass transfer processes of the adsorbed species at the cathode. The charge-transfer resistance (Rct) data is obtained in the low-frequency zone, which is related to the electrocatalytic kinetics. The Rct of Pt2Si is 1.454 Ω, which is much lower than for Pt (3.215 Ω), suggesting fast charge transport during the HER process. The double-layer capacitance (Cdl) gives the faradaic impedance in the HER process. With respect to Pt (45.4 μF cm−2), the increased Cdl value of Pt2Si (54.8 μF cm−2) is consistent with its large ESA values, indicating efficient detachment of evolved hydrogen bubbles from the IM-Pt2Si-MS electrode surface. Lastly, it is worth noting that the low series resistance (Rs) value of 0.9 Ω suggests a small ohmic loss in the electrolyte.
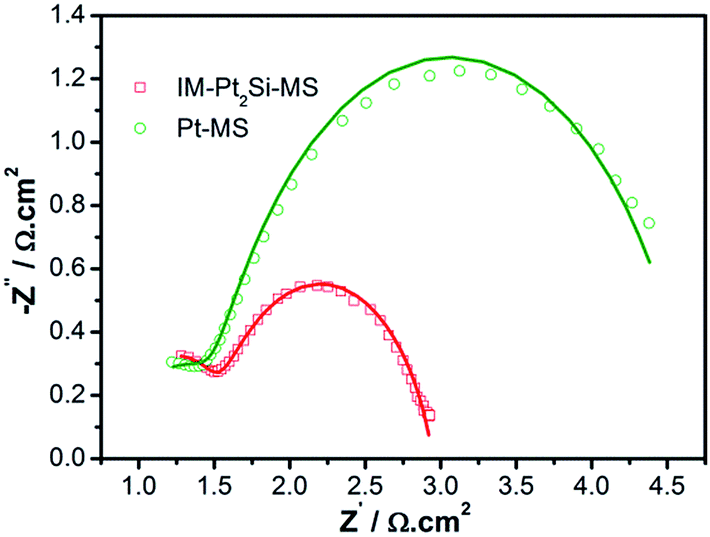 | ||
| Fig. 8 Complex plane plots of impedance of IM-Pt2Si-MS and Pt-MS electrodes in 0.5 mol L−1 H2SO4 solution at an overpotential of 50 mV vs. RHE. | ||
Finally, we tested the long-term stability of the IM-Pt2Si-MS electrode. This is an important aspect of evaluating the performance of an electrocatalyst. To investigate the stability of the catalysts, accelerated CV tests were conducted in the potential range −0.2 to 0.2 V, with a scan rate of 50 mV s−1 in 0.5 M H2SO4. As shown in Fig. 9, it is obvious that the polarization curve of the IM-Pt2Si-MS electrode after 1000 cycles is similar to the polarization curve of the initial Pt2Si MS electrode. This suggests that the IM-Pt2Si-MS electrode is durable for hydrogen evolution under the experimental conditions used. The stability of the IM-Pt2Si-MS electrode can also be proven by the data from Tables S1, S2, Fig. 1c, d and S6,† which show that the morphology, composition, and electrochemical area are not changed after 1000 cycles of CV.
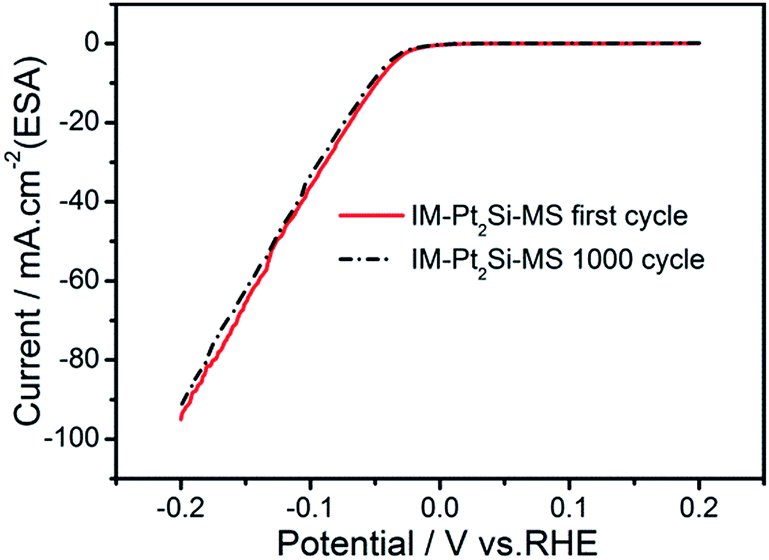 | ||
| Fig. 9 The long-term HER stability test in 0.5 mol L−1 H2SO4 for IM-Pt2Si-MS electrode at a sweep rate of 50 mV s−1. | ||
Conclusions
In the present work, an intermetallic Pt2Si electrode has been synthesized through a simple magnetron sputtering synthesis, and the electrochemical behavior and the catalytic activity of the IM-Pt2Si-MS electrode toward the HER is also demonstrated for the first time. The surface Si component on the IM-Pt2Si-MS electrode has not only contributed to breaking the HO–H bonds, but has also promoted the surface reactivity of the Pt component. In comparison to a Pt electrode, the intermetallic Pt2Si electrode exhibits a higher catalytic activity toward the HER. The Tafel slope indicates that the mechanism for the Pt2Si-catalyzed HER is Volmer–Tafel, for which the combined desorption of hydrogen is the rate-limiting step. On the basis of XPS of the surface electronic structure, we think that the incorporation of Si into the Pt lattice, forming intermetallic Pt2Si, seems to be an effective approach for further enhancing the activity of Pt for the HER.Experimental
Materials
The titanium plate substrate (Ti, ≥99.99%), platinum target (Pt, ≥99.99%), and silicon target (Si, ≥99.99%) were purchased from SKY Technology Development Co., Ltd, Shenyang, China. Acetone (CH3COCH3, AR), sodium carbonate (Na2CO3, AR), and sulfuric acid (H2SO4, AR) were purchased from Sinopharm Chemical Reagent Co., Ltd., Shanghai, China. All reagents were analytical grade and were used without further purification. All gases (argon and hydrogen) (99.999%) were purchased from Ming-Hui company.Electrode preparation
A titanium plate of grade TA1 was utilized as the electrode substrate; this was sandblasted, and degreased in acetone and sodium carbonate with ultrasonication. The Pt2Si electrode was prepared by magnetron-sputtering (MS) synthesis. Before co-sputtering, Pt and Si were sputtered individually onto a Si wafer with different sputtering powers, so as to obtain the power–mass relationship between Pt and Si (see Fig. S7†). Then, Pt and Si were co-sputtered with individually controlled powers to obtain a Pt2Si electrode, labeled as IM-Pt2Si-MS. The loading mass of the Pt2Si is 0.1 mg cm−2. The Pt electrode without Si, prepared by magnetron sputtering, was recorded as Pt-MS.Material characterization
X-ray diffraction (XRD) was used to analyze the structure of the electrode coating. The inspection was carried out at room temperature on a MAXima_X XRD-7000 X-ray diffractometer (Shimadzu, Japan), using Cu Kα radiation (λ = 0.15405 nm), operating at 40 kV and 30 mA. Analysis of the composition of the electrode was carried out by X-ray fluorescence (XRF: EDX-7000, Shimadzu, Japan). The surface morphology of the Pt2Si MS electrode was characterized by scanning electron microscopy (SEM: S-3000N, Hitachi Co., Japan) and atomic force microscopy (AFM: MultiMode8, Bruker, Germany). X-ray photoelectron spectrometry (XPS: ESCLAB 250Xi, Thermo Scientific, America) with monochromatized Al Kα radiation was used to analyze the electronic properties and elemental composition of the samples. The fitting of the data was obtained with XPS Peak41 software.Electrochemical measurements
The electrochemical experiments were carried out with a CHI 660 D electrochemical analyzer at 30 °C. All the electrochemical measurements were carried out in a typical three-electrode electrochemical glass cell. A carbon paper was used as the counter electrode, a reversible hydrogen electrode (RHE) as the reference, and an IM-Pt2Si-MS electrode (Pt-MS or Pt-disk) as the working electrode. For electrochemical tests, the surface of the specimen was covered with epoxy resin, except for the working area (1 cm2) on one side. All potentials in this study were reported with respect to the reversible hydrogen electrode (RHE). Cyclic voltammetry (CV) measurements were performed from 0.03 to 1.3 V in 0.5 mol L−1 H2SO4 solution at a scan rate of 50 mV s−1. Linear sweep voltammetry (LSV) was used as a systematic and effective method to investigate the electrochemical activity of the electrocatalysts. After obtaining a stable cycle between 0.03 and 1.3 V, the HER polarization curves were obtained by sweeping the potential from −0.2 to 0.2 V (vs. RHE) at a scan rate of 5 mV s−1 in Ar-saturated 0.5 mol L−1 H2SO4. The durability tests were carried out by repeating the potential scan from −0.2 to 0.2 V (vs. RHE) with 1000 cycles in Ar-saturated 0.5 mol L−1 H2SO4 solution, according to previous reports.4,20,61 Electrochemical impedance spectroscopy was performed with the working electrode biased at a constant value of −0.05 V vs. RHE, with the frequency ranging from 100 kHz to 0.1 Hz with an amplitude of 10 mV. For CO-stripping measurements, a cell voltage of 0.1 V was held for 30 min while the working electrode was successively flushed with 50 mL cm−3 CO for the first 10 min, then with 200 mL cm−3 Ar for 20 min. Finally, the CV measurements of CO-stripping were performed from 0.03 to 1.3 V at a scan rate of 20 mV s−1.Acknowledgements
The authors would like to acknowledge financial support from The National Natural Science Foundation of China (31101370) and Research and Innovation Initiatives of WHPU (2015d8).Notes and references
- H. M. Chen, C. K. Chen, R. S. Liu, L. Zhang, J. Zhang and D. P. Wilkinson, Chem. Soc. Rev., 2012, 41, 5654–5671 RSC.
- S. Cobo, J. Heidkamp, P.-A. Jacques, J. Fize, V. Fourmond, L. Guetaz, B. Jousselme, V. Ivanova, H. Dau, S. Palacin, M. Fontecave and V. Artero, Nat. Mater., 2012, 11, 802–807 CrossRef CAS PubMed.
- R. G. Ma, Y. Zhou, Y. F. Chen, P. X. Li, Q. Liu and J. C. Wang, Angew. Chem., Int. Ed., 2015, 54, 14723–14727 CrossRef CAS PubMed.
- X. Zhao, X. Ma, J. Sun, D. H. Li and X. R. Yang, ACS Nano, 2016, 10, 2159–2166 CrossRef CAS PubMed.
- Z. F. Huang, J. J. Song, K. Li, M. Tahir, Y. T. Wang, L. Pan, L. Wang, X. W. Zhang and J. J. Zou, J. Am. Chem. Soc., 2016, 138, 1359–1365 CrossRef CAS PubMed.
- C. G. Morales-Guio, L.-A. Stern and X. L. Hu, Chem. Soc. Rev., 2014, 43, 6555–6569 RSC.
- M. G. Walter, E. L. Warren, J. R. McKone, S. W. Boettcher, Q. Mi, E. A. Santori and N. S. Lewis, Chem. Rev., 2010, 110, 6446–6473 CrossRef CAS PubMed.
- L. Zhang, K. Xiong, Y. Nie, X. X. Wang, J. L. Liao and Z. D. Wei, J. Power Sources, 2015, 297, 413–418 CrossRef CAS.
- J. R. McKone, S. C. Marinescu, B. S. Brunschwig, J. R. Winkler and H. B. Gray, Chem. Sci., 2014, 5, 865–878 RSC.
- Y. F. Xu, M. R. Gao, Y. R. Zheng, J. Jiang and S. H. Yu, Angew. Chem., Int. Ed., 2013, 52, 8546–8550 CrossRef CAS PubMed.
- C. He, X. L. Wu, J. C. Shen and P. K. Chu, Nano Lett., 2012, 12, 1545–1548 CrossRef CAS PubMed.
- M. Zeng and Y. G. Li, J. Mater. Chem. A, 2015, 3, 14942–14962 CAS.
- X. G. Wang, W. Li, D. H. Xiong and L. F. Liu, J. Mater. Chem. A, 2016, 4, 5639–5646 CAS.
- D. H. Xiong, X. G. Wang, W. Li and L. F. Liu, Chem. Commun., 2016, 52, 8711–8714 RSC.
- J. Greeley and N. M. Markovic, Energy Environ. Sci., 2012, 5, 9246–9256 CAS.
- T. F. Jaramillo, K. P. Jorgensen, J. Bonde, J. H. Nielsen, S. Horch and I. Chorkendorff, Science, 2007, 317, 100–102 CrossRef CAS PubMed.
- Y. Zheng, Y. Jiao, M. Jaroniec and S. Z. Qiao, Angew. Chem., Int. Ed., 2015, 54, 52–65 CrossRef CAS PubMed.
- Y. Jiao, Y. Zheng, M. Jaroniec and S. Z. Qiao, Chem. Soc. Rev., 2015, 44, 2060–2086 RSC.
- B. Hinnemann, P. G. Moses, J. Bonde, K. P. Jorgensen, J. H. Nielsen, S. Horch, I. Chorkendorff and J. K. Norskov, J. Am. Chem. Soc., 2005, 127, 5308–5309 CrossRef CAS PubMed.
- Y. G. Li, H. L. Wang, L. M. Xie, Y. Y. Liang, G. S. Hong and H. J. Dai, J. Am. Chem. Soc., 2011, 133, 7296–7299 CrossRef CAS PubMed.
- D. Voiry, H. Yamaguchi, J. Li, R. Silva, D. C. B. Alves, T. Fujita, M. Chen, T. Asefa, V. B. Shenoy, G. Eda and M. Chhowalla, Nat. Mater., 2013, 12, 850–855 CrossRef CAS PubMed.
- Z. Y. Zeng, C. L. Tan, X. Huang, S. Y. Bao and H. Zhang, Energy Environ. Sci., 2014, 7, 797–803 CAS.
- X. Huang, Z. Y. Zeng, S. Y. Bao, M. F. Wang, X. Y. Qi, Z. X. Fan and H. Zhang, Nat. Commun., 2013, 4, 1444 CrossRef PubMed.
- Z. J. Huang, W. J. Luo, L. Ma, M. Z. Yu, X. D. Ren, M. F. He, S. Polen, K. Click, B. Garrett, J. Lu, K. Amine, C. Hadad, W. L. Chen, A. Asthagiri and Y. Y. Wu, Angew. Chem., Int. Ed., 2015, 54, 15181–15185 CrossRef CAS PubMed.
- J. Wang, H. X. Zhong, Z. L. Wang, F. L. Meng and X. B. Zhang, ACS Nano, 2016, 10, 2342–2348 CrossRef CAS PubMed.
- J. Staszak-Jirkovský, C. D. Malliakas, P. P. Lopes, N. Danilovic, S. S. Kota, K.-C. Chang, B. Genorio, D. Strmcnik, V. R. Stamenkovic, M. G. Kanatzidis and N. M. Markovic, Nat. Mater., 2016, 15, 197–204 CrossRef PubMed.
- X. M. Geng, W. W. Sun, W. Wu, B. Chen, A. Al-Hilo, M. Benamara, H. L. Zhu, F. Watanabe, J. B. Cui and T. Chen, Nat. Commun., 2016, 7, 10672 CrossRef CAS PubMed.
- G. Ye, Y. Gong, J. Lin, B. Li, Y. He, S. T. Pantelides, W. Zhou, R. Vajtai and P. M. Ajayan, Nano Lett., 2016, 16, 1097–1103 CrossRef CAS PubMed.
- W. Li, X. G. Wang, D. H. Xiong and L. F. Liu, Int. J. Hydrogen Energy, 2016, 41, 9344–9354 CrossRef CAS.
- J. Zhang, T. Wang, P. Liu, S. H. Liu, R. H. Dong, X. D. Zhuang, M. W. Chen and X. L. Feng, Energy Environ. Sci., 2016, 9, 2789 CAS.
- M. A. Worsley, S. J. Shin, M. D. Merrill, J. Lenhardt, A. J. Nelson, L. Y. Woo, A. E. Gash, T. F. Baumann and C. A. Orme, ACS Nano, 2015, 9, 4698–4705 CrossRef CAS PubMed.
- L. L. Fan, P. F. Liu, X. C. Yan, L. Gu, Z. Z. Yang, H. G. Yang, S. L. Qiu and X. D. Yao, Nat. Commun., 2016, 7, 10667 CrossRef CAS PubMed.
- S. P. Wang, J. Wang, M. L. Zhu, X. B. Bao, B. Y. Xiao, D. F. Su, H. R. Li and Y. Wang, J. Am. Chem. Soc., 2015, 137, 15753–15759 CrossRef CAS PubMed.
- Z. L. Wang, X. F. Hao, Z. Jiang, X. P. Sun, D. Xu, J. Wang, H. X. Zhong, F. L. Meng and X. B. Zhang, J. Am. Chem. Soc., 2015, 137, 15070–15073 CrossRef CAS PubMed.
- Y. Zhao, K. Kamiya, K. Hashimoto and S. Nakanishi, J. Am. Chem. Soc., 2015, 137, 110–113 CrossRef CAS PubMed.
- H. J. Qiu, Y. Ito, W. T. Cong, Y. W. Tan, P. Liu, A. Hirata, T. Fujita, Z. Tang and M. W. Chen, Angew. Chem., Int. Ed., 2015, 54, 14031–14035 CrossRef CAS PubMed.
- W. Li, X. F. Gao, X. G. Wang, D. H Xiong, P. P. Huang, W. G. Song, X. Q. Bao and L. F. Liu, J. Power Sources, 2016, 330, 156–166 CrossRef CAS.
- X. G. Wang, W. Li, D. H. Xiong, D. Y. Petrovykh and L. F. Liu, Adv. Funct. Mater., 2016, 26, 4067–4077 CrossRef CAS.
- W. Li, D. H. Xiong, X. F. Gao, W. G. Song, F. Xia and L. F. Liu, Catal. Today, 2016 DOI:10.1016/j.cattod.2016.09.007.
- Z. X. Fan, Z. M. Luo, X. Huang, B. Li, Y. Chen, J. Wang, Y. L. Hu and H. Zhang, J. Am. Chem. Soc., 2016, 138, 1414–1419 CrossRef CAS PubMed.
- Y. Shen, A. C. Lua, J. Y. Xi and X. P. Qiu, ACS Appl. Mater. Interfaces, 2016, 8, 3464–3472 CAS.
- N. Danilovic, R. Subbaraman, D. Strmcnik, K. Chang, A. P. Paulikas, V. R. Stamenkovic and N. M. Markovic, Angew. Chem., Int. Ed., 2012, 51, 12495–12498 CrossRef CAS PubMed.
- R. Subbaraman, D. Tripkovic, D. Strmcnik, K. Chang, M. Uchimura, A. P. Paulikas, V. Stamenkovic and N. M. Markovic, Science, 2011, 334, 1256–1260 CrossRef CAS PubMed.
- D. Strmcnik, M. Uchimura, C. Wang, R. Subbaraman, N. Danilovic, D. van der Vliet, A. P. Paulikas, V. R. Stamenkovic and N. M. Markovic, Nat. Chem., 2013, 5, 300–306 CrossRef CAS PubMed.
- L. Wang, C. Lin, D. K. Huang, J. M. Chen, L. Jiang, M. K. Wang, L. F. Chi, L. Shi and J. Jin, ACS Catal., 2015, 5, 3801–3806 CrossRef CAS.
- J. Swaminathan, R. Subbiah and V. Singaram, ACS Catal., 2016, 6, 2222–2229 CrossRef CAS.
- Y. Kuang, G. Feng, P. S. Li, Y. M. Bi, Y. P. Li and X. M. Sun, Angew. Chem., Int. Ed., 2016, 55, 693–697 CrossRef CAS PubMed.
- S. W. Li, Y. C. Wang, S. J. Peng, L. J. Zhang, A. M. Al-Enizi, H. Zhang, X. H. Sun and G. F. Zheng, Adv. Energy Mater., 2016, 6, 1501661 CrossRef.
- M. Y. Sun, Y. J. Chen, G. H. Tian, A. P. Wu, H. J. Yan and H. G. Fu, Electrochim. Acta, 2016, 190, 186–192 CrossRef CAS.
- R. Subbaraman, D. Tripkovic, K.-C. Chang, D. Strmcnik, A. P. Paulikas, P. Hirunsit, M. Chan, J. Greeley, V. Stamenkovic and N. M. Markovic, Nat. Chem., 2012, 11, 550–557 CAS.
- J. Huang, Y. J. Wu, D. D. Wang, Y. F. Ma, Z. K. Yue, Y. T. Lu, M. X. Zhang, Z. J. Zhang and P. Yang, ACS Appl. Mater. Interfaces, 2015, 7, 3732–3741 CAS.
- Z. P. Huang, C. F. Wang, Z. B. Chen, H. Meng, C. C. Lv, Z. Z. Chen, R. Q. Han and C. Zhang, ACS Appl. Mater. Interfaces, 2014, 6, 10408–10414 CAS.
- M. Metzler, A. Thorwart, S. Zeller, T. Diemant, R. J. Behm and T. Jacob, Catal. Today, 2015, 244, 3–9 CrossRef CAS.
- X. L. Wu, S. J. Xiong, J. Zhu, J. Wang, J. C. Shen and P. K. Chu, Nano Lett., 2009, 9, 4053–4060 CrossRef CAS PubMed.
- A. A. Ensafi, M. Jafari-Asl and B. Rezaei, Phys. Chem. Chem. Phys., 2015, 17, 23770–23782 RSC.
- A. K. Vijh, G. Belanger and R. Jacques, Int. J. Hydrogen Energy, 1990, 15, 789–794 CrossRef CAS.
- L. L. Zhu, H. P. Lin, Y. Y. Li, F. Liao, Y. Lifshitz, M. Q. Sheng, S.-T. Lee and M. W. Shao, Nat. Commun., 2016, 7, 12272 CrossRef PubMed.
- Z. D. Ren, L. Xiao, G. W. Wang, J. T. Lu and L. Zhuang, J. Energy Chem., 2014, 23, 265–268 CrossRef CAS.
- N. Du, C. M. Wang, X. J. Wang, Y. Lin, J. Jiang and Y. J. Xiong, Adv. Mater., 2016, 28, 2077–2084 CrossRef CAS PubMed.
- H. Bentmann, A. A. Demkov, R. Gregory and S. Zollner, Electronic, optical, and surface properties of PtSi thin films, Phys. Rev. B: Condens. Matter Mater. Phys., 2008, 78, 205302 CrossRef.
- X. Zhao, X. Ma, J. Sun, D. H. Li and X. R. Yang, ACS Nano, 2016, 10, 2159–2166 CrossRef CAS PubMed.
Footnote |
| † Electronic supplementary information (ESI) available. See DOI: 10.1039/c6ra24754g |
| This journal is © The Royal Society of Chemistry 2017 |