 Open Access Article
Molecular motions and free-energy landscape of serine proteinase K in relation to its cold-adaptation: a comparative molecular dynamics simulation study and the underlying mechanisms†
Peng Sang‡
 ab,
Xing Du‡cd,
Li-Quan Yangb,
Zhao-Hui Meng*a and
Shu-Qun Liu*ac
aLaboratory of Molecular Cardiology, Department of Cardiology, The First Affiliated Hospital of Kunming Medical University, Kunming, P. R. China. E-mail: zhhmeng@aliyun.com; shuqunliu@ynu.edu.cn
bCollege of Agriculture and Biological Science, Dali University, Dali, P. R. China
cLaboratory for Conservation and Utilization of Bio-Resources, Yunnan University, Kunming, P. R. China
dDepartment of Biochemistry and Molecular Biology, Ningxia Medical University, Ningxia, P. R. China
First published on 31st May 2017
Abstract
The physicochemical bases for enzyme cold-adaptation remain elusive. The current view is that psychrophilic enzymes are often characterized by enhanced flexibility at low temperature to obtain higher catalytic efficiency, but the determinant behind this phenomenon is less well known. To shed light on the physicochemical bases for enzyme cold-adaptation, we conducted comparative molecular dynamics simulations on mesophilic proteinase K and its homologous psychrophilic counterpart. Results revealed that psychrophilic proteinase K had increased flexibility in regions near or opposite to active site or substrate-binding pocket. Comparison between the large concerted motions derived from essential dynamics (ED) analyses indicated that the degree of motion and direction of some regions in psychrophilic proteinase K could enlarge the substrate-binding pocket, thereby favoring catalytic efficiency and cold-adaptation. Free-energy calculations based on metadynamics simulations revealed a more “rugged” and complex free-energy landscape (FEL) for psychrophilic proteinase K than that for mesophilic proteinase K, implying that the former had richer conformational diversity. Comparison between the structural properties of the mesophilic and psychrophilic forms of proteinase K during MD simulations showed that the increased flexibility of the psychrophilic form resulted most probably from the reduced number of inter-atomic interactions and increased number of dynamic hydrogen bonds. A refined model of FEL was proposed to explain the effect of water molecules in facilitation of enzyme cold-adaptation.
1. Introduction
“Psychrophiles”1 are mainly represented by microorganisms such as bacteria,2 archaea,3 algae,4 or yeast5 but also by plants and animals.6,7 At extremely low temperatures, psychrophiles must have a set of cold-adaptation mechanisms to maintain the integrity of their membranes and protein structures while guaranteeing membrane mobility and protein function. Discovering and clarifying these mechanisms have fundamental roles for understanding the interaction between life and the environment, the mechanism and driving force behind biodiversity and the secret of the origin of life.8,9Enzymes (which are proteins) are fundamental for every life process. Enzymes are the best target to study the mechanism behind the cold adaptation of psychrophiles. In recent years, many studies have focused on the relationship between the structure and function of psychrophilic enzymes and the cold-adaptation of psychrophiles.10–16 A general theory for cold-adaptation has not been formulated. However, psychrophilic enzymes are often characterized by enhanced flexibility at low temperatures to obtain higher catalytic efficiency (kcat/Km) and to cope with the reduction of metabolic fluxes and chemical reaction rates.17 Nevertheless, the higher conformational flexibility also gives rise to lower thermostability, which may result in enzyme inactivation. Comparative structural investigations of psychrophilic enzymes and their homologous mesophilic counterparts have revealed that they are often characterized by: reduced contact in the number of native atoms; reduced number of salt bridges; increased hydrophobicity on their surface; more and longer surface-exposed loops; more glycine residues.16,18
Nevertheless, different enzymatic families can follow different strategies to cope with a low-temperature environment,19,20 suggesting that differences in static structure and intra-molecular interactions may be not the main reason behind the cold-adaptation of psychrophilic enzymes. That is, the physicochemical basis for enzyme cold-adaptation is not known.12
Proteins are dynamic entities in cellular solution.21 The functional properties of a protein are decided not only by its relatively rigid structure but even more importantly by its “dynamic personalities”. These are characterized by the thermodynamics (the relative populations/probabilities/lifetimes of the conformational states) and kinetics (conformational transition that leads to a population redistribution between these conformational states) of the protein under the “free energy landscape” (FEL) theory.21–23 It is well established that protein dynamics are rooted in intramolecular thermal motion of atoms and their interactions with water molecules, and the latter have essential roles in the folding, structural stability, flexibility and function of proteins.24,25 Although there are only minute conformational differences between crystallized homologous psychrophilic and mesophilic structures,26 the physicochemical property and dynamic motion of water molecules at different temperatures is significantly changed in the actual protein–solvent system.24 For example, liquid water at low temperature (0–4 °C) is characterized by higher density, viscosity and dielectric constant than at high temperature (50–100 °C).24 These differences are due to the changes in thermal dynamics (dynamic personalities) of water molecules at different temperatures, and affect the dynamic personalities of proteins, and also their thermostability and function through protein–solvent interactions. Therefore, the influence of water molecules in the conformational state and dynamics of proteins should be taken into count when studying the mechanisms of cold-adaptation of psychrophilic enzymes. Otherwise, the static structure determined by X-ray diffraction reflects merely the average conformational state at a certain crystallization condition. For homologous psychrophilic enzymes, these conformational differences reflect the different crystallization condition but not the physicochemical basis for interpreting the cold-adaptation mechanism of psychrophilic enzymes. To explore the physicochemical mechanism of cold-adaptation of psychrophilic enzymes, their protein–solvent FEL should be reconstructed and compared with its homologous mesophilic counterpart. Nevertheless, these types of study are rarely reported due to the limited experiment approach and timescale of molecular dynamics (MD) simulation.
Proteases are enzymes that can hydrolyze peptide bonds in other proteins through catalytic reactions. Serine proteases are enzymes present in almost all organisms, and their catalytic reactions can bring about diverse functional consequences, such as digestion, immune response, blood coagulation and reproduction.27 A common catalytic mechanism that involves an identical stereochemistry of the “catalytic triad” Asp–His–Ser and the “oxyanion hole” has been established. Due to their near ubiquity and functional diversity, serine proteases often serve as excellent models to study the structure–function relationship of proteins and the mechanism of their temperature adaptation.28–30 As a typical subtilase, the structure of proteinase K in mesophilic and psychrophilic organisms has been shown in X-ray crystallographic studies26,31 (Fig. 1A and B), and proteinase K has high structural resemblance in these two types of organism. Proteinase K has a well-defined global fold and is composed of 15 β strands, six α helices and one 3/10 helice (Fig. 1A). The catalytic triad consists of Asp39, His69, and Ser224. The substrate-recognition site is primarily formed by two segments, Gly100–Tyr104 and Ser132–Gly136,32 and is well conserved among subtilases (the residues are numbered according 1IC6 structure). The primary structural differences between mesophilic and psychrophilic proteinase K are found in their exposed and buried surfaces. These differences may be related to temperature-dependent variation in the physical properties of water, which indicates that the hydrophobic effect may have a significant role in the cold-adaptation of psychrophilic enzymes.26 In addition, psychrophilic proteinase K is characterized by more hydrogen- and ion-pair interactions than that in the mesophilic form.
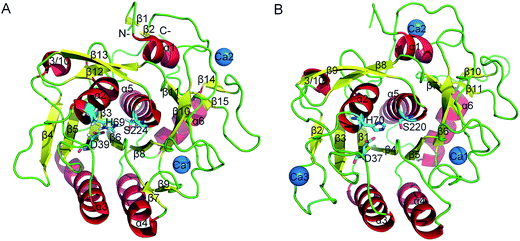 | ||
| Fig. 1 Ribbon representation of mesophilic (A) and psychrophilic (B) serine proteases. These structures were obtained from PDB with PDB codes 1IC6 and 1SH7. α helices, β strands, and loops are colored red, yellow, and green, respectively. The catalytic triad residues are shown as stick models. Ca2+ is shown as blue spheres. | ||
Static structures of these two types of proteinase K provide invaluable insights into the cold-adaptation of the serine protease family. However, many dynamic aspects, such as molecular motion, conformational diversity and the FEL in relation to cold-adaptation, are unclear if only the static structures are available. To shed light on the physicochemical bases for the cold-adaptation of serine proteases, mesophilic and psychrophilic proteinase K were used as starting structures for standard MD and metadynamics (MetaD) simulations.33,34 Conventional structural properties and dynamic variations of these two forms of proteinase K were examined and compared. In addition, the FEL of mesophilic and psychrophilic proteinase K was constructed and used to explore the mechanism underlying the cold-adaptation of this enzyme.
2. Materials and methods
2.1 Preparation of the starting structure
The high-resolution crystal structure of mesophilic proteinase K (PDB code = 1IC6 (ref. 31)) from Tritirachium album and psychrophilic subtilisin-like protease (PDB code = 1SH7 (ref. 26)) from Vibrio sp. PA-44 were used as starting models for the MD simulation. Before performing the MD simulation, all hetero atoms, such as NO3 and water crystals, were removed but Ca2+ was retained.2.2 MD simulation
Energy minimizations and MD simulations were performed using GROMACS software35 with the GROMOS96 43a1 force field. The two structural models were individually solvated with the single point charge (SPC) water model36 in cubic boxes with a solute-wall minimum distance of 14 Å. After a first steepest descent energy minimization with positional restraints on the solute, 5Cl− and 4Na+ were added, respectively, in the 1IC6 and 1SH7 systems to neutralize the overall system charge, leading to a total of 52![[thin space (1/6-em)]](https://www.rsc.org/images/entities/char_2009.gif) 118 and 59
118 and 59![[thin space (1/6-em)]](https://www.rsc.org/images/entities/char_2009.gif) 902 atoms for these two systems. The systems were subjected to second energy minimization until no significant energy change could be detected. Then, the systems were simulated by four successive 200 ps position-restrained dynamics runs with decreasing harmonic positional restraint force constants on the solutes (Kposres = 1000, 100, 10 and 0 kJ mol−1 nm−2). The production MD simulations were performed for 40 ns on a Linux cluster with 40 colony-forming units (CPUs) used.
902 atoms for these two systems. The systems were subjected to second energy minimization until no significant energy change could be detected. Then, the systems were simulated by four successive 200 ps position-restrained dynamics runs with decreasing harmonic positional restraint force constants on the solutes (Kposres = 1000, 100, 10 and 0 kJ mol−1 nm−2). The production MD simulations were performed for 40 ns on a Linux cluster with 40 colony-forming units (CPUs) used.
The following MD protocols were used: the integration time step was 2 fs; center-of-mass motion was removed every single time step; non-bonded pairs were updated every 10 time steps; electrostatic interactions were treated with a particle mesh Ewald (PME) summation algorithm37 with an interpolation order of 4, Fourier grid spacing of 0.135 nm and Coulomb radius of 1.0 nm; the van der Waals (VDW) interaction cut-off radius was 1.4 nm; protein and non-protein (solvent and counter-ion) components were independently coupled to a 300 K heat bath for 1IC6 and a 283 K heat bath for 1SH7 with a coupling constant τ_t of 0.1 ps; the pressure was maintained by weakly coupling the system to an external pressure bath at 1 atm with a coupling constant τ_p of 0.5 ps;38 velocities were generated randomly at startup from a Maxwell distribution corresponding to 300 K; LINCS algorithm39 with order 4 was used to constrain the bond lengths to their equilibrium positions; the structural coordinates were saved every 10 ps.
2.3 Geometrical properties
The geometrical properties of the 1IC6 and 1SH7 structures during MD simulations, such as the number of hydrogen bonds (NHB), solvent accessible surface area (SASA), number of native contacts (NNC), and radius of gyration (Rg), were calculated using the programs g_hbond, g_sas, g_mindist and g_gyrate within GROMACS, respectively.2.4 Essential dynamics (ED)
ED40,41 or, equivalently, principal component analysis (PCA) in mathematics, is a powerful tool for filtering large-scale concerted motions from a structural ensemble. After diagonalization of the covariance matrix built from atomic fluctuations in a trajectory, a set of eigenvectors and corresponding eigenvalues were obtained. The eigenvectors are directions in conformational space and represent the collective motions of atoms along those directions. The eigenvalues represent the mean square fluctuations (MSF) of atoms along corresponding eigenvectors. It has been shown that the first few eigenvectors define an essential conformational subspace within which the most significant large concerted motions (or the major motion modes) take place.42 The covariance matrices of Cα atoms for the 1IC6 and 1SH7 MD trajectories were built and diagonalized using the program g_covar within GROMACS software. The projections of trajectories onto the eigenvectors were performed using the g_anaeig program within GROMACS.Combined ED is a useful method for comparing the ED properties of two simulations on similar systems.43 In the present study, combined ED analysis was performed on a trajectory constructed through concatenating the 1IC6 and 1SH7 MD trajectories. Analysis and comparison of the properties (i.e., the projection distribution/average value and mean square displacement (MSD)) of different parts of the projection along the combined eigenvector provide a powerful way for evaluating similarities and differences in equilibrium fluctuations (or average structures) and dynamics between these two forms of serine protease.
2.5 PTMetaD-WTE simulation
To reconstruct the FEL of the mesophilic and psychrophilic serine protease, MetaD simulations44 combined with the parallel tempering (PT) scheme were performed in the well-tempered ensemble (WTE) on 1IC6 and 1SH7. It is widely accepted that a PTMetaD-WTE simulation can compensate for the weaknesses of both PT and MetaD. For detailed description of PTMetaD-WTE, readers can refer to the study of Papaleo et al.45 and Barducci et al.46In the present study, the final snapshots of the standard MD simulations were used as the initial conformations of PTMetaD-WTE. We used eight replicas (at 300, 312, 325, 332, 337, 342, 352 and 360 K) in each of which a 100 ns well-tempered MetaD simulation was performed, leading to total trajectory of 0.8 μs for 1IC6 or 1SH7. The simulations were performed using GROMACS software augmented with Plumed software.47 The force field used in each simulation system was Amber99SB*-ILDN.48
With regard to the principal parameters used in the PTMetaD-WTE simulations, the initial Gaussian height was 3 kJ mol−1 and was added every 1 ps, the Gaussian width was 500, and the bias factor was set to 50. Other simulation parameters and conditions were the same as those used for in the standard MD simulation.
3. Results
3.1 Structural stability check during simulations
The fluctuation equilibrium and structural stability of the 1IC6 and 1SH7 during MD simulations were examined by monitoring the backbone root mean square standard deviation (RMSD) with respect to their starting structures as a function of simulation time. The RMSD curves of 1IC6 and 1SH7 (black lines) showed a steady increase during the first 10 ns (Fig. 2). Afterwards, these two curves exhibited a relatively stable fluctuation with the fluctuation amplitude being less than ≈0.05 nm, suggesting that our MD simulations reach equilibrium after ≈10 ns.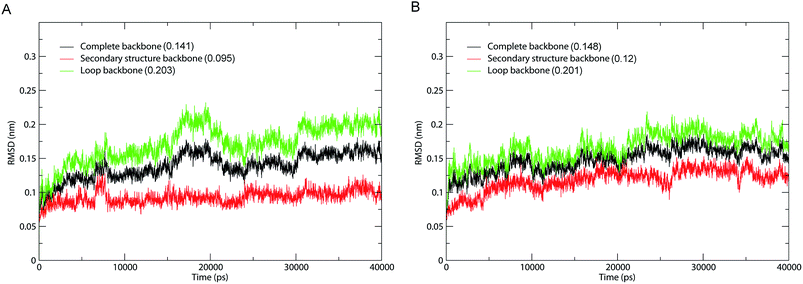 | ||
| Fig. 2 Time evolution of backbone RMSD values with respect to the starting structure during MD simulations. (A) 1IC6. (B) 1SH7. Black, red, and green lines indicate the RMSD of the complete backbone, secondary structure backbone, and loop backbone, respectively. The average RMSD value is indicated in parentheses. | ||
To investigate the contribution of external loops to the overall structural deviation, we calculated the backbone RMSD of the loops and secondary structure elements of 1IC6 and 1SH7 during simulations. Interestingly, for 1IC6 and 1SH7 structures, the “loop backbone” (backbone of the loop), “complete backbone” (backbone of all residues) and “secondary structure backbone” (backbone of the secondary structure elements) showed the largest, moderate, and lowest RMSD values, respectively. This finding indicated that the conformational fluctuations originated mainly from the loops linking the secondary structure elements (Fig. 2, red and green lines). Considering the stability of 1IC6 and 1SH7 structures during the simulations, we finally selected the 30–40 ns parts as the equilibrium trajectories of these two simulation systems for further analyses of structural properties and ED.
3.2 Geometrical properties
Various geometrical properties, including NHB, SASA, NNC, and Rg, were calculated from the equilibrium MD trajectories using default parameters. Table 1 lists the comparison between the average values and standard deviations of these geometrical properties. These properties were very similar because only minor differences were observed in their average values. However, subtle changes in some geometrical properties can still reflect the differences of 1IC6 and 1SH7 during simulation. For example, the 1IC6 possessed more NHB and NNC than 1SH7, indicating a greater number of inter-atomic interactions, contacts and regular structural elements in 1IC6 than in 1SH7. When compared with 1SH7, the reduced Rg reflected more compact packing of 1IC6. There were no clear differences between 1IC6 and 1SH7 in terms of solvent-accessible surface in our simulation. These results indicate that 1IC6 was, on average, in a more compact and stable state than 1SH7.| NHBa | SASAb (Å2) | NNCc | Rgd (Å) | RMSDe (Å) | |||
|---|---|---|---|---|---|---|---|
| All bbf | SS bbg | Loop bbh | |||||
| a Number of hydrogen bonds. A hydrogen bond is considered to exist if the donor–hydrogen–acceptor angle is >120° and the donor–acceptor distance is <3.5 Å.b Total solvent-accessible surface area.c Number of native contacts. A native contact is considered to exist if the distance between two atoms is <6 Å.d Radius of gyration.e RMSD relative to respective starting structures. RMSD values were calculated through superposition on the backbone elements in the starting structures.f Backbone RMSD values of all residues.g Backbone RMSD values of secondary structure elements.h Backbone RMSD values of loop regions. | |||||||
| 1IC6 | 214(7) | 10![[thin space (1/6-em)]](https://www.rsc.org/images/entities/char_2009.gif) 903(196) 903(196) |
135![[thin space (1/6-em)]](https://www.rsc.org/images/entities/char_2009.gif) 066(827) 066(827) |
166.3(0.48) | 1.41(0.19) | 0.95(0.1) | 2.03(0.2) |
| 1SH7 | 210(7) | 10![[thin space (1/6-em)]](https://www.rsc.org/images/entities/char_2009.gif) 677(152) 677(152) |
133![[thin space (1/6-em)]](https://www.rsc.org/images/entities/char_2009.gif) 903(753) 903(753) |
167(0.44) | 1.48(0.17) | 1.2(0.16) | 2.01(0.21) |
In addition, we computed the number of dynamic HBs (total number of HBs formed in the simulation). There were 942 and 962 HBs in the 1IC6 and 1SH7 MD simulation, and the average HB persistency (i.e. average HB stability) were 20.39% and 18.63% respectively. This result suggests that the number of HBs and their persistency has been optimized to improve the conformational flexibility during cold adaptation of serine protease. We also computed the dynamic HBs between protein and water molecules, the total HB number and the average HB persistency are 138845, 0.241% and 146992, 0.241% for 1IC6 and 1SH7, respectively.
3.3 Comparison of structural flexibility
To evaluate and compare the structural flexibility between 1IC6 and 1SH7, per-residue backbone average root mean square fluctuation (RMSF) values were computed from MD trajectories. Fig. 3 shows the comparison of RMSF profiles constructed on the basis of structure–structure alignments obtained with Dali (ESI Fig. S1†)49 and three-dimensional (3D) backbone representations colored according to RMSF values. The common high-flexibility regions for 1IC6 and 1SH7, which were arbitrarily defined as those with RMSF >0.1 nm, were observed in surface-exposed loops, N- and C-termini, and the beginning or end of SSEs (secondary structure elements) (Fig. 3A). On the contrary, the core regions of 1IC6 and 1SH7 had lower RMSF values, which can be observed more intuitively in Fig. 3B and C. Close examination of Fig. 3 reveals that 1SH7 did not feature overall higher flexibility with respect to 1IC6. The regions with higher RMSF in 1SH7 than in 1IC6 included residues 97–112, 132–151, 154–166, 170–179, and 186–218 (the residue number here and in the following analysis was numbered according to the 1IC6 structure). Of these, some residues in segment 97–112 formed S3 and part of S4 substrate-binding pockets; region 132–151 was part of S1 and S4; region 154–166 was part of S1. The regions with higher RMSF in 1IC6 than in 1SH7 included residues 10–24, 149–153 and 240–279. These regions were located mainly on the N- and C-termini, and their high RMSF value may have resulted from the sequence insertions/deletions in the structure alignment. Of these, segment 10–24 included α1, β2 and the loop connecting them; segment 149–153 was the loop connecting α4 and β8 and was located in the opposite direction of substrate-binding site 132–136; segment 240–279 included β14, β15, α6 and the loop connecting it with α5 (240–246). In addition, there was no significant RMSF difference in the core regions of 1IC6 and 1SH7. The RMSF differences of the catalytic triads of these two forms of proteinase K were minute. The values for D39, H69, and S224 were 0.0431, 0.0496, and 0.0562 nm in 1IC6 and, for D37, H70, and S220, they were 0.0447, 0.0508, and 0.0547 nm in 1SH7, respectively.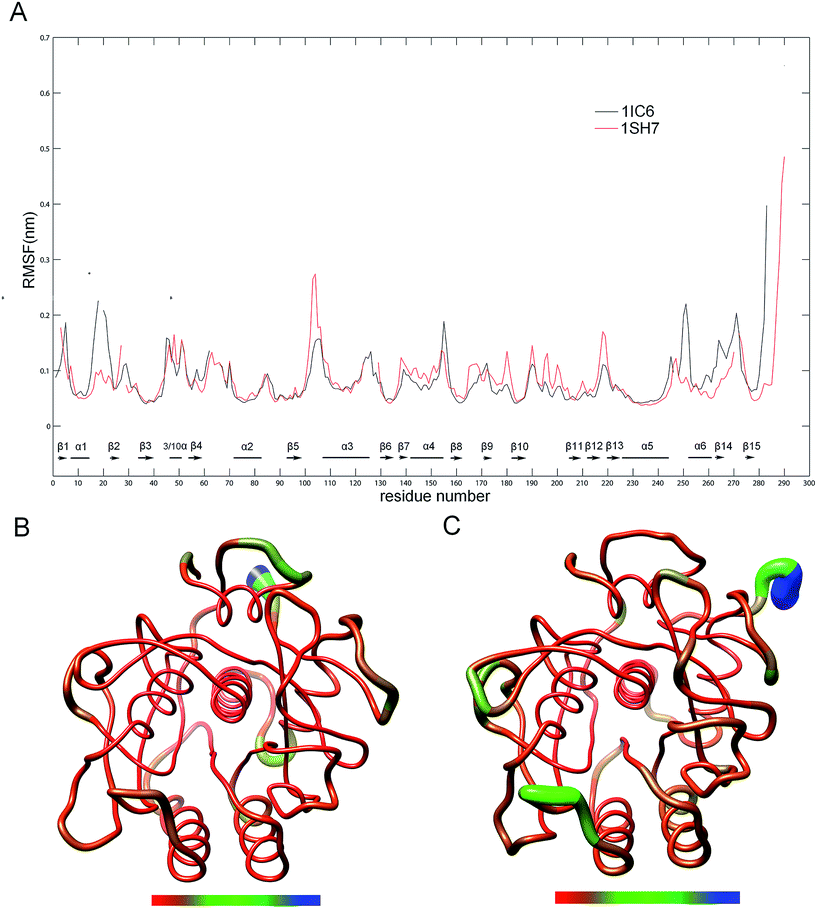 | ||
| Fig. 3 Comparison between the structural flexibility of 1IC6 and 1SH7. (A) Per-residue average backbone RMSF profiles calculated from MD trajectories of 1IC6 (black line) and 1SH7 (red line). The gap of the curves corresponds to the insertion or deletion in the structural alignment, and SSEs were marked according to the 1IC6 structure. The residues are numbered according to the 1IC6 structure. (B) and (C) are 3D backbone representations of 1IC6 and 1SH7 structures mapped with per-residue average backbone RMSF values, respectively. The backbone color ranges from red to blue and corresponds to a line from thin to thick, and denotes that the backbone RMSF varies from the lowest to the highest values. (B) and (C) were generated using UCSF Chimera. | ||
3.4 ED analyses
ED analyses of MD trajectories of 1IC6 and 1SH7 structures revealed that only a few eigenvectors possessed significant eigenvalues (Fig. 4). Diagonalization of the covariance matrices revealed total mean square fluctuation (TMSF) values of 1.63 and 1.85 nm2 for 1IC6 and 1SH7, respectively, suggesting that 1SH7 experienced a larger magnitude of fluctuation during simulation. In particular, each of the first 5 eigenvectors had a larger eigenvalue in the 1SH7 simulation than in the 1IC6 simulation (Fig. 4), reflecting larger fluctuations of 1SH7 along each of the first few eigenvectors. In addition, for the 1IC6 and 1SH7 trajectories, the first 30 eigenvectors contributed 66.2% and 73.8% of the total TMSF (see Fig. 4, inset), respectively. Therefore, most of the internal motions of proteinase K were confined within a subspace of very small dimensions.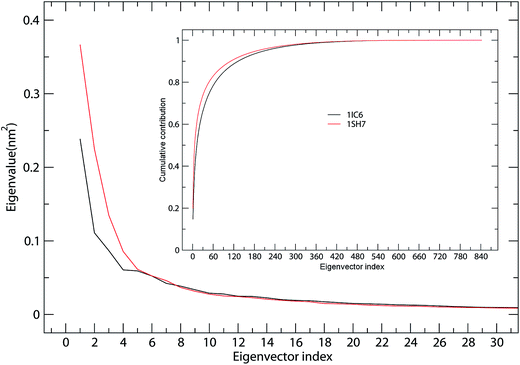 | ||
| Fig. 4 Eigenvalues for 1IC6 and 1SH7 structures as a function of eigenvectors. The main plot shows the eigenvalues of only the first 30 eigenvectors. The inset shows the cumulative contribution of all eigenvectors to the total MSF. 1IC6: black line; 1SH7: red line. | ||
Fig. 5 shows the projection extremes of the first eigenvector of 1IC6 and 1SH7. Here, we focused mainly on the differences in large concerted motions in relation to cold-adaptation. For the motion details of proteinase K, readers could refer to the study of Liu et al.42 who found that the large concerted motions of 1IC6 and 1SH7 originated mainly from displacements of the surface-exposed loops or N- and C-termini. These regions often located near or opposite the active site. Upon comparison, 1SH7 had a relatively larger displacement than 1IC6 in these regions of the structure, as visualized by Fig. 5. These regions mainly included residues 66–68, 95–99, 121–125, 160–169, 184–192, 211–217, and 221–224. Of these regions, segment 95–99 preceded the substrate-binding site 100–104; segment 121–125 was located between the α3 that follows segment 100–104 and the β4 that precedes segment 132–136; segment 160–169 was part of the substrate-binding pocket S1; segment 184–192 followed segment 160–169 through β10; segment 211–217 preceded segment 221–224, the end of which the catalytic residue Ser224 was located through β13. These regions almost neighbored or were located above or below the substrate-binding site through connection of a secondary structure, which had a relatively smaller displacement. As studied by Liu et al.,42 large concerted motions in regions opposite substrate-binding sites can mediate or modulate conformational changes in substrate-binding regions. In conclusion, the relatively larger displacement of these residues may be related to cold-adaption. For the substrate-binding site (100–104 and 132–136), significantly enhanced displacement was not observed in segment 100–104, but segment 132–136 had a larger displacement in 1SH7 than in 1IC6. When considering the catalytic triad residues, Asp39 and His69 had a small displacement in 1IC6 and 1SH7, and this was probably caused by a strong electrostatic interaction between them. Ser224 had a much larger displacement in the 1SH7 structure than in the 1IC6 structure due to the large displacement of neighboring residues 221–224 and 214–216.
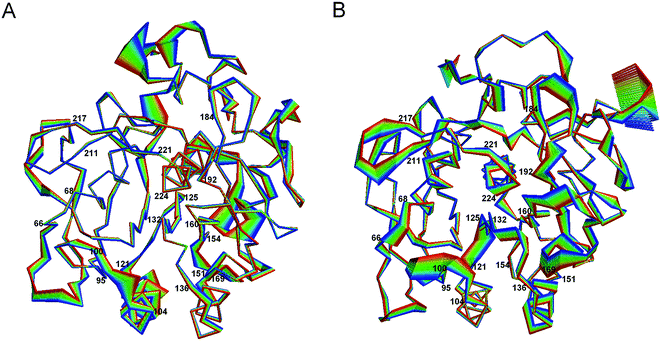 | ||
| Fig. 5 Large concerted motions of 1IC6 (A) and 1SH7 (B) described by eigenvector 1. The linear interpolations between the two extremes extracted from projection of the trajectory onto the eigenvectors are colored from blue to red to highlight the structural differences between the two states, but do not represent the transition pathway. | ||
Residues having a larger displacement in 1IC6 than in the 1SH7 included segments 151–154 and 240–246. Of these segments, 151–154 was linked to segment 132–136 through helix α4, and the latter showed only a small fluctuation. We inferred that the larger displacement of segment 151–154 could influence the motion of 132–136 to have a closing effect of the substrate-binding pockets S1 and S4, but this was not obvious in the 1SH7 structure. The relatively spacious pocket in 1SH7 may favor substrate-binding efficiency and cold-adaption.
Combined ED analyses were performed using the 30–40 ns trajectories of the 1IC6 and 1SH7 structures. Fig. 6 shows the projections of merged trajectories onto the combined eigenvectors as well as the properties of these projections. The eigenvector projection provided information about time-dependent conformational changes. The differences in projection distribution/average value and MSD provided information about differences in large concerted motions/equilibrium states and in dynamics, respectively. Only in the case of the first eigenvector could the projection be found with significantly different distributions and average value (Fig. 6A and B). This indicated obviously different large concerted motions or equilibrium states between these two forms of proteinase K along the combined eigenvector 1.
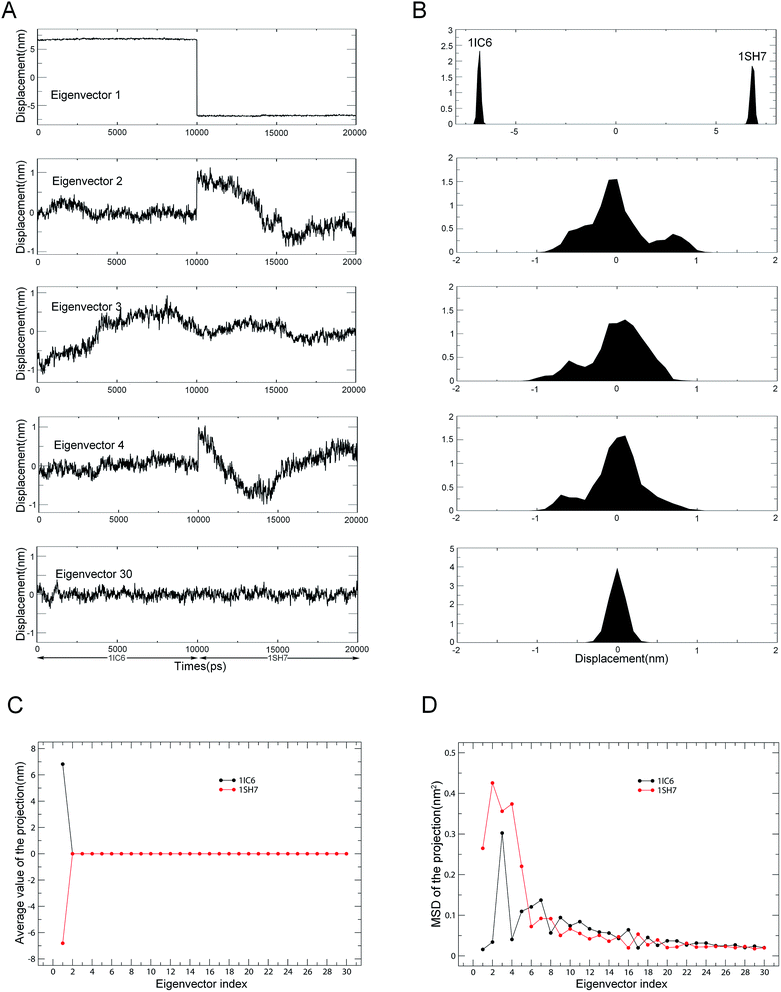 | ||
| Fig. 6 Properties of the projections of the merged trajectory onto combined eigenvectors. (A) Projections of the merged trajectory (1IC6: 0–10 ns; 1SH7: 11–20 ns) onto the first four combined eigenvectors. (B) Distributions of these four projections. Distinct distribution can be found only in the projection along eigenvector 1. (C) Average values of projections of the first 30 eigenvectors as a function of the eigenvector index. (D) MSDs of projections of the first 30 eigenvectors as a function of the eigenvector index. The average value and MSD of the projection along a combined eigenvector were calculated separately for two equal halves of the projection that represent 1IC6 and 1SH7, respectively. | ||
The second, third and fourth combined eigenvector projections demonstrated a gradually increasing degree of overlap between the two halves of the projections. This suggested the gradually increasing similarity in concerted motions between these two forms of proteinase K, and this could also be reflected by the projection average values shown in Fig. 6C. Fig. 6D shows the MSDs of the projections, which could be used to investigate the difference in protein dynamics/flexibility between 1IC6 and 1SH7 during simulation. As shown in Fig. 6D, the overall trends of the two curves were similar, with the third eigenvector of 1IC6 and the second eigenvector of 1SH7 having the largest MSD values, indicating that the most significant conformational shift/diffusion occurred in these two subspaces. Nevertheless, the first five eigenvectors exhibited a strikingly higher MSD value for 1SH7 than for 1IC6. Together with the minor difference in MSD values of other eigenvectors, these results indicated that the 1SH7 structure experienced a larger conformational shift (or had greater higher flexibility) than the 1IC6 structure in conformational space. These data were in agreement with the results of structural-property analyses detailed above.
3.5 Free-energy calculations
The FEL values of 1IC6 and 1SH7 were constructed using the projections of their own first (PC1) and second (PC2) eigenvectors, given as CV1 and CV2, respectively, in the PTMetaD-WTE simulation. These two eigenvectors spanned an essential subspace contributing ≈35% to the total MSF within the conformation space sampled by the standard MD simulation. Fig. 7A and B show the FEL values for 1IC6 and 1SH7, respectively. For the 1IC6 structure, there was only one main free-energy well/basin in the global free energy minimum region, indicating only one stable conformational state resided within this well. In the 1SH7 structure, there were three main free-energy wells in the global free energy minimum region. A comparison between the full view of the FEL values of these two forms of proteinase K revealed that the FEL of 1SH7 spanned larger ranges of PC1 and PC2 and exhibited a more rugged free-energy surface than 1IC6. In addition, the FEL of 1SH7 contained a greater number of local free-energy minima.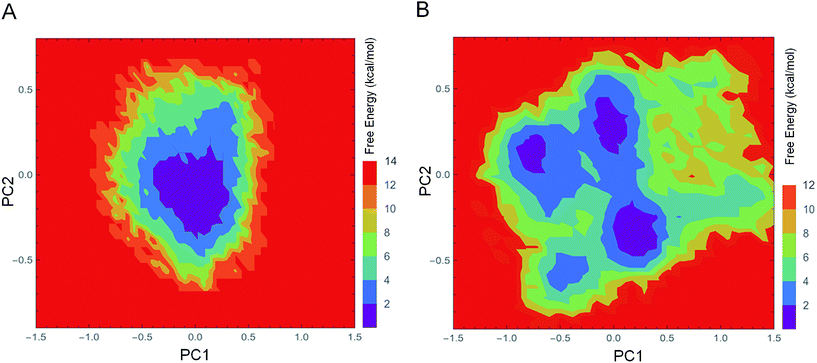 | ||
| Fig. 7 FEL values of 1IC6 and 1SH7. (A) 1IC6. (B) 1SH7. The FEL values are constructed as a function of projections of the MD trajectory onto their own first (PC1) and second (PC2) eigenvectors, respectively. The color bar represents the relative free-energy value in kcal mol−1. | ||
Evaluation of the exchange efficiency, convergence and temperature ergodicity of PTMetaD-WTE simulation are shown in ESI Fig. S2–4.† The FEL values and free-energy profiles constructed from our PTMetaD-WTE simulations may have been incomplete due to the limited sampling time. However, such free-energy calculations are still useful for characterizing the differences in thermodynamics and kinetics between these two forms of proteinase K.
4. Discussion
Although the static structures of psychrophilic enzymes and their homologous mesophilic counterparts provide invaluable insights into the cold-adaption of various enzyme families, the physicochemical bases for enzyme cold-adaptation remain unknown. To explore the protein flexibility, molecular motion, thermodynamics and kinetics in relation to cold-adaption, we performed 40 ns standard MD and 800 ns MetaD simulations on mesophilic and psychrophilic proteinase K. Comparative analyses of RMSD, RMSF, geometrical properties and ED suggested that mesophilic proteinase K assumes a relatively more compact and stable conformational state than that of psychrophilic proteinase K during simulation.Flexibility plays an important part in protein function. For an enzyme, conformational flexibility is fundamental for its ability to adopt various conformations during catalytic processes, and local conformational flexibility in regions involved in the catalysis is crucial for substrate degradation.20,50,51 It is widely accepted that psychrophilic enzymes are often characterized by enhanced flexibility of the whole structure or distinct regions, which could be favor their cold-adaption.52,53 In the present study, we performed MD simulations on the same two proteins used by Tiberti et al.20 They found that psychrophilic proteinase K did not feature an overall higher flexibility with respect to the mesophilic form, but that regions near the substrate-binding cleft or around calcium-binding sites showed enhanced flexibility. Our study is in good agreement with that of Tiberti et al. and, apart from the crucial functional regions studied by Tiberti et al., regions not directly involved in catalysis but close or opposite to functional sites also showed enhanced flexibility. Our ED analyses also showed differences in large concerted motions of psychrophilic and mesophilic proteinase K. Although the large concerted motions of these two forms of proteinase K originated mainly from displacements of the surface-exposed loops which were often near or opposite the active site, psychrophilic proteinase K had a relatively larger displacement than mesophilic proteinase K in these regions. As studied by Liu et al.,42 the large concerted motions of regions near or opposite substrate-binding regions can affect or mediate the opening/closing of substrate-binding pockets. Therefore, the higher flexibility and larger displacement of psychrophilic proteinase K could enhance enzyme activity in low-temperature conditions through acceleration of absorption and release of its substrate.16
To explore the physicochemical bases for enzyme cold-adaptation, we constructed the FELs of psychrophilic and mesophilic proteinase K using PTMetaD-WTE simulation. Psychrophilic proteinase K had a larger, more “rugged” and complex free-energy surface than mesophilic proteinase K. These features would mean that the psychrophilic form had more conformational sub-states, richer conformational diversity, and more complex dynamic behavior than mesophilic proteinase K. The difference in FEL between these two types of proteinase K could be related to their conformational flexibility, which is determined by the number of dynamic HBs and their persistency.54 For example, the increased number of dynamic HBs and shorter persistency make the FEL of 1SH7 have more local energy minima and thus a wider funnel. Our results are in good agreement with those of Feller et al.,19 which suggested a “folding funnel” model for psychrophilic and thermophilic enzymes.
Together with the result of our dynamic study and previous static structural comparison of these two forms of proteinase K, we can provide an interpretation of enzyme cold-adaption based on FEL theory. That is, although the 3D structure of these two forms of serine proteinase K is very similar, the difference in their amino-acid composition could make them undergo different interactions with water molecules. For example, psychrophilic proteinase K is characterized by increased hydrophobicity on its surface as well as a greater number and longer surface-exposed loops, which make it more valuable for collision with water molecules. The solvent has an essential role in protein dynamics,55–57 so enhanced interactions with water molecules will cause psychrophilic proteinase K to have more fluctuations compared with mesophilic proteinase K, especially in certain specific regions of the active site. The enhanced flexibility of psychrophilic proteinase K could increase its conformational diversity, which is reflected by its more rugged FEL.
In conclusion, we suggest that the enhanced interaction with water molecules leads to the increased flexibility of some local regions of psychrophilic proteinase K. This phenomenon gives it higher catalytic efficiency than that of mesophilic proteinase K in a low-temperature environment.
Conflict of interests
The authors declare no conflicts of interest for this work.Acknowledgements
This work was supported by the National Natural Science Foundation of China (31370715, 31160181, 31660015 and 81560075), the National Basic Research Program of China (2013CB127500), and the Program for Excellent Young Talents, Yunnan University, China (XT412003).References
- G. Feller, Scientifica, 2013, 512840 Search PubMed.
- A. M. Gounot, J. Appl. Microbiol., 1991, 71, 386–397 CrossRef CAS PubMed.
- R. Cavicchioli, Nat. Rev. Microbiol., 2006, 4, 331–343 CrossRef CAS PubMed.
- R. M. Morgan-Kiss, J. C. Priscu, T. Pocock, L. Gudynaite-Savitch and N. P. Huner, Microbiol. Mol. Biol. Rev., 2006, 70, 222–252 CrossRef CAS PubMed.
- P. Buzzini, E. Branda, M. Goretti and B. Turchetti, FEMS Microbiol. Ecol., 2012, 82, 217–241 CrossRef CAS PubMed.
- R. Margesin, G. Neuner and K. Storey, Sci. Nat., 2007, 94, 77–99 CrossRef CAS PubMed.
- D. Doucet, V. Walker and W. Qin, Cell. Mol. Life Sci., 2009, 66, 1404–1418 CrossRef CAS PubMed.
- G. Haki and S. Rakshit, Bioresour. Technol., 2003, 89, 17–34 CrossRef CAS PubMed.
- B. Van Den Burg, Curr. Opin. Microbiol., 2003, 6, 213–218 CrossRef CAS PubMed.
- E. Papaleo, M. Pasi, L. Riccardi, I. Sambi, P. Fantucci and L. D. Gioia, FEBS Lett., 2008, 582, 1008–1018 CrossRef CAS PubMed.
- E. Papaleo, M. Olufsen, L. De Gioia and B. O. Brandsdal, J. Mol. Graphics Modell., 2007, 26, 93–103 CrossRef CAS PubMed.
- V. Spiwok, P. Lipovová, T. Skálová, J. Dušková, J. Dohnálek, J. Hašek, N. J. Russell and B. Králová, J. Mol. Model., 2007, 13, 485–497 CrossRef CAS PubMed.
- R. Martinez, U. Schwaneberg and D. Roccatano, Protein Eng., Des. Sel., 2011, 24, 533–544 CrossRef CAS PubMed.
- K. R. Óskarsson, M. Nygaard, B. Ö. Ellertsson, S. H. Thorbjarnardottir, E. Papaleo and M. M. Kristjánsson, Biochim. Biophys. Acta, Proteins Proteomics, 2016, 1864, 1436–1443 CrossRef PubMed.
- Á. R. Sigtryggsdóttir, E. Papaleo, S. H. Thorbjarnardóttir and M. M. Kristjánsson, Biochim. Biophys. Acta, Proteins Proteomics, 2014, 1844, 705–712 CrossRef PubMed.
- M. Pasi, L. Riccardi, P. Fantucci, L. De Gioia and E. Papaleo, J. Phys. Chem. B, 2009, 113, 13585–13595 CrossRef CAS PubMed.
- D. Georlette, V. Blaise, T. Collins, S. D'Amico, E. Gratia, A. Hoyoux, J. C. Marx, G. Sonan, G. Feller and C. Gerday, FEMS Microbiol. Rev., 2004, 28, 25–42 CrossRef CAS PubMed.
- R. Jaenicke and G. Böhm, Curr. Opin. Struct. Biol., 1998, 8, 738–748 CrossRef CAS PubMed.
- S. D'Amico, J. C. Marx, C. Gerday and G. Feller, J. Biol. Chem., 2003, 278, 7891–7896 CrossRef PubMed.
- M. Tiberti and E. Papaleo, J. Struct. Biol., 2011, 174, 69–83 CrossRef CAS PubMed.
- L. Q. Yang, P. Sang, Y. Tao, Y. X. Fu, K. Q. Zhang, Y. H. Xie and S. Q. Liu, J. Biomol. Struct. Dyn., 2014, 32, 372–393 CAS.
- K. Henzler-Wildman and D. Kern, Nature, 2007, 450, 964–972 CrossRef CAS PubMed.
- S. Q. Liu, X. L. Ji, Y. Tao, D. Y. Tan, K. Q. Zhang and Y. X. Fu, Protein Eng., 2012, 207–252 CAS.
- A. V. Finkelstein and O. Ptitsyn, Protein physics: a course of lectures, Academic Press, 2002 Search PubMed.
- C. Mattos, Trends Biochem. Sci., 2002, 27, 203–208 CrossRef CAS PubMed.
- J. Arnórsdóttir, M. M. Kristjánsson and R. Ficner, FEBS J., 2005, 272, 832–845 CrossRef PubMed.
- L. Hedstrom, Chem. Rev., 2002, 102, 4501–4524 CrossRef CAS PubMed.
- J. Silvestre-Ryan, Y. Lin and J. W. Chu, PLoS Comput. Biol., 2011, 7, e1002023 CAS.
- H. Abdizadeh, G. Guven, A. R. Atilgan and C. Atilgan, J. Enzyme Inhib. Med. Chem., 2015, 30, 867–873 CrossRef CAS PubMed.
- L. B. Jónsdóttir, B. Ö. Ellertsson, G. Invernizzi, M. Magnúsdóttir, S. H. Thorbjarnardóttir, E. Papaleo and M. M. Kristjánsson, Biochim. Biophys. Acta, Proteins Proteomics, 2014, 1844, 2174–2181 CrossRef PubMed.
- C. Betzel, S. Gourinath, P. Kumar, P. Kaur, M. Perbandt, S. Eschenburg and T. P. Singh, Biochemistry, 2001, 40, 3080–3088 CrossRef CAS PubMed.
- W. Wolf, J. Bajorath, A. Müller, S. Raghunathan, T. P. Singh, W. Hinrichs and W. Saenger, J. Biol. Chem., 1991, 266, 17695–17699 CAS.
- A. Laio and F. L. Gervasio, Rep. Prog. Phys., 2008, 71, 126601 CrossRef.
- A. Laio and M. Parrinello, Proc. Natl. Acad. Sci. U. S. A., 2002, 99, 12562–12566 CrossRef CAS PubMed.
- B. Hess, C. Kutzner, D. Van Der Spoel and E. Lindahl, J. Chem. Theory Comput., 2008, 4, 435–447 CrossRef CAS PubMed.
- H. Berendsen, J. Postma, W. Van Gunsteren and J. Hermans, Intermol. Forces, 1981, 11, 331–342 Search PubMed.
- T. Darden, D. York and L. Pedersen, J. Chem. Phys., 1993, 98, 10089 CrossRef CAS.
- H. J. Berendsen, J. P. M. Postma, W. F. van Gunsteren, A. DiNola and J. Haak, J. Chem. Phys., 1984, 81, 3684 CrossRef CAS.
- B. Hess, H. Bekker, H. J. Berendsen and J. G. Fraaije, J. Comput. Chem., 1997, 18, 1463–1472 CrossRef CAS.
- A. Amadei, A. B. Linssen and H. J. Berendsen, Proteins: Struct., Funct., Genet., 1993, 17, 412–425 CrossRef CAS PubMed.
- M. A. Balsera, W. Wriggers, Y. Oono and K. Schulten, J. Phys. Chem. B, 1996, 100, 2567–2572 CrossRef CAS.
- S. Q. Liu, Z. H. Meng, Y. X. Fu and K. Q. Zhang, J. Mol. Model., 2010, 16, 17–28 CrossRef CAS PubMed.
- D. Van Aalten, A. Amadei, A. Linssen, V. Eijsink, G. Vriend and H. Berendsen, Proteins: Struct., Funct., Genet., 1995, 22, 45–54 CrossRef CAS PubMed.
- A. Barducci, G. Bussi and M. Parrinello, Phys. Rev. Lett., 2008, 100, 020603 CrossRef PubMed.
- E. Papaleo, L. Sutto, F. L. Gervasio and K. Lindorff-Larsen, J. Chem. Theory Comput., 2014, 10, 4169–4174 CrossRef CAS PubMed.
- A. Barducci, M. Bonomi, M. K. Prakash and M. Parrinello, Proc. Natl. Acad. Sci. U. S. A., 2013, 110, E4708–E4713 CrossRef CAS PubMed.
- M. Bonomi, D. Branduardi, G. Bussi, C. Camilloni, D. Provasi, P. Raiteri, D. Donadio, F. Marinelli, F. Pietrucci and R. A. Broglia, Comput. Phys. Commun., 2009, 180, 1961–1972 CrossRef CAS.
- K. Lindorff-Larsen, S. Piana, K. Palmo, P. Maragakis, J. L. Klepeis, R. O. Dror and D. E. Shaw, Proteins: Struct., Funct., Bioinf., 2010, 78, 1950–1958 CAS.
- L. Holm and P. Rosenström, Nucleic Acids Res., 2010, 38, 545–549 CrossRef PubMed.
- M. Kokkinidis, N. Glykos and V. Fadouloglou, Adv. Protein Chem. Struct. Biol., 2012, 87, 181–218 CAS.
- S. C. Kamerlin and A. Warshel, Proteins: Struct., Funct., Bioinf., 2010, 78, 1339–1375 CAS.
- K. S. Siddiqui and R. Cavicchioli, Annu. Rev. Biochem., 2006, 75, 403–433 CrossRef CAS PubMed.
- P. A. Fields, Comp. Biochem. Physiol., Part A: Mol. Integr. Physiol., 2001, 129, 417–431 CrossRef CAS.
- B. B. Xie, F. Bian, X. L. Chen, H. L. He, J. Guo, X. Gao, Y. X. Zeng, B. Chen, B. C. Zhou and Y. Z. Zhang, J. Biol. Chem., 2009, 284, 9257–9269 CrossRef CAS PubMed.
- P. Sang, Q. Yang, X. Du, N. Yang, L. Q. Yang, X. L. Ji, Y. X. Fu, Z. H. Meng and S. Q. Liu, Int. J. Mol. Sci., 2016, 17, 254 CrossRef PubMed.
- D. Vitkup, D. Ringe, G. A. Petsko and M. Karplus, Nat. Struct. Mol. Biol., 2000, 7, 34–38 CAS.
- P. W. Fenimore, H. Frauenfelder, B. H. McMahon and F. G. Parak, Proc. Natl. Acad. Sci. U. S. A., 2002, 99, 16047–16051 CrossRef CAS PubMed.
Footnotes |
| † Electronic supplementary information (ESI) available. See DOI: 10.1039/c6ra23230b |
| ‡ These authors contributed equally to this work. |
| This journal is © The Royal Society of Chemistry 2017 |
