
 Open Access Article
 This Open Access Article is licensed under a Creative Commons Attribution-Non Commercial 3.0 Unported Licence
Universal substrates based on Ag colloidal particles for routine surface-enhanced Raman scattering spectral measurements†
Hyeokjin Yoon and
Jung Sang Suh*
and
Jung Sang Suh*
Department of Chemistry, Seoul National University, Seoul 08826, Republic of Korea. E-mail: jssuh@snu.ac.kr; Fax: +82-2-875-6636; Tel: +82-2-880-7763
First published on 31st May 2017
Abstract
We developed a method to fabricate sensitive and stable substrates that can be used in routine surface-enhanced Raman scattering (SERS) spectral measurements. The substrates were fabricated by immobilization of Ag colloidal particles on a glass plate coated with poly(4-vinyl pyridine) (P4VP), adsorption of molecules on the immobilized colloidal particles, and second immobilization. In the second step, we adsorbed weakly adsorbed molecules such as aniline instead of target molecules. We purified pristine silver sols by centrifuging to increase the surface charge of the colloidal particles and optimized Ag colloidal particle diameter to achieve high Raman signal enhancement from their dimers. When purified silver sols were used in the immobilizations, dimers were predominantly formed with very few trimers. When target molecular solutions were dropped in arrays on the substrate prepared by adsorbing aniline and dried, a good SERS spectrum was observed from each spot without any peaks of aniline and P4VP. The average enhancement was found to be 1.0 × 10⁷ and the enhancement of the dimers was ∼1.6 × 10⁷. The latter corresponds to the enhancement outside the hotspot regions, since target molecules could not be adsorbed at the junctions after the formation of dimers. About one hundred samples could be tested on the substrate fabricated on a cover glass when target molecular solutions were dropped by using a micropipette. Since dropping and drying are very simple and easy processes, and many samples could be tested on a substrate, our substrates can be used in routine SERS spectral measurements and assays like bioassays.
1. Introduction
The color of silver sols is yellow, while that of gold sols is pink. These distinct colors are due to their localized surface plasmon resonance (LSPR) absorption.1,2 When the frequency of light photons matches the natural frequency of collective oscillation of the conduction electrons of metal nanoparticles (NPs), their LSPRs are excited.3 The Raman signal of the molecules adsorbed on the surface of Ag or Au NPs is enhanced greatly when the LSPR of the NPs is excited by irradiation with light. This phenomenon is known as surface-enhanced Raman scattering (SERS).4 As a result of its high sensitivity, SERS has attracted substantial attention as a probing technique for biosensors.5,6 It is known that the strongest SERS enhancement is attained from the so-called “hotspot” sites, which may be the junctions between two or more closely spaced metal NPs.7–12 The dimer of Ag or Au colloidal particles is surely one of the simplest junction systems. The hotspot area of the dimers is relatively very narrow compared to the total surface area of the dimers, and most prove molecules will be adsorbed on the areas outside the hotspot regions. Therefore, alone the probe molecules adsorbed on the areas outside the hotspot regions could show a fairly good SERS spectrum.Ag colloidal particles are one of the most commonly used SERS substrates.13–15 Their synthesis is relatively simple and they show a very high surface enhancement.16–20 However, controlling their aggregation is difficult.21–23 In 2011, Lee et al.24 of our group developed a three-step immobilization method to fabricate stable clusters of metal colloidal particles. One year late, Lu et al. reported a three-step electroless deposition method.25 This method consists of three steps: immobilization of the colloidal particles on a cover glass coated with poly(4-vinyl pyridine) (P4VP), adsorption of target molecules on the immobilized colloidal particles, and second immobilization. With increasing the second immobilization time, large clusters of Ag colloidal particles such as trimers and tetramers were also formed significantly along with the dimers, and in the extinction spectrum the λmax of the longitudinal LSPR peak was red-shifted. Like increasing the box size in the particle in-a-box models, the energy gap between the successive energy levels decreases with increasing the cluster size, and the λmax of the longitudinal LSPR peak is red-shifted with increasing the cluster size.26 However, a good SERS spectrum was observed from the substrate, with enhancement of ∼1 × 106.24 Herein, we report the usefulness of the substrates prepared by adsorption of weakly adsorbed molecules such as aniline, instead of target molecules, in the second step. By using purified silver sols in the immobilizations, we could form dimers predominantly. Also, we optimized the colloidal particle diameter to achieve high Raman signal enhancement from their dimers. When target molecular solutions were dropped in arrays on the substrate prepared by adsorbing aniline and dried, a good SERS spectrum was observed from each spot without any peaks of aniline and P4VP. When target molecular solutions were dropped by using a micropipette, about one hundred samples could be tested on the substrate fabricated on a cover glass. Since dropping and drying are very simple and easy processes, and many samples could be tested on a substrate, our SERS substrate can be used in routine SERS spectral measurements and assays like bioassays.
2. Experimental section
A seed-mediated process was used to control the diameter of Ag colloidal particles.27 The Ag seed solution was prepared by mixing 0.30 mL of a silver nitrate solution (10 mM) and 20 mL of a trisodium citrate solution (1 mM) and then rapidly injecting 1.8 mL of an ice-cold sodium borohydride (10 mM). The mixture was then stirred vigorously and then allowed to stand at room temperature for 3 h. The diameter of Ag colloidal particles was controlled by varying the volume ratio between Ag seed solution and water. X mL of the Ag seed solution, (20 − X) mL of water, and 1.2 mL of a sodium ascorbate solution (20 mM) were mixed together. To this solution, 1.2 mL of a silver nitrate solution (10 mM) was injected rapidly and then the resulting mixture was stirred vigorously. To remove the ions or molecules present in the silver sols, we centrifuged the silver sols at 13![[thin space (1/6-em)]](https://www.rsc.org/images/entities/char_2009.gif) 500 rpm for 40 min and removed the supernatant by a pipette. The same volume of distilled water was added to the residue left behind and the resulting mixture was then shaken for 1 min.
500 rpm for 40 min and removed the supernatant by a pipette. The same volume of distilled water was added to the residue left behind and the resulting mixture was then shaken for 1 min.
P4VP (0.3 g) was dissolved in ethanol (100 mL). 100 μL of this polymer solution was dropped on a cover glass (2.2 cm × 2.2 cm) and then the glass plate was rotated at 3000 rpm for 1 min. The surface of the cover glass was then washed by dipping it in ethanol several times. The cover glass coated with P4VP was placed in a Petri dish containing 3.0 mL of silver sols to immobilize Ag colloidal particles on it. After immobilization, the surface was washed with ethanol and then the cover glass was dried by blowing nitrogen gas. To adsorb aniline on the immobilized Ag colloidal particles, the cover glass was dipped in a 3.0 mL ethanol solution of aniline (200 nM) for 2 h. After washing the surface with ethanol, the cover glass was again placed in the Petri dish containing the 3.0 mL colloidal solution of Ag for various durations to immobilize more colloidal particles. The surface of the cover glass (SERS substrate) was then washed with ethanol and dried. To adsorb target molecules on the substrate, the substrate was dipped in a 3.0 mL ethanol solution of target molecules (100 nM) for 2 or 24 h or 20 μL ethanol solutions of target molecules (100 nM) were dropped in arrays on the substrate using a micropipette (Scheme 1).
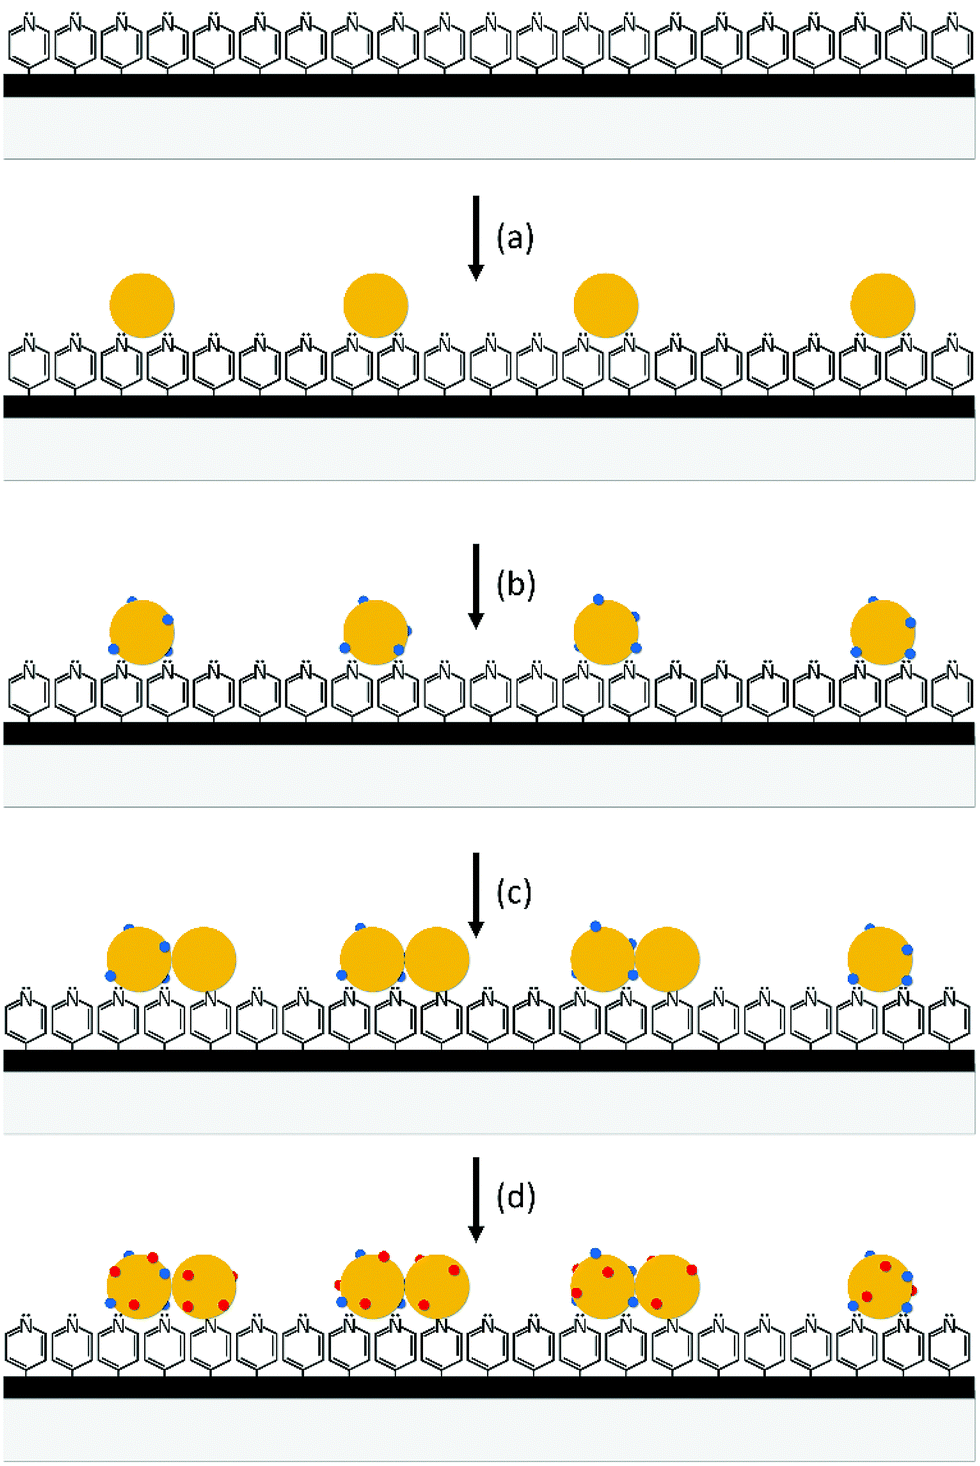 | ||
| Scheme 1 A schematic of the fabrication of universal SERS substrates consisting of dimers of Ag or Au colloidal particles; (a) immobilization of the colloidal particles on a cover glass coated with P4VP, (b) adsorption of weakly adsorbed molecules such as aniline, (c) second immobilization, and (d) adsorption of target molecules by dropping target molecular solutions in arrays on the substrate or dipping the substrate in a target molecular solution. | ||
SERS and normal Raman spectra were observed by using a micro-Raman system equipped with a homemade sample stage, monochromator (SPEX 500 M), and CCD camera cooled with liquid nitrogen (Roger Scientific 7346-001 Model). A 514.5 nm Ar-ion laser line was used as the excitation source. The laser power incident on the sample was approximately 10 μW, and acquisition times of 1 and 10 s were used. The Raman spectrum of liquid benzenethiol was obtained from a sample contained in a capillary (364 μm in diameter). Raman frequencies were corrected by using the Raman peaks of a mixture of toluene and acetonitrile (1:1 v/v). The UV-Vis absorption spectra of Ag colloidal particles immobilized on the cover glass coated with P4VP were obtained by a transmission method. As the reference material, the cover glass coated with P4VP was used. The morphology of the particles was analyzed by using a scanning electron microscope (SEM; JEOL ltd. JSM6700F (10 kV)) and high-resolution transmission electron microscope (HR-TEM; JEOL, JEM-3000F (300 kV)).
3. Results and discussion
Fig. 1 shows the SEM images and UV-Vis extinction spectra of the substrates prepared by the three-step immobilization method and adsorption of aniline in the second step, and the histogram of the number of Ag colloidal clusters counted from the SEM images. The average diameter of Ag colloidal particles was about 28 nm, which showed the highest SERS intensity (see Fig. S1†). The Ag colloidal particles were first immobilized for 10 min on a cover glass coated with P4VP. [The density of Ag colloidal particles immobilized by the first immobilization affected to the density of the dimers formed during the second immobilization step. For a high density of the dimers without forming trimers, the average gap distance between the particles immobilized during the first immobilization should be larger than two times of the diameter of the particles and less than three times. When the first immobilization time was 10 min, the dimers were formed with a high density without forming the trimers significantly]. After immobilizing, the substrate was placed for adsorption of aniline in a 3.0 mL ethanol solution of aniline (200 nM) for 2 h. [The amount of aniline adsorbed on the Ag colloidal particles immobilized was not significantly affected to the formation of the dimers compared to the first immobilization time]. After adsorption aniline, the Ag colloidal particles were immobilized again on the substrate for various times. For both the immobilization steps, we used silver sols purified by centrifuging. After the purification, the ions and molecules present in the pristine colloidal solutions were largely removed, and the surface charge of the colloidal particles was increased significantly. As a result, Ag colloidal particles were immobilized individually without any aggregation during the first immobilization (see Fig. 1a). We believe that no aggregation was due to the increased repulsion force between Ag colloidal particles whose surface charge was increased by purification. For the Ag colloidal particles immobilized in isolation, a single LSPR peak is observed at 390 nm in the extinction spectrum (see Fig. 1e). On the other hand, dimers of Ag colloidal particles were formed predominantly and very few trimers during the second immobilization. The number of the dimers was increased with an increase in the second immobilization time but not linearly. The total number of the monomers and dimers after the second immobilization is larger than that of the monomers after the first one. This is due to that some colloidal particles were adsorbed individually even during the second immobilization. From the SEM images, we can see that the two colloidal particles composing each dimer are in contact with each other. In some cases, they appear to be overlapping. The dimers of Ag colloidal particles showed two LSPR peaks at 380 and 519 nm. The former peak is attributed to the transverse mode, while the latter is attributed to the longitudinal mode.28,29 With an increase in the second immobilization time up to 30 min, the intensity of both the peaks increased without any shift in their extinction peak wavelengths (λmax). It should be mentioned that when pristine silver sols were used in the immobilizations, not all the colloidal particles were immobilized individually during the first immobilization.24 Some dimers were also formed. During the second immobilization, large clusters such as trimers and tetramers were also formed significantly along with the dimers.24 Due to formation of a relatively large number of trimers and tetramers, the λmax at 519 nm red-shifted significantly with an increase in the second immobilization time (see Fig. S2†).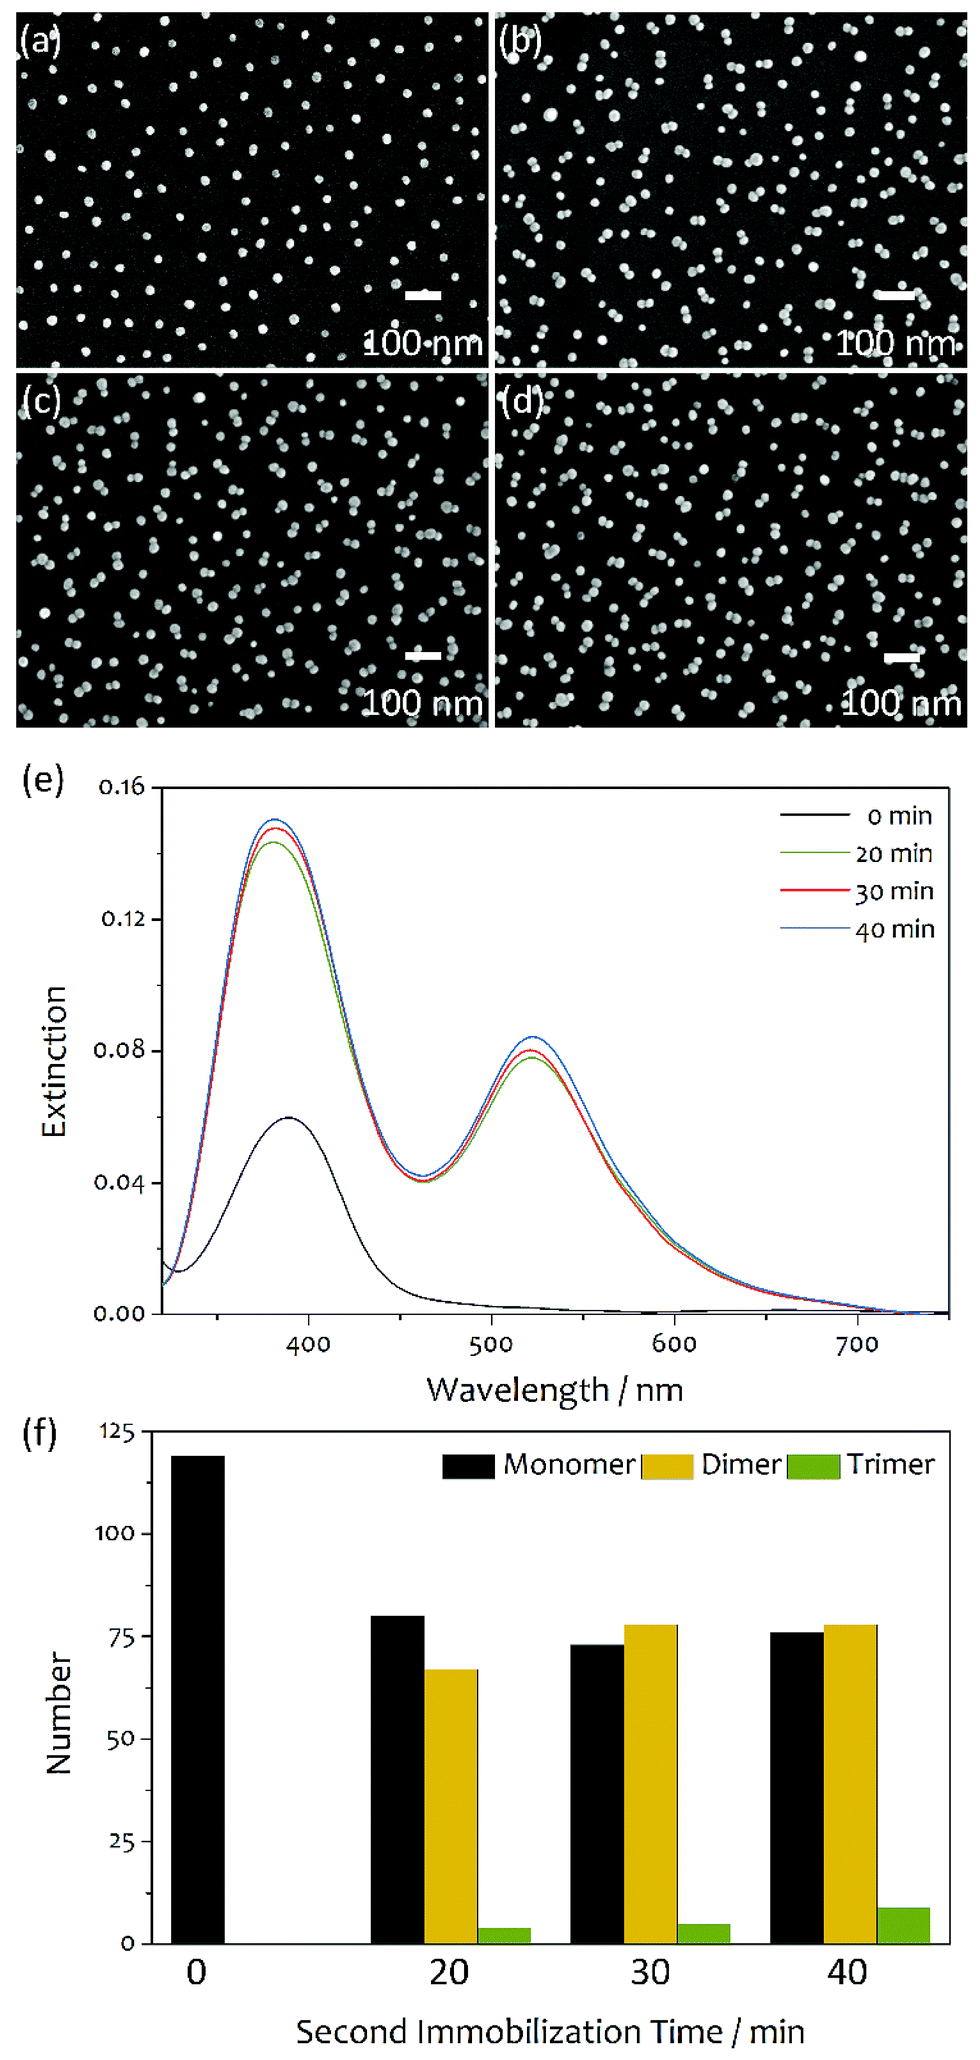 | ||
| Fig. 1 (a–d) SEM images and (e) UV-Vis extinction spectra of substrates prepared by a three-step immobilization method and adsorption of aniline in the second step, and (f) histogram of the number of Ag colloidal clusters counted from the SEM images. The first immobilization time was all the same as 10 min, while the second immobilization times were (a) 0, (b) 20, (c) 30, and (d) 40 min. Purified silver sols whose colloidal particles had 28 nm in average diameter were used in the immobilizations. The legend shows the second immobilization times. | ||
Consider the effect of purification of silver sols to the cluster formation. Silver sols are very stable without formation of precipitation because the colloidal particles have the same kind of surface charge, and hence repel each other. It should be noted that for the fabrication of silver sols used in this study, sodium citrate and silver nitrate were added as a stabilizer and reagent, respectively. In addition, sodium ascorbate and sodium borohydride were added as reducing agents. Therefore, the Ag colloidal particles of silver sols were surrounded by the ions present in the colloidal solutions such as citrate, nitrate, borate, sodium, etc., and their surface charge was reduced significantly. The pristine sols were purified by removing the supernatant obtained after centrifuging them, and then adding the same volume of distilled water to the residue left behind. Consequently, the concentration of the ions present in the colloidal solutions was significantly reduced by purification. Therefore, the net surface charge of the colloidal particles increased and the repulsion force between the colloidal particles increased significantly. There is no doubt that the probability of their aggregation during the immobilization would decrease with an increase in the force of repulsion between the Ag colloidal particles. This is the reason why the Ag colloidal particles in the substrate prepared using purified silver sols were immobilized individually without any formation of clusters (Fig. 1a). When molecules were adsorbed on Ag colloidal particles, the surface charge was reduced, and the force of repulsion between the colloidal particles reduced. This can result in the aggregation of colloidal particles. Actually, dimers were formed predominantly, while trimers very few, during the second immobilization after the adsorption of aniline (see Fig. 1b–d). However, when pristine silver sols were used in the immobilization, colloidal particle clusters such as dimers, trimers, and tetramers were formed randomly during the second immobilization (see ref. 24 and Fig. S2†). Therefore, it is concluded that the formation of trimers and tetramers is prohibited when purified silver sols are used in the immobilization. This may be related to the surface charge of the dimers formed. Since the Ag colloidal particles in the purified silver sols had a relatively higher surface charge than that in the pristine sols, it can be expected that the dimers formed from the purified colloidal particles had a higher surface charge than that formed from the pristine ones. Therefore, we believe that the dimers formed from the purified colloidal particles had surface charge densities high enough prevent the attachment of new purified colloidal particles to them. Hence, very few larger clusters such as trimers and tetramers were formed when purified silver sols were used in the immobilization steps.
Fig. 2 shows the SERS spectra of benzenethiol measured from the substrates prepared by the three-step immobilization method and adsorption of aniline in the second step, after dipping each substrate in a 3.0 mL ethanol solution of 100 nM benzenethiol for 24 h and drying. The first immobilization time was all the same as 10 min, and the second immobilization time was varied from 0 to 40 min with a 10 min step. All the spectra are well characterized and have all the same spectral shape. The distinct peaks in the SERS spectra correspond to the modes of the benzene ring of benzenethiol.30 For example, the peak at 1573 cm−1 corresponds to ν8a, while that at 1000 cm−1 corresponds to ν12. The peak at 417 cm−1 corresponds to ν7a and contributions from the C–S stretching vibration (νCS). It should be noted that no peaks corresponding to aniline and P4VP were observed. The highest intensity was observed from the substrate whose second immobilization was 30 min. The SERS intensity increased with an increase in the number of dimers but decreased with red-shifting the λmax from 519 nm by increasing the number of larger clusters like trimers and tetramers at longer second immobilization times. The standard deviation of relative intensities measured at 10 different points of each sample was less than 5% when a laser beam with a diameter of ∼1 μm was used (see Fig. S3 and Table S1†).
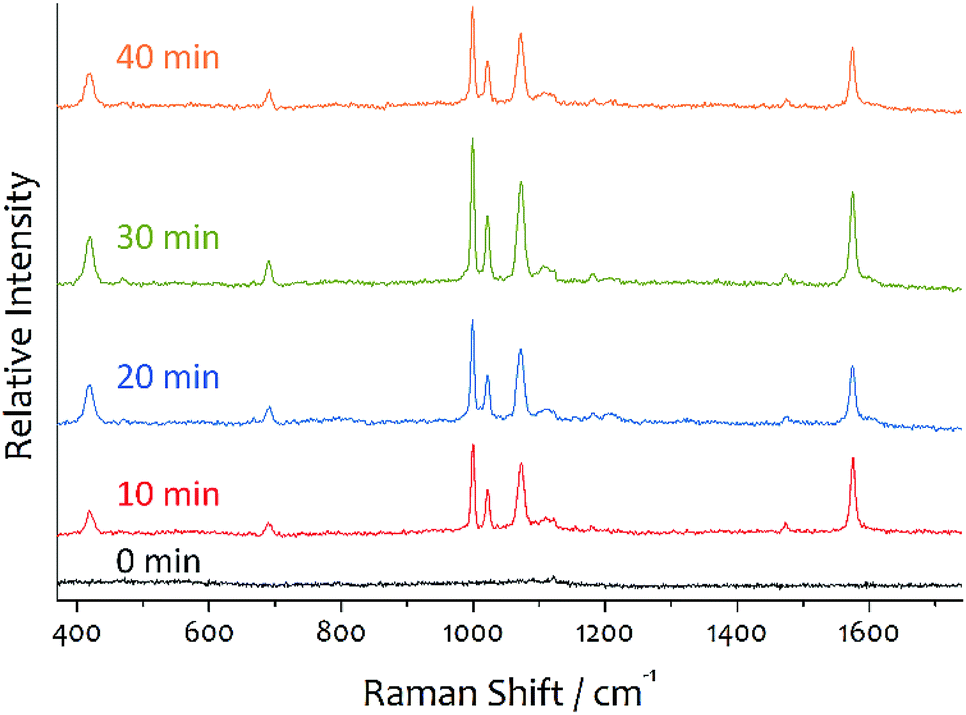 | ||
| Fig. 2 SERS spectra of benzenethiol measured from substrates prepared by a three-step immobilization method and adsorption aniline in the second step, after dipping each substrate in a 3.0 mL ethanol solution of 100 nM benzenethiol for 24 h and drying. The first immobilization time was all the same as 10 min, and the second immobilization time was varied. The legend shows the second immobilization times. A 514.5 nm Ar-ion laser line was used as the excitation source. The acquisition time was 1 s. | ||
Fig. 3 shows the SERS spectra recorded from the spots after dropping several target molecular solutions in arrays on the substrate prepared by the three-step immobilization and adsorption of aniline in the second step, and drying. The first and second immobilization times were 10 and 30 min, respectively. In the second step, the substrate was placed in a 3.0 mL ethanol solution of aniline (200 nM) for 2 h. 20 μL target molecular solutions (100 nM) were dropped by using a micropipette. Each spot produced a very good SERS spectrum. No peaks corresponding to aniline and P4VP were appeared. The spectrum of aniline was very weak (see Fig. S4†). The SERS spectra of the target molecules are well agreed with reported SERS spectra.30–35 For comparison purposes, we also measured the SERS spectra after dipping the substrates prepared by adsorbing aniline in each target molecular solution (see Fig. S4†). The SERS spectra measured after dropping were slightly better in the signal to noise ratio than those measured after dipping. This might be due to a different surface concentration of target molecules between two samples prepared by dipping and dropping.
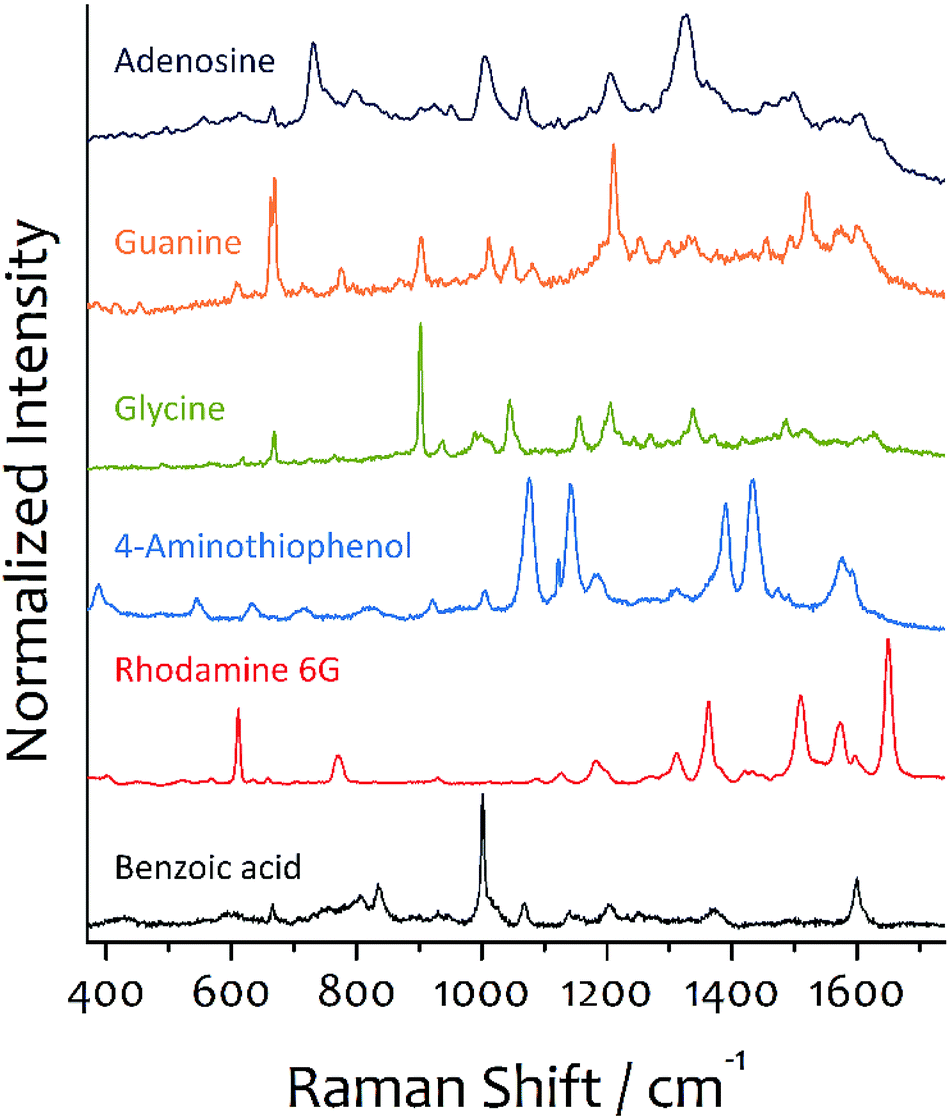 | ||
| Fig. 3 SERS spectra of several molecules measured from the spots after dropping target molecular solutions in arrays on the substrate, which was prepared by a three-step immobilization method and adsorbing aniline in the second step, and drying. The first and second immobilization times were 10 and 30 min, respectively. A 20 μL of target molecular solutions (100 nM) was dropped by using a micropipette. A 514.5 nm Ar-ion laser line was used as the excitation source. The acquisition time was 1 and 10 s for the bottom three molecules and the others, respectively. | ||
It should be mentioned that the intensity of the SERS spectrum measured from the substrate prepared by adsorption of a target molecules in the second step is significantly higher than that measured from the substrate prepared by adsorption of aniline after dipping in a target molecular solution (see Fig. S5†). For the former substrate, target molecules are adsorbed on the Ag colloidal particles immobilized during the first immobilization process, and then the dimers are formed in the second immobilization process. Therefore, a certain portion of target molecules exists at the junction region of the dimers. For the latter substrate, target molecules are adsorbed on the surface of all the colloidal particles present on the substrate. However, the dimers have already been formed before taking place adsorption of target molecules. Therefore, in order to be adsorbed at the dimer junction, target molecules need to penetrate into the narrow gap of the junction between two attached colloidal particles. By this reason, target molecules could not be adsorbed at the dimer junction. It is well known that the strongest signal enhancement is obtained from the junctions, which are hotspot sites.7–12 Therefore, the intensity difference of two kinds of substrates is attributed to the fact that some of the target molecules are present at the junctions when the adsorption takes place before the formation of dimers, while none could adsorb at the junctions after the formation of dimers. However, the fabrication by adsorbing target molecules in the second step needs a lot of efforts for measuring SERS spectra of many different target molecules because the substrate for each kind of target molecules must be prepared. On the other hand, many SERS spectra of different target molecules can be measured on the substrate prepared by adsorption of aniline.
By excitation with a 514.5 nm laser line, we obtained the highest enhancement when the λmax of the longitudinal mode of the dimers of Ag colloidal particles was around 519 nm. The optimum value of λmax was slightly greater than the wavelength of the laser line used. This is because of the fact that the SERS intensity is strongly correlated to the extinction at excitation and Stokes wavelengths.36 When a 514.5 nm laser line is used for excitation, for example, the Stokes Raman scattering wavelength becomes greater than the laser line wavelength by 10–45 nm depending on the modes. Therefore, the SERS intensity reaches the maximum value when λmax of the longitudinal mode of Ag dimers is somewhat greater than the wavelength of the laser line used. The λmax of the longitudinal mode of the dimers red-shifted with an increase in the diameter of the metal colloidal particles. A λmax of 519 nm was achieved when dimers were formed from the Ag colloidal particles whose average diameter was about 28 nm.
The average SERS enhancement of the substrate prepared by adsorption of aniline was calculated by comparing the intensity of the 1575 cm−1 peak in the benzenethiol SERS spectrum with that in the normal Raman spectrum. In the preparation of the substrate, the first and second immobilization times were 10 and 30 min, respectively. From the substrate prepared under these conditions, the highest SERS intensity was observed (see Fig. 2). The SERS spectrum was observed after dipping the substrate in a 3.0 mL ethanol solution of 200 nM benzenethiol for 24 h and drying. We assumed that benzenethiol was adsorbed completely on Ag colloidal particles, since benzenethiol was strongly chemisorbed on silver surface, the surface coverage was well below a monolayer, and the adsorption time was long enough as 24 h. The average enhancement factor for the SERS substrate prepared by adsorption of aniline in the second step was founded to be approximately 1.0 × 10⁷ (see Fig. S6† and the calculation). When the substrate prepared by adsorption of aniline was dipped in a benzenethiol solution, benzenethiol molecules would adsorb on the surface of all the colloidal particles of the substrate. However, the molecules adsorbed on the dimers could contribute significantly to the SERS signals. For the SEM image shown in Fig. 1c, there are 73 monomers, 78 dimers, and 5 trimers. If molecules were adsorbed evenly on the surface of all the particles, about 64% of benzenethiol molecules was adsorbed on the dimers. Therefore, the enhancement of the dimers was about 1.6 × 10⁷ [=1.0 × 10⁷/0.64]. Since the adsorption of benzenethiol took placed after the formation of dimers, no benzenethiol molecules could be adsorbed at the junctions of the dimers. Therefore, the enhancement of the dimers corresponded to the enhancement outside the hotspot regions.
The average enhancement of our universal SERS substrates is ∼1.0 × 10⁷. This value is about one order higher than that of the substrates prepared by the three-step immobilization method and using unpurified silver sols whose colloidal diameters were not optimized.24 After dropping the target molecular solutions on our substrates and drying, very good SERS spectra were observed. Therefore, it can be concluded that the substrate prepared by adsorption aniline has a high enough sensitivity for qualitative SERS spectral measurements. A block of 2 mm × 2 mm was large enough to load a sample solution by dropping using a micropipette without overlapping with the nearest neighbor blocks and the SERS spectrum was obtained reliably from each block. Since the substrate fabricated on a cover glass (2.2 cm × 2.2 cm) could be divided into 11 × 11 sampling blocks (2 mm × 2 mm in unit size), about one hundred samples could be tested on the substrate. Therefore, our substrates can be used in assays such as bioassays. Since dropping and drying are very simple and easy processes and many samples could be tested on a substrate, our substrates can be used in routine SERS spectral measurements. In this aspect, we called our substrates as universal SERS substrates.
4. Conclusions
We developed a simple method to fabricate sensitive and stable SERS substrates that can be used conveniently in routine SERS spectral measurements and assays such as bioassays. In the fabrication of SERS substrates by the three-step immobilization method, we adsorbed aniline, which is a weakly adsorbed molecule on Ag, instead of target molecules in the second step. Also, we optimized the diameter of colloidal particle to achieve high Raman signal enhancement from their dimers. To increase the surface charge of Ag colloidal particles, we purified pristine silver sols by centrifuging. When silver sols purified by centrifuging were used in the immobilization, the dimers of Ag colloidal particles were formed predominantly with very few trimers. It is concluded that the formation of trimers and tetramers is prohibited when purified silver sols are used in the immobilization. This is possible when the dimers formed from the purified colloidal particles have surface charge densities high enough prevent the attachment of new purified colloidal particles to them. A good SERS spectrum was observed from each spot when target molecular solutions were dropped in arrays on the substrate prepared by adsorbing aniline and dried. The enhancement of the dimers was found to be 1.6 × 10⁷, which corresponded to the enhancement outside the junctions. Since dropping and drying are very simple and easy processes and many samples could be tested on a substrate, the substrates fabricated by adsorption of aniline can be used conveniently in routine SERS spectral measurements and assays such as bioassays.Acknowledgements
This work was supported by Basic Study program through the National Research Foundation of Korea funded by the Ministry of Education, Science and Technology (2015R1D1A1A09058247), and the BK21 program.References
- K. A. Willets and R. P. Van Duyne, Annu. Rev. Phys. Chem., 2007, 58, 267–297 CrossRef CAS PubMed.
- N. R. Jana, L. Gearheart and C. J. Murphy, Langmuir, 2001, 17, 6782–6786 CrossRef CAS.
- K. L. Kelly, E. Coronado, L. L. Zhao and G. C. Schatz, J. Phys. Chem. B, 2003, 107, 668–677 CrossRef CAS.
- B. Sharma, R. R. Frontiera, A.-I. Henry, E. Ringe and R. P. Van Duyne, Mater. Today, 2012, 15, 16–25 CrossRef CAS.
- J. Chao, W. Cao, S. Su, L. Weng, S. Song, C. Fanc and L. Wang, J. Mater. Chem. B, 2016, 4, 1757–1769 RSC.
- K. C. Bantz, A. F. Meyer, N. J. Wittenberg, H. Im, O. Kurtulus, S. H. Lee, N. C. Lindquist, S.-H. Oh and C. L. Haynes, Phys. Chem. Chem. Phys., 2011, 13, 11551–11567 RSC.
- G. H. Gu and J. S. Suh, Langmuir, 2008, 24, 8934–8938 CrossRef CAS PubMed.
- G. H. Gu and J. S. Suh, J. Phys. Chem. C, 2010, 114, 7258–7262 CAS.
- S. J. Lee, A. R. Morrill and M. Moskovits, J. Am. Chem. Soc., 2006, 128, 2200–2201 CrossRef CAS PubMed.
- E. C. Le Ru, P. G. Etchegoin and M. Meyer, J. Chem. Phys., 2006, 125, 204701 CrossRef CAS PubMed.
- L. Qin, S. Zou, C. Xue, A. Atkinson, G. C. Schatz and C. A. Mirkin, Proc. Natl. Acad. Sci. U. S. A., 2006, 103, 13300–13303 CrossRef CAS PubMed.
- S. Nie and S. R. Emory, Science, 1997, 275, 1102–1106 CrossRef CAS PubMed.
- A. M. Michaels, J. Jiang and L. Brus, J. Phys. Chem. B, 2000, 104, 11965–11971 CrossRef CAS.
- X. Gong, Y. Bao, C. Qiu and C. Jiang, Chem. Commun., 2012, 48, 7003–7018 RSC.
- W. Li, P. H. C. Camargo, L. Au, Q. Zhang, M. Rycenga and Y. Xia, Angew. Chem., Int. Ed., 2010, 49, 164–168 CrossRef CAS PubMed.
- S. N. Terekhov, S. M. Kachan, A. Yu. Panarina and P. Mojzes, Phys. Chem. Chem. Phys., 2015, 17, 31780–31789 RSC.
- G. H. Gu, J. Kim, L. Kim and J. S. Suh, J. Phys. Chem. C, 2007, 111, 7906–7909 CAS.
- B. Sharma, M. Fernanda Cardinal, S. L. Kleinman, N. G. Greeneltch, R. R. Frontiera, M. G. Blaber, G. C. Schatz and R. P. Van Duyne, MRS Bull., 2013, 38, 615–624 CrossRef CAS.
- P. C. Lee and D. Meisel, J. Phys. Chem., 1982, 86, 3391–3395 CrossRef CAS.
- X. Xia, J. Zeng, L. K. Oetjen, Q. Li and Y. Xia, J. Am. Chem. Soc., 2012, 134, 1793–1801 CrossRef CAS PubMed.
- L. Mikac, M. Ivanda, V. Đerek and M. Gotić, J. Raman Spectrosc., 2016, 47, 1036–1041 CrossRef CAS.
- N. T. T. An, D. Q. Dao, P. C. Nam, B. T. Huy and H. N. Tran, Spectrochim. Acta, Part A, 2016, 169, 230–237 CrossRef PubMed.
- J. K. Daniels and G. Chumanov, J. Phys. Chem. B, 2005, 109, 17936–17942 CrossRef CAS PubMed.
- S. Lee, G. H. Gu and J. S. Suh, Chem. Phys. Lett., 2011, 511, 121–125 CrossRef CAS.
- G. Lu, H. Li, S. Wu, P. Chen and H. Zhang, Nanoscale, 2012, 4, 860–863 RSC.
- P. W. Atkins, Physical Chemistry, Oxford University Press, Oxford, 1992 Search PubMed.
- D. Steinigeweg and S. Schlucker, Chem. Commun., 2012, 48, 8682–8684 RSC.
- M. A. Mahmoud, ACS Appl. Mater. Interfaces, 2016, 8, 23827–23836 CAS.
- I. Kriegel, J. Rodrıguez-Fernandez, A. Wisnet, H. Zhang, C. Waurisch, A. Eychmuller, A. Dubavik, A. O. Govorov and J. Feldmann, ACS Nano, 2013, 7, 4367–4377 CrossRef CAS PubMed.
- M. Osawa, N. Matsuda, K. Yoshii and I. Uchida, J. Phys. Chem., 1994, 98, 12702–12707 CrossRef CAS.
- A. Kaminska, I. Dziecielewski, J. L. Weyher, J. Waluk, S. Gawinkowski, V. Sashuk, M. Fialkowski, M. Sawicka, T. Suski, S. Porowski and R. Holyst, J. Mater. Chem., 2011, 21, 8662–8669 RSC.
- F. Madzharova, Z. Heiner, M. Gühlke and J. Kneipp, J. Phys. Chem. C, 2016, 120, 15415–15423 CAS.
- J. Leem, H. W. Kang, S. H. Ko and H. J. Sung, Nanoscale, 2014, 6, 2895–2901 RSC.
- Y. J. Kwon, D. H. Son, S. J. Ahn, M. S. Kim and K. Kim, J. Phys. Chem., 1994, 98, 8481–8487 CrossRef CAS.
- N. H. Kim and K. Kim, J. Raman Spectrosc., 2005, 36, 623–628 CrossRef CAS.
- N. Félidj, J. Aubard, G. Lévi, J. R. Krenn, A. Hohenau, G. Schider, A. Leitner and F. R. Aussenegg, Appl. Phys. Lett., 2003, 82, 3095–3097 CrossRef.
Footnote |
| † Electronic supplementary information (ESI) available. See DOI: 10.1039/c7ra04871h |
| This journal is © The Royal Society of Chemistry 2017 |