 Open Access Article
A partial proteome reference map of Tetragenococcus halophilus and comparative proteomic and physiological analysis under salt stress†
Guiqiang Heab,
Jingcheng Dengab,
Chongde Wu *ab and
Jun Huangab
aCollege of Light Industry, Textile & Food Engineering, Sichuan University, Chengdu 610065, China. E-mail: cdwu@scu.edu.cn; Fax: +86-28-85405237; Tel: +86-28-85406149
bKey Laboratory of Leather Chemistry and Engineering, Ministry of Education, Sichuan University, Chengdu 610065, China
First published on 23rd February 2017
Abstract
Tetragenococcus halophilus, a moderately halophilic Gram-positive lactic acid bacteria, was widely existed in many food fermentation systems, where salt stress is an environmental condition commonly encountered. In this study, a partial proteome reference map of T. halophilus was established by using the proteomics approach. A total of 120 proteins were identified and the cluster of orthologous groups (COG), codon adaptation index (CAI), and GRAVY value analyses of the identified proteins were performed. To better understand the salt tolerance mechanisms and stress responses, we carried out a comparative proteomic and physiological study of T. halophilus during salt stress. Comparative proteomic analysis revealed 26 differentially expressed proteins that are mainly involved in cellular metabolism, energy production, stress response, and others. Analysis of the cytoplasmic membrane fatty acids showed that higher proportions of unsaturated fatty acid and higher mean chain length were observed in the cells challenged by salt stress. In addition, the salt shocked cells exhibited higher amounts of intracellular proline, glycine betaine, and trehalose compared with those without salt stress. Results presented in this study may further elucidate the mechanisms of T. halophilus underlying salt stress.
1. Introduction
Tetragenococcus halophilus is a moderately halophilic Gram-positive lactic acid bacterium found in many fermented foods, mostly highly salted fermented products, such as soy sauce mash1,2 and fish sauce.3,4 It plays important roles in fermentation processes during the production of pickled products. For example, previous research studies demonstrated that addition of T. halophilus as a starter culture for soy sauce moromi or fish sauce fermentation could promote the formation of volatile compounds and improve the flavor characteristics.3,5 However, T. halophilus was inevitably subjected to salt stress during the manufacture of these salted foods. Generally, exposure of cells to high salinity environments may lead to structural and physiological injury of cells and a decrease in metabolic activities and production efficiency.Therefore, developing adaptive strategies to cope with salt stress is essential for cells to exert their functional characteristics in food fermentation.6 In response to salt stress, like other bacteria, lactic acid bacteria (LAB) have acquired an amazing variety of adaptation and defense mechanisms to cope with harmful effects and to survive in hostile environments. Intracellular accumulating of osmoprotectants is one of most effective strategies of LAB responding to salt stress, which can equilibrate cellular osmotic pressure.7 Modification of the cytoplasmic membrane fatty acid compositions to withdraw the injury from osmotic stress is another powerful strategy.8
In recent years, omics technologies have paved the way for the studies of adaptive response of bacterium to salt stress.9,10 Zhang et al.11 established a reference proteome map of intracellular proteins of Lactococcus lactis SK11 using a proteomics approach, and a comparative proteomic analysis was carried out to identify and characterize proteins expressed in the cells containing or not containing glutathione under salt stress. Moreover, omics technologies for the manipulation of gene expression levels are available, allowing complementary approaches to alter expression levels of genes encoding stress response proteins. For example, the heterologous expression of RecO protein in Lactococcus lactis, resulted in a significant higher tolerance to multiple-stress and enhanced lactic acid production during salt stress.12 Yet another example revealed that expression of PprI from Deinococcus radiodurans improved oxidative stress and osmotic stress tolerance in L. lactis.13
Recently, Liu et al.14 investigated salt tolerance mechanisms of T. halophilus by transcriptomic analysis, and results showed that genes involved in transcription, translation, membrane system, and division were highly up-regulated under salt stress. Acid tolerance response of T. halophilus was also investigated based on physiological and proteomic analysis, and proteomic analysis demonstrated that eight proteins involved in carbohydrate metabolism and three classic stress response proteins were up-regulated after acid adaptation.15 Despite the importance roles of T. halophilus, little is known about its protein expression in response to salt stress. Thus, the aim of this study was to investigate the salt stress response of T. halophilus via the physiological analysis. Results presented in this study may contribute to understand the salt tolerance mechanisms and lay the foundation for improving salinity resistance of T. halophilus.
2. Materials and methods
2.1. Strains and salt stress experiment
Tetragenococcus halophilus CGMCC 3792, which was isolated from soy sauce moromi and identified by 16S rDNA sequence,1 was used in this study. The cells were cultivated statically in GM17 (M17 broth (OXOID, UK) supplemented with 0.5% (w/v) glucose) at 30 °C for 20 h to obtain a pre-culture. To investigate the salt tolerance of T. halophilus, the pre-culture was inoculated (5%, v/v) into a fresh GM17. Cells grown to mid-exponential growth phase were collected, centrifugated (10![[thin space (1/6-em)]](https://www.rsc.org/images/entities/char_2009.gif) 000 × g, 5 min), washed, and resuspended with modified GM17 containing different concentrations of NaCl for 2 h at 30 °C. After salt stress, cells were serially diluted, plated onto GM17 agar plates, and incubated at 30 °C for 48 h. Cell survival rate was expressed as the percentage of viable cells (CFU per milliliter).
000 × g, 5 min), washed, and resuspended with modified GM17 containing different concentrations of NaCl for 2 h at 30 °C. After salt stress, cells were serially diluted, plated onto GM17 agar plates, and incubated at 30 °C for 48 h. Cell survival rate was expressed as the percentage of viable cells (CFU per milliliter).
2.2. Organic acid analysis
Cells cultivated in GM17 supplemented with different concentrations of NaCl were harvested, centrifugated (10![[thin space (1/6-em)]](https://www.rsc.org/images/entities/char_2009.gif) 000 × g, 5 min), and the supernatants were acidified by addition of 5 mM H2SO4. Supernatants were then filtered with a 0.22 μm membrane filter, the filtrate was analyzed by high-pressure liquid chromatography (HPLC, Agilent 1200, which was fitted with an organic acid column (300 mm × 4.6 mm, OA-1000, Alltech, USA), USA) according to the method of Tiina Michelson et al.16
000 × g, 5 min), and the supernatants were acidified by addition of 5 mM H2SO4. Supernatants were then filtered with a 0.22 μm membrane filter, the filtrate was analyzed by high-pressure liquid chromatography (HPLC, Agilent 1200, which was fitted with an organic acid column (300 mm × 4.6 mm, OA-1000, Alltech, USA), USA) according to the method of Tiina Michelson et al.16
2.3. Intracellular amino acid analysis
For the extraction of intracellular amino acids, 10 mL of cultures at an OD600 of 2.5 was harvested, centrifugated (10![[thin space (1/6-em)]](https://www.rsc.org/images/entities/char_2009.gif) 000 × g, 5 min), washed, resuspended in 1 mL of 200 mM phosphate buffer saline (PBS, pH 7.0), and boiled for 15 min. Cell debris was discarded by centrifugation (12
000 × g, 5 min), washed, resuspended in 1 mL of 200 mM phosphate buffer saline (PBS, pH 7.0), and boiled for 15 min. Cell debris was discarded by centrifugation (12![[thin space (1/6-em)]](https://www.rsc.org/images/entities/char_2009.gif) 000 × g, 10 min, 4 °C). The supernatants were treated at ambient temperature by addition of 100 μL 10% (w/v) sulphosalicylic acid for 10 min. The mixture was then centrifugated as noted again and the supernatants were filtered with a 0.22 μm filter. Sample solutions with 20 μL were detected for amino acid composition using an amino acid analyzer (A300, membraPure GmbH, Germany) according to the method of Cui et al.5
000 × g, 10 min, 4 °C). The supernatants were treated at ambient temperature by addition of 100 μL 10% (w/v) sulphosalicylic acid for 10 min. The mixture was then centrifugated as noted again and the supernatants were filtered with a 0.22 μm filter. Sample solutions with 20 μL were detected for amino acid composition using an amino acid analyzer (A300, membraPure GmbH, Germany) according to the method of Cui et al.5
2.4. Intracellular osmoprotectants analysis
Cells cultivated in GM17 with different NaCl concentrations were harvested, centrifugated (10![[thin space (1/6-em)]](https://www.rsc.org/images/entities/char_2009.gif) 000 × g, 5 min), and washed with isotonic solution. For determination of glycine betaine, cells were resuspended in 1 mL of 50 mM PBS (pH 7.0), and then disrupted ultrasonically in iced bath for 100 cycles of 5 s (JY92-IIN sonicator, China). After sonication, the extraction solutions were immediately centrifugated (10
000 × g, 5 min), and washed with isotonic solution. For determination of glycine betaine, cells were resuspended in 1 mL of 50 mM PBS (pH 7.0), and then disrupted ultrasonically in iced bath for 100 cycles of 5 s (JY92-IIN sonicator, China). After sonication, the extraction solutions were immediately centrifugated (10![[thin space (1/6-em)]](https://www.rsc.org/images/entities/char_2009.gif) 000 × g, 5 min, 4 °C), and the supernatants were analyzed following the previous method.17 Trehalose was extracted and assayed according to the previous literature.18
000 × g, 5 min, 4 °C), and the supernatants were analyzed following the previous method.17 Trehalose was extracted and assayed according to the previous literature.18
2.5. Membrane fatty acid analysis
Extraction of membrane lipids and preparation of fatty acid methyl esters (FAMEs) were carried out according to the method of Wu et al.19 Analysis of the samples was performed by gas chromatography-mass spectrometer (GC-MS, Trace GC Ultra-DSQ II, Thermo Electron Corporation, USA) according to the method described in the literature.20 The relative amount of FAMEs was calculated from peak areas. The degree of unsaturation (unsaturated fatty acids/saturated fatty acid, U/S ratio) and the mean chain length were assayed according to the method described previously.19 All experiments were carried out in triplicate.2.6. Protein preparation, 2D gel electrophoresis, and image analysis
Cells collected at exponential phase (20 mL, OD600 = 2.5) were centrifugated (10![[thin space (1/6-em)]](https://www.rsc.org/images/entities/char_2009.gif) 000 × g, 5 min), washed, and then resuspended in GM17 supplemented with 12% NaCl. After shocked for 2 h, the cells were washed to remove the residual medium. The whole cell extracts were prepared using the BioRad Kit. Briefly, the washed cells were lysed in lysis buffer (8 M urea, 4% CHAPS, 30 mM Tris pH 8.5), and the solution was sonicated on ice for 20 min and followed by centrifugation at 16
000 × g, 5 min), washed, and then resuspended in GM17 supplemented with 12% NaCl. After shocked for 2 h, the cells were washed to remove the residual medium. The whole cell extracts were prepared using the BioRad Kit. Briefly, the washed cells were lysed in lysis buffer (8 M urea, 4% CHAPS, 30 mM Tris pH 8.5), and the solution was sonicated on ice for 20 min and followed by centrifugation at 16![[thin space (1/6-em)]](https://www.rsc.org/images/entities/char_2009.gif) 000 × g for 30 min. Proteins in the supernatant were treated with the Clean-up kit (BioRad) and dissolved in lysis buffer and treated by DNase (0.02 U μL−1, Fermentas) and RNase (25 μg μL−1, Fermentas). The protein concentration was determined by using the BioRad Protein Assay Kit with BSA as a standard. The sample was applied to immobilized pH gradient (IPG) strips (18 cm, pH 4–7, BioRad) with a final concentration of 100 μg protein in 350 μL rehydration buffer (8 M urea, 2% (w/v) CHAPS, 20 mM DTT, 0.5% (v/v IPG buffer), 0.002% bromphenol blue). Isoelectric focusing (IEF) of the protein sample was performed according to the method described previously.21 After IEF, the IPG strips were equilibrated sequentially in a buffer (Tris–HCl contained 6 M urea, 30% glycerol, and 2% SDS) that contained 1% DTT or 2.5% iodoacetamide for 15 min each. The equilibrated IPG strips were run on 12% SDS polyacrylamide gels. Electrophoresis was performed using an Ettan DALT-12 unit (GE Healthcare) according to the method described by Wu et al.21 After SDS-PAGE, the 2D gels were stained with 0.1% coomassie blue R-250 (Sangon Biotech, China).
000 × g for 30 min. Proteins in the supernatant were treated with the Clean-up kit (BioRad) and dissolved in lysis buffer and treated by DNase (0.02 U μL−1, Fermentas) and RNase (25 μg μL−1, Fermentas). The protein concentration was determined by using the BioRad Protein Assay Kit with BSA as a standard. The sample was applied to immobilized pH gradient (IPG) strips (18 cm, pH 4–7, BioRad) with a final concentration of 100 μg protein in 350 μL rehydration buffer (8 M urea, 2% (w/v) CHAPS, 20 mM DTT, 0.5% (v/v IPG buffer), 0.002% bromphenol blue). Isoelectric focusing (IEF) of the protein sample was performed according to the method described previously.21 After IEF, the IPG strips were equilibrated sequentially in a buffer (Tris–HCl contained 6 M urea, 30% glycerol, and 2% SDS) that contained 1% DTT or 2.5% iodoacetamide for 15 min each. The equilibrated IPG strips were run on 12% SDS polyacrylamide gels. Electrophoresis was performed using an Ettan DALT-12 unit (GE Healthcare) according to the method described by Wu et al.21 After SDS-PAGE, the 2D gels were stained with 0.1% coomassie blue R-250 (Sangon Biotech, China).
The stained gels were scanned using Imagescanner (GE Healthcare) at 300 dpi resolution. The images were analyzed using Image Master 6.0 2D platinum software (GE Healthcare). The spot detection, gel matching, and spot quantification were performed by using the automatic mode as previously described, followed by manual checking.22 Only protein spots showing at least 2-fold change were considered for statistic analysis (Student's t test). Significant differentially expressed protein spots (p < 0.05) were considered for further analysis.
2.7. In-gel digestion, MS analysis, and protein identification
Proteins spots were excised using gel plugs, transferred to Eppendorf tubes, then in-gel digestion by trypsin.22 Supernatants of 0.5 μL were spotted directly onto the MALDI plate (containing 0.4 μL CHCA), and samples were analyzed on the Applied Biosystem 4700 Proteomics Analyzer MALDI-TOF/TOF (Applied Biosystmes, Framingham, MA) in positive ion reflector mode. MS and MS/MS data were analyzed and peak lists were generated using GPS Explorer v3.5 (Applied Biosystmes). MS peaks were selected between 700 and 4000 Da and filter was used with a signal-to-noise ratio greater than 20. Database searches for MS or MS/MS spectra were performed by using the Mascot 2.0 to search against the T. halophilus protein sequence database, NCBInr, and Swissprot database. The searching parameters were set to use trypsin digestion with one missed cleavage, and use carbamidomethyl as a fixed modification of cysteine and oxidized methionine as a variable modification. The mass tolerance of precursor ion and fragment ion were set to 0.2 Da for +1 charged ions. MS or MS/MS identifications were accepted when the protein score or total ion score were higher than 95.2.8. In silico analysis of the identified proteins
The codon adaptation index (CAI) of all genes and grand average of hydropathy (GRAVY) of each protein of T. halophilus were generated by CodonW software as previously described.23 Experimentally identified proteins and all ORFs were grouped into cellular roles according to COGs as well (http://www.ncbi.nlm,nih.gov/COG/). The theoretical 2-DE map of T. halophilus was constructed using the JVirGel 2.0 web service (http://www.jvirgel.de/).242.9. Gene expression analysis by quantitative RT-PCR
For the analysis of gene expression, 100 mL of mid-exponential growth phase cells was harvested, centrifugated (10![[thin space (1/6-em)]](https://www.rsc.org/images/entities/char_2009.gif) 000 × g, 5 min, 4 °C), washed, and stored at −80 °C for further analysis. Extraction of total RNA, synthesis of first-strand cDNA, and qPCR experiments were performed according to the method of Wu et al.25 The expression levels of all the target genes were compared to the reference gene (16S rRNA). The 2−ΔΔCt method was used to calculate the relative changes in gene expression level.26 The primers used for RT-PCR assay are listed in Table S1.†
000 × g, 5 min, 4 °C), washed, and stored at −80 °C for further analysis. Extraction of total RNA, synthesis of first-strand cDNA, and qPCR experiments were performed according to the method of Wu et al.25 The expression levels of all the target genes were compared to the reference gene (16S rRNA). The 2−ΔΔCt method was used to calculate the relative changes in gene expression level.26 The primers used for RT-PCR assay are listed in Table S1.†
2.10. Statistical analysis
In this study, each analysis was carried out in triplicate. Analysis of variance (one-way ANOVA) with Duncan's test was performed to evaluate statistical differences. Differences between samples with p-values p ≤ 0.05 (n = 3) were considered to be statistically significant.3. Results
3.1. Effect of salt stress on the survival of T. halophilus
The tolerance of T. halophilus subjected to different concentrations of NaCl (0, 6, 12, 18, 24, 30, and 36%) was investigated, and the survival rates were determined (Fig. 1). As shown in Fig. 1, T. halophilus exhibited relatively broad ranges of NaCl tolerance and the survival rates decreased with the increase of NaCl concentration. When treated with 36% NaCl for 2 h, the survival rate decreased 83.3%, compared with that without salt stress. Generally, T. halophilus has been frequently found in many high salt fermented foods, and this bacterium could grow in 18% NaCl or greater.3,27,28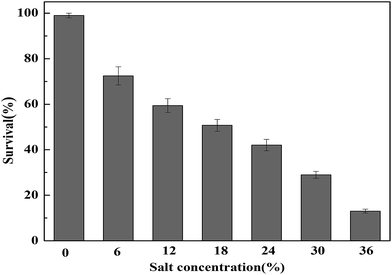 | ||
| Fig. 1 Survival rates of T. halophilus under salt stress. Cultures were subjected to salt stress for 2 h and the survival rate was determined. Error bars indicate standard deviations (n = 3). | ||
3.2. 2-DE proteome reference map of T. halophilus
T. halophilus cells were subjected to 2-DE analysis to construct the proteome reference map. According to the genome annotation of T. halophilus, a total of 2587 predicted proteins were encoded. All of the predicted proteins were used to generate the theoretical 2-DE map by using the software JVirGel 2.0 (http://www.jvirgel.de/), and about 70% of the proteins possess pI values between 4 and 7 (Fig. S1†). Therefore, IPG strip of pH 4–7 was used for the first dimension separation of the cytoplasmic proteins. The representative 2-DE gel stained with coomassie blue was selected to serve as the reference map and was shown in Fig. 2. A total of 120 spots representing 116 proteins were successfully identified, and the numbers corresponding to the identified proteins were listed in Table S2.†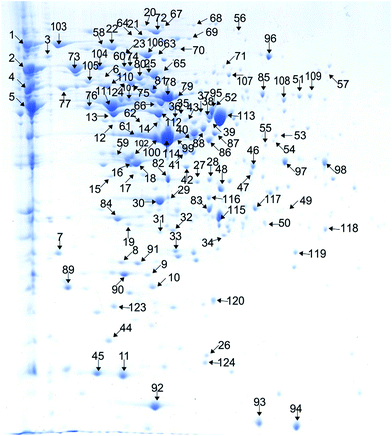 | ||
| Fig. 2 Two-dimensional electrophoresis gels of the proteins of T. halophilus during salt stress. The identified proteins are marked by arrows and numbers and listed in Table S2.† | ||
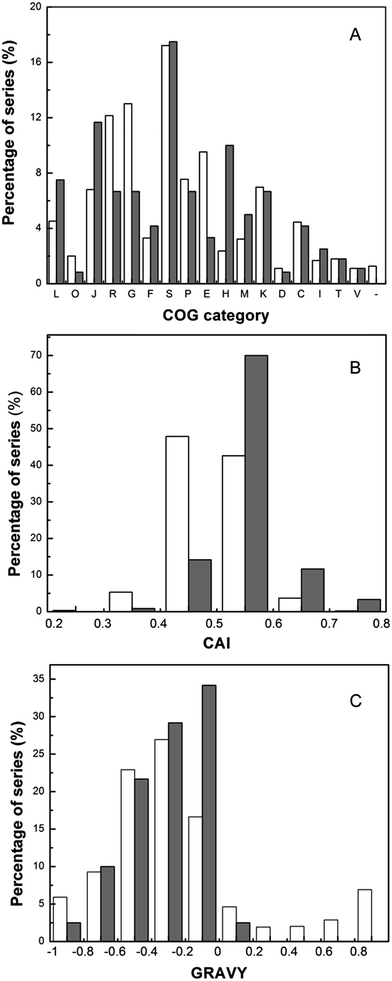
Based on the characterizations of identified proteins, the physico-chemical analysis was performed (Fig. 3). Experimentally identified proteins were grouped into cellular roles according to COGs (Clusters of Orthologous Groups) categories on the basis of biological or biochemical function, and the distribution of COG category was presented (Fig. 3A). From Fig. 3A, the proteins involved in translation (J) and replication (L) comprised a great part of the identified proteins. Other abundant categories included proteins implicated in carbohydrate transport and metabolism (G) and transcription (K). The comparison of CAI (Codon Adaptation Index) distribution and GRAVY (grand average of hydrophobicity) index of the genes coding for the proteins identified on pH 4–7 gels with those of the whole set of genes encoding proteins of T. halophilus were presented in Fig. 3B and C. The CAI value is used to determine the codon usage bias for a gene, and demonstrate the tendency of the corresponding protein synthesis. The proteins encoded by genes with a CAI value above 0.4 accounted for 94% of the total predicted proteins and 99% of the 120 identified proteins, respectively. This result suggests that proteins encoded by genes with a high CAI were easily identified. This observation is in agreement with previous results reported in Lactococcus lactis,23 Lactobacillus casei,29 and Bifidobacterium longum.30
The GRAVY index indicates the solubility of the proteins. By using the CodonW software, the GRAVY index was calculated for all of the theoretical and identified proteins. The comparison of GRAVY values revealed that all the identified proteins exhibited the GRAVY values lower than 0.2. The most hydrophobic protein identified in this work was the small heat shock protein (−0.988). Only 3 identified proteins had a GRAVY index above zero, indicating that strongly hydrophobic proteins might be lost under the standard gel conditions. These results are similar to those demonstrated for other LAB.23,29,30
3.3. Comparative proteomic analysis of T. halophilus during salt stress
To investigate the salt stress response of T. halophilus, a comparative proteomic analysis was employed based on two-dimensional gel electrophoresis followed by protein identification (Fig. S2†). Proteins that exhibited more than two-fold higher expression were taken into account for further analysis. The differentially expressed proteins were arranged by COG categories, and listed in Table 1. Analysis of the gels indicated that two proteins (TreB: spots 59 and GldA: 62) were produced exclusively during salt stress. Moreover, further analysis of the differentially expressed proteins showed that the majority of the proteins belonged to carbohydrate transport and metabolism (6 proteins), energy production and conversion (5), translation, ribosomal structure, and biogenesis (3), posttranslational modification, protein turnover, chaperones (3), and others.| Spot no.a | NCBI accession no. | Putative function | Gene locus | Gene | Mass (Da) | pI | Ratio (p-value)b |
|---|---|---|---|---|---|---|---|
| a Spot numbers refer to the proteins labeled in Fig. 2.b Fold change in intensity relative to salt stress. Values are means of at least three independent experiments.c Proteins only detected during salt stress. | |||||||
| Energy production and conversion (C) | |||||||
| 18 | gi|352518632 | L-Lactate dehydrogenase | TEH_24580 | ldh | 35![[thin space (1/6-em)]](https://www.rsc.org/images/entities/char_2009.gif) 041.84 041.84 |
4.72 | 2.63 (1.5 × 10⁻²) |
| 62 | gi|352516658 | Glycerol dehydrogenase | TEH_04840 | gldA | 41![[thin space (1/6-em)]](https://www.rsc.org/images/entities/char_2009.gif) 312.789 312.789 |
4.76 | —c |
| 88 | gi|352517703 | Pyruvate dehydrogenase E1 component alpha subunit | TEH_15290 | pdhA | 41![[thin space (1/6-em)]](https://www.rsc.org/images/entities/char_2009.gif) 213.789 213.789 |
5.03 | 2.01 (2.1 × 10⁻²) |
| 105 | gi|352517934 | ATP synthase beta subunit | TEH_17600 | atpD | 50![[thin space (1/6-em)]](https://www.rsc.org/images/entities/char_2009.gif) 876.73 876.73 |
4.52 | 2.15 (5.5 × 10⁻³) |
| 118 | gi|352516835 | Putative ferredoxin | TEH_06610 | 47![[thin space (1/6-em)]](https://www.rsc.org/images/entities/char_2009.gif) 451.012 451.012 |
5.3 | 2.05 (3.6 × 10⁻²) | |
![[thin space (1/6-em)]](https://www.rsc.org/images/entities/char_2009.gif) |
|||||||
| Cell cycle control, cell division, chromosome partitioning (D) | |||||||
| 110 | gi|352516934 | Cell division protein FtsZ | TEH_07600 | ftsZ | 44![[thin space (1/6-em)]](https://www.rsc.org/images/entities/char_2009.gif) 197.461 197.461 |
4.61 | 2.50 (4.6 × 10⁻³) |
![[thin space (1/6-em)]](https://www.rsc.org/images/entities/char_2009.gif) |
|||||||
| Amino acid transport and metabolism (E) | |||||||
| 104 | gi|352516420 | Dipeptidase PepV | THE_02460 | pepV | 51![[thin space (1/6-em)]](https://www.rsc.org/images/entities/char_2009.gif) 963.289 963.289 |
4.56 | 3.2 (2.7 × 10⁻²) |
![[thin space (1/6-em)]](https://www.rsc.org/images/entities/char_2009.gif) |
|||||||
| Carbohydrate transport and metabolism (G) | |||||||
| 22 | gi|352518123 | Phosphoenolpyruvate–protein phosphotransferase | THE_19490 | ptsI | 63![[thin space (1/6-em)]](https://www.rsc.org/images/entities/char_2009.gif) 700.781 700.781 |
4.68 | 2.66 (1.9 × 10⁻²) |
| 29 | gi|352517161 | Fructose-bisphosphate aldolase | THE_09870 | fba | 31![[thin space (1/6-em)]](https://www.rsc.org/images/entities/char_2009.gif) 482.68 482.68 |
4.84 | 2.04 (7.2 × 10⁻³) |
| 97 | gi|352517071 | 6-Phosphofructokinase | THE_08970 | pfk | 34![[thin space (1/6-em)]](https://www.rsc.org/images/entities/char_2009.gif) 427.629 427.629 |
5.51 | 2.05 (4.5 × 10⁻³) |
| 99 | gi|352517949 | Glyceraldehyde-3-phosphate dehydrogenase | THE_17750 | gap | 35![[thin space (1/6-em)]](https://www.rsc.org/images/entities/char_2009.gif) 758.141 758.141 |
4.79 | 2.11 (2.3 × 10⁻²) |
| 111 | gi|352517946 | Enolase | TEH_17720 | eno | 46![[thin space (1/6-em)]](https://www.rsc.org/images/entities/char_2009.gif) 628.559 628.559 |
4.58 | 3.05 (5.2 × 10⁻³) |
| 112 | gi|352517948 | Phosphoglycerate kinase | TEH_17740 | pgk | 42![[thin space (1/6-em)]](https://www.rsc.org/images/entities/char_2009.gif) 176.762 176.762 |
4.91 | 2.31 (2.6 × 10⁻³) |
![[thin space (1/6-em)]](https://www.rsc.org/images/entities/char_2009.gif) |
|||||||
| Lipid transport and metabolism (I) | |||||||
| 54 | gi|352518404 | Acyl-ACP-phosphate acyltransferase | TEH_22300 | plsX | 35![[thin space (1/6-em)]](https://www.rsc.org/images/entities/char_2009.gif) 799.77 799.77 |
5.5 | 0.46 (4.1 × 10⁻³) |
![[thin space (1/6-em)]](https://www.rsc.org/images/entities/char_2009.gif) |
|||||||
| Translation, ribosomal structure and biogenesis (J) | |||||||
| 53 | gi|352517495 | Tryptophanyl-tRNA synthetase | THE_13210 | trpS | 37![[thin space (1/6-em)]](https://www.rsc.org/images/entities/char_2009.gif) 431.121 431.121 |
5.54 | 0.39 (1.9 × 10⁻²) |
| 72 | gi|352518461 | Elongation factor G | TEH_22870 | fusA | 77![[thin space (1/6-em)]](https://www.rsc.org/images/entities/char_2009.gif) 058.273 058.273 |
4.83 | 0.34 (2.2 × 10⁻³) |
| 78 | gi|352518460 | Elongation factor Tu | THE_22860 | tuf | 43![[thin space (1/6-em)]](https://www.rsc.org/images/entities/char_2009.gif) 469.801 469.801 |
4.82 | 2.44 (6.1 × 10⁻³) |
![[thin space (1/6-em)]](https://www.rsc.org/images/entities/char_2009.gif) |
|||||||
| Cell wall/membrane/envelope biogenesis (M) | |||||||
| 14 | gi|352516351 | D-Alanine-D-alanine ligase | THE_01770 | ddl | 40![[thin space (1/6-em)]](https://www.rsc.org/images/entities/char_2009.gif) 276.32 276.32 |
4.87 | 0.47 (1.2 × 10⁻³) |
| 47 | gi|352518617 | N-Acetylmuramic acid 6-phosphate etherase | THE_24430 | murQ | 32![[thin space (1/6-em)]](https://www.rsc.org/images/entities/char_2009.gif) 040.619 040.619 |
5.37 | 0.42 (4.3 × 10⁻³) |
| 81 | gi|352518036 | Glycine betaine ABC transporter ATP-binding protein | THE_18620 | opuAA | 47![[thin space (1/6-em)]](https://www.rsc.org/images/entities/char_2009.gif) 005.07 005.07 |
4.83 | 2.65 (1.9 × 10⁻³) |
![[thin space (1/6-em)]](https://www.rsc.org/images/entities/char_2009.gif) |
|||||||
| Posttranslational modification, protein turnover, chaperones (O) | |||||||
| 1 | gi|352517474 | Chaperone protein DnaK | TEH_13000 | dnaK | 66![[thin space (1/6-em)]](https://www.rsc.org/images/entities/char_2009.gif) 743.43 743.43 |
4.38 | 3.68 (3.6 × 10⁻²) |
| 59 | gi|352516438 | Thioredoxin reductase | TEH_02640 | trxB | 34![[thin space (1/6-em)]](https://www.rsc.org/images/entities/char_2009.gif) 426.031 426.031 |
4.67 | —c |
| 73 | gi|352517299 | 60 kDa chaperonin | TEH_11250 | groEL | 57![[thin space (1/6-em)]](https://www.rsc.org/images/entities/char_2009.gif) 740.68 740.68 |
4.47 | 3.05 (1.5 × 10⁻²) |
![[thin space (1/6-em)]](https://www.rsc.org/images/entities/char_2009.gif) |
|||||||
| Inorganic ion transport and metabolism (P) | |||||||
| 122 | gi|352517775 | Superoxide dismutase | TEH_16010 | sodA | 22![[thin space (1/6-em)]](https://www.rsc.org/images/entities/char_2009.gif) 700.051 700.051 |
5.06 | 2.04 (3.6 × 10⁻³) |
![[thin space (1/6-em)]](https://www.rsc.org/images/entities/char_2009.gif) |
|||||||
| Signal transduction mechanisms (T) | |||||||
| 44 | gi|352518338 | UspA family protein | THE_21640 | 17![[thin space (1/6-em)]](https://www.rsc.org/images/entities/char_2009.gif) 457.939 457.939 |
4.65 | 0.45 (4.5 × 10⁻³) | |
| 86 | gi|352517890 | Catabolite control protein A | THE_17160 | ccpA | 36![[thin space (1/6-em)]](https://www.rsc.org/images/entities/char_2009.gif) 383.988 383.988 |
5.17 | 0.37 (2.6 × 10⁻²) |
A total of 12 proteins belonging to cellular metabolism and energy production were identified. Dramatic alterations in the protein expression during salt stress took place in T. halophilus. After salt shock, the expressions of proteins involved in amino acid transport and metabolism (spot 104), carbohydrate metabolism and energy production (spots 18, 29, 88, 97, 105, 111, 112, 118) were enhanced (Table 1). One protein (spot 54) involved in lipid transport, and two proteins (spots 53 and 72) involved in translation were down-regulated after salt stress. In addition, two proteins (spots 14 and 47) which is closely involved in peptidoglycan synthesis were detected, and a significantly down-regulated in protein expression was observed during salt stress. As expected, two classical stress shock proteins including chaperone protein Dnak (spot 1) and 60 kDa chaperonin (spot 73) exhibited remarkably up-regulated. Whereas, UspA family protein (spot 44) and catabolite control protein A (spot 86) were markedly down-regulated (Table 1).
3.4. Regulation of membrane fatty acid in T. halophilus during salt stress
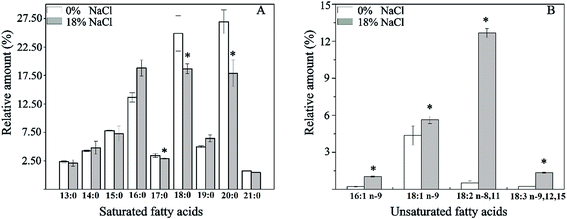
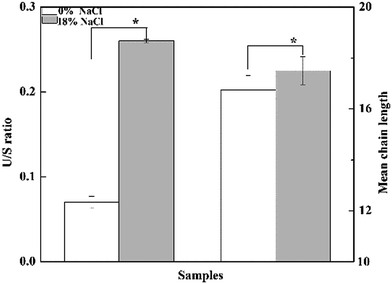
Effect of salt stress on the composition of membrane fatty acid was investigated (Fig. 4). As is shown, a total of 13 fatty acids were detected, and the major fatty acids were pentadecyclic acid (C15:0), palmitic acid (C16:0), stearic acid (C18:0), oleic acids (C18:1 n-9), and eicosanoic acid (C20:0), making up approximately 82.3% of the total fatty acids content of T. halophilus without salt stress. After salt shocked, the proportion of saturated fatty acids (SFA, C17:0, C18:0, and C19:0) decreased, and the proportion of unsaturated fatty acids (UFA, C16:1, C18:1, C18:2, and C18:3) increased. A detailed analysis of the ratio of UFA to SFA (U/S ratio) and mean chain length of the membrane fatty acids demonstrated that salt stress resulted in higher U/S ratio and mean chain length, compared to those without salt stress (Fig. 5).3.5. Changes of amino acid pools in T. halophilus during salt stress
Effect of salt stress on the pools of amino acid was investigated. Significant difference was observed in the contents of 8 amino acids between cells with and without salt stress (Fig. 6). Salt stress induced a significant increase in the levels of proline and glycine, when cultured in GM17 containing 12% NaCl, and the levels of proline and glycine were 2.3-fold and 2.4-fold higher than those in cells grown without NaCl, respectively. Whereas, the levels of threonine, valine, leucine, isoleucine, serine, and alanine decreased remarkably in the salt-stressed cells (Fig. 6).3.6. Accumulation of osmoprotectants in T. halophilus during salt stress
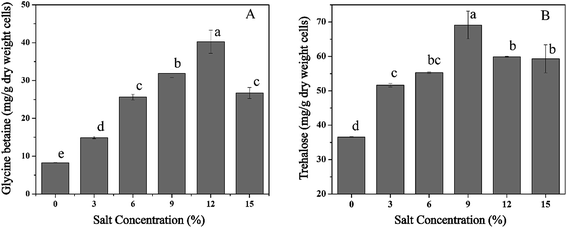
To investigate the accumulation of osmoprotectants in T. halophilus during salt stress, alterations in intracellular concentrations of glycine betaine and trehalose were measured (Fig. 7). The levels of glycine betaine increased with the enhancement of NaCl concentration, and the maximum accumulation of glycine betaine (40.3 mg g−1 DCW) was obtained at 12% NaCl (Fig. 7A). Similar tendency was also observed in the content of trehalose (Fig. 7B). Salt stress led to the accumulation of trehalose, and a 1.9-fold higher amount of trehalose was detected at 9% NaCl compared with that without NaCl addition. These results suggested that accumulation of glycine betaine or trehalose could play a potential protective role during salt stress.3.7. Expression levels of genes in T. halophilus during salt stress
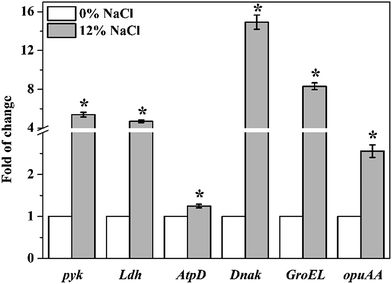
Transcriptional levels of pyk, Ldh, AtpD, Dnak, GroEL, and opuAA in T. halophilus under salt stress were shown in Fig. 8. The expression levels of 6 genes were all up-regulated when cells were treated with 12% NaCl. Statistical analysis showed that the expression levels of salt-stressed cells significantly increased 5.4-, 4.7-, 1.3-, 14.9-, 8.3-, and 2.6-fold for pyk, Ldh, AtpD, Dnak, GroEL, and opuAA, respectively, compared to those control cells. These results were agreement with the data of proteomic analysis.4. Discussion
Salt stress is a commonly encountered environment for T. halophilus during the manufacture of fermented foods. The molecular basis for the salt tolerance is only partly understood, although numerous studies have been carried out to investigate the response and mechanism during salt stress. In this respect, the proteome reference map is able to give a global picture of the relative abundance of proteins for microbes during physiological or environmental changes. In the present study, for the first time, a 2-DE proteome reference map of T. halophilus was constructred, and based on this, a combined physiological and comparative proteomic analysis was performed to further in-depth elucidate the mechanisms to salt tolerance. A partial proteomic map of T. halophilus was constructed with a pI at pH 4–7, where most proteins of lactic acid bacteria were located. A total of 120 proteins were identified (Table S2†), and the physico-chemical analysis was also performed (Fig. 3). Based on this proteomic data, comparative proteomic analysis was carried out to investigate the proteins implicated in salt tolerance.4.1. Changes in cell wall and cell membrane during salt stress
Cell wall/membrane play important roles in cellular growth, metabolism, and resistance to environmental stresses, and cells fight against stresses by regulating the structure and compositions of wall/membrane.19 The adaptation of T. halophilus to high salt stress led to important variations in the distribution of membrane fatty acids. Cells treated with 18% NaCl exhibited a significant increase in the levels of unsaturated fatty acids and a decrease in the proportion of saturated fatty acids (Fig. 4 and 5). These results are similar to those reported in other bacteria,31,32 suggesting that modulation of the fatty acids composition is necessary for survival during salt stress. In addition, increase of the ratio of UFA/SFA can protect the cell from other environmental stresses in LAB has also been observed.19,33 Furthermore, higher mean chain length of the membrane fatty acid was observed in T. halophilus shocked by salt stress (Fig. 5), and similar results were also reported in L. casei, Streptococcus gordonii, and Streptococcus salivarius treated by acid stress.19,34Analysis of the proteomic data showed that the expressions of D-alanine-D-alanine ligase (spot 14) and N-acetylmuramic acid 6-phosphate etherase (spot 47), which were involved in the biosynthesis of peptidoglycan were significantly down-regulated when challenged by high salt stress (Fig. 2), and this result was in agreement with that reported by Liu et al.14 Previous researches suggested that peptidoglycan played a positive role in stress resistance under low salt stress, while the synthesis of peptidoglycan was reduced to promote ion transport across extra- and intracellular membranes under high salt condition.14,35
4.2. Accumulation of osmoprotectants upon salt stress
Amino acid metabolism serves a number of physiological roles including intracellular pH control, resistance to stresses, and generation of metabolic energy or redox power.36 Previous researches have indicated that many amino acids or their derivatives may protect cells against salt stress. Zhang et al.11 investigated the effect of glutathione addition on survival of L. lactis during salt stress (5 M NaCl), and the results showed that the presence of 3.2 mM GSH in the medium resulted in a more than 2-log increase in cell survival after 60 min incubation, and greater than 3-log improvement after 2 h. In this study, changes in contents of intracellular amino acids were investigated, and 8 amino acids exhibited significantly difference between cells treated with and without salt stress (Fig. 6), suggesting that these amino acids may contribute to the osmoregulation in T. halophilus. Glycine is the precursor of glycine betaine,7 and higher content of glycine may result in higher production of glycine betaine, and this result is in agreement with that obtained by intracellular glycine betaine determination in Fig. 7.In addition, it was worth noting that the opuAA gene and glycine betaine ABC transporter protein (OpuAA, spot 81) were also significantly up-regulated during salt treatment (Fig. 8 and Table 1). Proline is accumulated by a large number of LAB under osmotic stress as an osmoprotectant including Pediococcus pentosaceus,37 and L. lactis.38 In particular, it can act as a signaling molecule to influence defense pathways and relieve the osmotic stress caused by salinity. In addition, previous data suggested that a negative correlation between salt stress and serine, valine, threonine, and isoleucine was achieved in Synechocystis sp. PCC 6803 via metabolomic analysis,39 and the result was in agreement with our data.
Compatible solutes are low-molecular weight osmoregulatory compounds, including sugars, amino acids, quaternary amines, ectoines or their derivatives.40 Induction of osmolytes in cells can increase protein folding and thereby improve salt tolerance. Accumulation of glycine betaine allows the cells to withstand salt stress and protect cells against dehydration. In this study, the contents of glycine betaine in T. halophilus cells increased with increasing NaCl levels (Fig. 7). These results are in agreement with previous findings confirming salinity induced glycine betaine accumulation.7,38,41,42 In addition, trehalose is a frequent compatible solute in bacteria, fungi, and plants, and the protective role of trehalose in a variety of stresses has been abundantly demonstrated.43,44 In the present study, similar result was also obtained during salt stress, suggesting that trehalose was an important osmoprotectant for T. halophilus in salt adaptation.
4.3. Regulation of cellular metabolism under salt stress
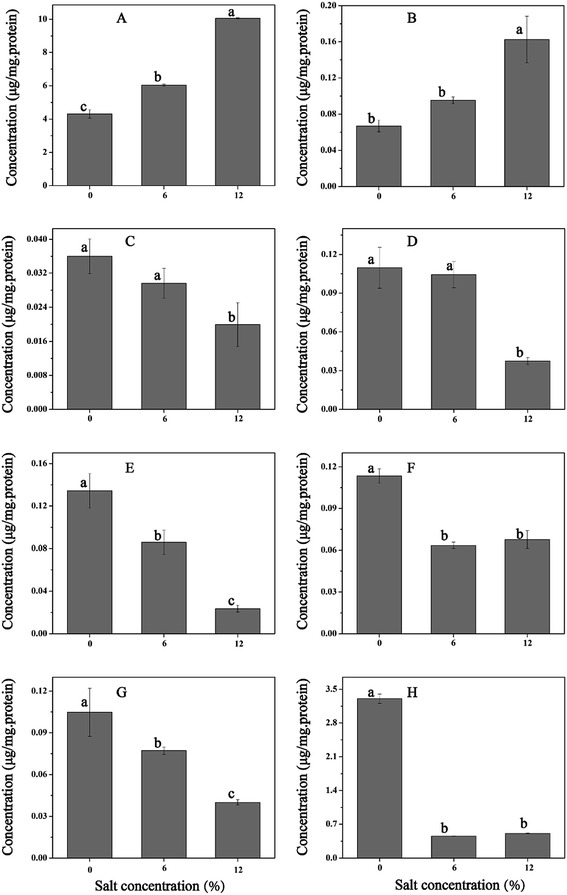
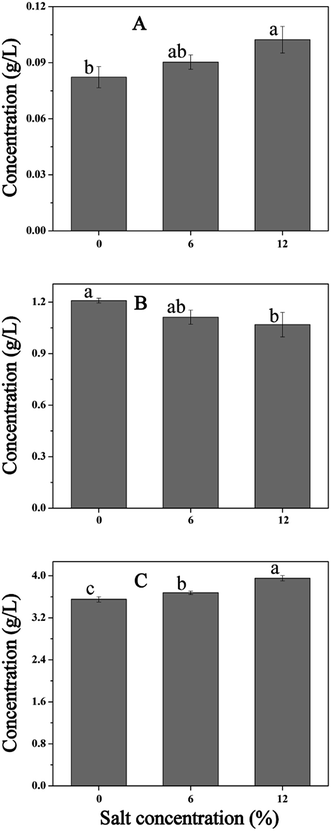
Cellular metabolism plays an important role during the NaCl-induced regulation in cells. For example, carbohydrate metabolism generates ATP to maintain the intracellular micro-environment homeostasis, which includes ion transport, redox balance, and osmoregulation.14 In this study, salt stress led to the overproduction of many proteins involved in cellular metabolism and energy production, especially proteins in glycolysis. The increase in protein expression may be the integrant to overcome the inhibition in cells challenging at high salt condition. Then, the increased flux in cellular metabolism may lead to an increase in ATP production to support ATP-demanding processes such as H+ extrusion and osmoregulation. To further verify these results, we measured the contents of lactic acid, citric acid, and succinic acid (Fig. 9). As is shown, the contents of lactic acid and citric acid increased with the increase of salinity, whereas, the amount of succinic acid decreased with increased NaCl content. As mentioned above, salt stress resulted in the accumulation of proline, and the synthesis of proline requires a continuous supply of the precursor α-oxoglutarate and glutamate. Thus, the increased content of citric acid and decreased content of succinic acid may contribute to the production of proline. Hahne et al.44 performed by proteomic and transcriptomic analysis, which suggested that the enzymes of tricarboxylic acid (TCA) cycle leading to the synthesis of α-oxoglutarate were induced and the reactions from α-oxoglutarate to oxaloacetate were reduced. Moreover, the increased expression of gene AtpD and AtpD protein (spot 105) under salt stress also confirmed this result.4.4. General stress proteins and response factor induced by salt stress
Four general stress response proteins (DnaK, GroEL, SodA, and TrxB) were significantly expressed (p < 0.05) during salt stress. Up-regulation of genes Dnak and GroEL performed by q-PCR also confirmed this result. The proteins Dnak and GroEL are known to protect or repair proteins under stress conditions. DnaK is believed to serve as a “cellular thermometer” that transduces signals to other cellular factors in response to environmental stresses, and it required for stress tolerance.45 The production of DnaK also increased after salt stress in T. halophilus14 and L. lactis.46 Moreover, Sugimoto et al.47 heterologously expressed dnaK from E. coli in L. lactis NZ9000, and improvement of multiple-stress tolerance and lactic acid production was observed. Likely, the overproduction of GroEL under salt stress was also reported in previous researches,14,46 and the GroESL-overproducing L. lactis and L. paracasei exhibited higher tolerance to heat, salt, and butanol stresses.48Both superoxide dismutase (SodA) and thioredoxin reductase (TrxB) are responsible for dealing with imbalances in redox state and reactive oxygen species (ROS). SodA, involved in the defense against ROS was induced during salt stress. Generally, salt stress leads to changes in the osmotic pressure and ionic inequity, which causes production of ROS thereby also triggers an oxidative stress. Interestingly, salt stress induced production of SodA was also detected in Enterobacter sakazakii and Synechocystis sp. strain PCC 6803.49,50 Thus, the overproduction of SodA may protect cells against ROS that might be produced as by-products or accumulate due to respiratory chain impairment or metabolic alterations during stress situations.51 As expected, a significantly higher expression of thioredoxin reductase (TrxB) (p < 0.01) was observed during salt stress in this study, and similar results were also reported previously.14,49
5. Conclusion
In conclusion, a reference proteome map of T. halophilus was established by using a proteomic approach. For the first time we described the proteome of T. halophilus and analyzed the COG, CAI, and GRAVY values of each identified protein compared with the whole theoretical genes coding proteins of T. halophilus. By comparing the proteomic profile and physiological characterization of T. halophilus during high salt condition, we further demonstrated the stress response of cells to defend against salt stress. In response to salt stress, T. halophilus evokes a global regulation and a number of changes take place. These results may help us understand salt tolerance mechanism and help formulate new strategies to enhance the industrial application of this species.Acknowledgements
This study was funded by the National Natural Science Foundation of China (31671849, 31301546).References
- C. Wu, C. Liu, G. He, J. Huang and R. Zhou, Food Sci. Technol. Res., 2013, 19, 855–864 CrossRef CAS.
- W. Roling and H. Van Verseveld, Appl. Environ. Microbiol., 1996, 62, 1203–1207 CAS.
- N. Udomsil, S. Rodtong, S. Tanasupawat and J. Yongsawatdigul, Int. J. Food Microbiol., 2010, 141, 186–194 CrossRef CAS PubMed.
- J. Thongsanit, S. Tanasupawat, S. Keeratipibul and S. Jatikavanich, Japanese Journal of Lactic Acid Bacteria, 2002, 13, 46–52 CrossRef.
- R. Cui, J. Zheng, C. Wu and R. Zhou, Eur. Food Res. Technol., 2014, 239, 321–331 CrossRef CAS.
- J. M. Wood, J. Gen. Physiol., 2015, 145, 381–388 CrossRef CAS PubMed.
- H. Robert, C. Le Marrec, C. Blanco and M. Jebbar, Appl. Environ. Microbiol., 2000, 66, 509–517 CrossRef CAS PubMed.
- M. E. Guerzoni, R. Lanciotti and P. S. Cocconcelli, Microbiology, 2001, 147, 2255–2264 CrossRef CAS PubMed.
- C. Kohler, R. F. Lourenço, J. Bernhardt, D. Albrecht, J. Schüler, M. Hecker and S. L. Gomes, BMC Microbiol., 2015, 15, 1–15 CrossRef CAS PubMed.
- C. Rubianolabrador, C. Bland, G. Miotello, P. Guérin, O. Pible, S. Baena and J. Armengaud, J. Proteomics, 2014, 97, 36–47 CrossRef CAS PubMed.
- Y. Zhang, Y. Zhang, Y. Zhu, S. Mao and Y. Li, Appl. Environ. Microbiol., 2010, 76, 3177–3186 CrossRef CAS PubMed.
- C. Wu, J. Zhang, G. Du and J. Chen, Bioresour. Technol., 2013, 143, 238–241 CrossRef CAS PubMed.
- X. Dong, B. Tian, S. Dai, T. Li, L. Guo, Z. Tan, Z. Jiao, Q. Jin, Y. Wang and Y. Hua, PLoS One, 2014, e10 Search PubMed.
- L. Liu, L. Si, X. Meng and L. Luo, J. Ind. Microbiol. Biotechnol., 2015, 42, 601–616 CrossRef CAS PubMed.
- G. He, C. Wu, J. Huang and R. Zhou, Process Biochem., 2016, 51, 213–219 CrossRef CAS.
- T. Michelson, K. Kask, E. Jõgi, E. Talpsep, I. Suitso and A. Nurk, Enzyme Microb. Technol., 2006, 39, 861–867 CrossRef CAS.
- M. Jebbar, G. Gouesbet, S. Himdi-Kabbab, C. Blanco and T. Bernard, Arch. Microbiol., 1995, 163, 380–386 CrossRef CAS.
- S. S. T. Hua, B. J. Hernlem, W. Yokoyama and S. B. L. Sarreal, World J. Microbiol. Biotechnol., 2015, 31, 729–734 CrossRef CAS PubMed.
- C. Wu, J. Zhang, M. Wang, G. Du and J. Chen, J. Ind. Microbiol. Biotechnol., 2012, 39, 1031–1039 CrossRef CAS PubMed.
- J. Zheng, R. Liang, L. Zhang, C. Wu, R. Zhou and X. Liao, Food Res. Int., 2013, 54, 660–666 CrossRef CAS.
- C. Wu, G. He and J. Zhang, J. Ind. Microbiol. Biotechnol., 2014, 41, 1533–1540 CrossRef CAS PubMed.
- S. Mao, Y. Luo, T. Zhang, J. Li, G. Bao, Y. Zhu, Z. Chen, Y. Zhang, Y. Li and Y. Ma, J. Proteome Res., 2010, 9, 3046–3061 CrossRef CAS PubMed.
- A. Guillot, C. Gitton, P. Anglade and M. Y. Mistou, Proteomics, 2003, 3, 337–354 CrossRef CAS PubMed.
- K. Hiller, M. Schobert, C. Hundertmark, D. Jahn and R. Münch, Nucleic Acids Res., 2003, 31, 3862–3865 CrossRef CAS PubMed.
- R. Wu, X. Song, Q. Liu, D. Ma, F. Xu, Q. Wang, X. Tang and J. Wu, Ann. Microbiol., 2016, 1–8 Search PubMed.
- K. J. Livak and T. D. Schmittgen, Methods, 2001, 25, 402–408 CrossRef CAS PubMed.
- K. Fukami, Y. Funatsu, K. Kawasaki and S. Watabe, J. Food Sci., 2004, 69, 45–49 Search PubMed.
- Y. Tanaka, J. Watanabe and Y. Mogi, Food Microbiol., 2012, 31, 100–106 CrossRef CAS PubMed.
- R. Wu, W. Wang, D. Yu, W. Zhang, Y. Li, Z. Sun, J. Wu, H. Meng and H. Zhang, Mol. Cell. Proteomics, 2009, 8, 2321–2338 CAS.
- J. Yuan, L. Zhu, X. Liu, T. Li, Y. Zhang, T. Ying, B. Wang, J. Wang, H. Dong and E. Feng, Mol. Cell. Proteomics, 2006, 5, 1105–1118 CAS.
- S. I. Allakhverdiev, Y. Nishiyama, I. Suzuki, Y. Tasaka and N. Murata, Proc. Natl. Acad. Sci. U. S. A., 1999, 96, 5862–5867 CrossRef CAS.
- C. Lopez, H. Heras, H. Garda, S. Ruzal, C. Sanchez-Rivas and E. Rivas, Int. J. Food Microbiol., 2000, 55, 137–142 CrossRef CAS PubMed.
- Y. Wang, G. Corrieu and C. Béal, J. Dairy Sci., 2005, 88, 21–29 CrossRef CAS PubMed.
- E. M. Fozo, J. K. Kajfasz and R. G. Quivey, FEMS Microbiol. Lett., 2004, 238, 291–295 CrossRef CAS PubMed.
- K. J. Cheung, V. Badarinarayana, D. W. Selinger, D. Janse and G. M. Church, Genome Res., 2003, 13, 206–215 CrossRef CAS PubMed.
- M. Fernández and M. Zúñiga, Crit. Rev. Microbiol., 2006, 32, 155–183 CrossRef PubMed.
- A. Baliarda, H. Robert, M. Jebbar, C. Blanco, A. Deschamps and C. L. Marrec, Int. J. Food Microbiol., 2003, 84, 13–20 CrossRef CAS PubMed.
- D. Obis, A. Guillot, J. C. Gripon, P. Renault, A. Bolotin and M. Y. Mistou, J. Bacteriol., 1999, 181, 6238–6246 CAS.
- J. Wang, X. Zhang, M. Shi, L. Gao, X. Niu, R. Te, L. Chen and W. Zhang, Funct. Integr. Genomics, 2014, 14, 431–440 CrossRef CAS PubMed.
- B. Kempf and E. Bremer, Arch. Microbiol., 1998, 170, 319–330 CrossRef CAS PubMed.
- M. Jebbar, C. Blanco and C. Le Marrec, Curr. Microbiol., 2003, 47, 347–351 CrossRef.
- A. Metris, S. M. George, F. Mulholland, A. T. Carter and J. Baranyi, Appl. Environ. Microbiol., 2014, 80, 4745–4756 CrossRef CAS PubMed.
- S. B. Leslie, E. Israeli, B. Lighthart, J. H. Crowe and L. M. Crowe, Appl. Environ. Microbiol., 1995, 61, 3592–3597 CAS.
- H. Hahne, U. Mäder, A. Otto, F. Bonn, L. Steil, E. Bremer, M. Hecker and D. Becher, J. Bacteriol., 2010, 192, 870–882 CrossRef CAS PubMed.
- P. Carranza, A. Grunau, T. Schneider, I. Hartmann, A. Lehner, R. Stephan, P. Gehrig, J. Grossmann, K. Groebel, L. E. Hoelzle, L. Eberl and K. Riedel, Proteomics, 2010, 10, 3248–3261 CrossRef CAS PubMed.
- M. Kilstrup, Appl. Environ. Microbiol., 1997, 63, 1826–1837 CAS.
- S. Sugimoto, C. Higashi, S. Matsumoto and K. Sonomoto, Appl. Environ. Microbiol., 2010, 76, 4277–4285 CrossRef PubMed.
- C. Desmond, G. F. Fitzgerald, C. Stanton and R. P. Ross, Appl. Environ. Microbiol., 2004, 70, 5929–5936 CrossRef CAS PubMed.
- S. Fulda, S. Mikkat, F. Huang, J. Huckauf, K. Marin, B. Norling and M. Hagemann, Proteomics, 2006, 6, 2733–2745 CrossRef CAS PubMed.
- K. Riedel and A. Lehner, Proteomics, 2007, 7, 1217–1231 CrossRef CAS PubMed.
- G. Cacace, M. F. Mazzeo, A. Sorrentino, V. Spada, A. Malorni and R. A. Siciliano, J. Proteomics, 2010, 73, 2021–2030 CrossRef CAS PubMed.
Footnote |
| † Electronic supplementary information (ESI) available. See DOI: 10.1039/c6ra22521g |
| This journal is © The Royal Society of Chemistry 2017 |

