
 Open Access Article
 This Open Access Article is licensed under a Creative Commons Attribution-Non Commercial 3.0 Unported Licence
Mathematical modeling of gas desorption from a metal–organic supercontainer cavity filled with stored N2 gas at critical limits†
Wendi Sapp a,
Brendan Giffordb,
Zhenqiang Wanga and
Dmitri S. Kilin*ab
a,
Brendan Giffordb,
Zhenqiang Wanga and
Dmitri S. Kilin*ab
aDepartment of Chemistry, University of South Dakota, Vermillion, South Dakota, USA. E-mail: Dmitri.Kilin@ndsu.edu
bDepartment of Chemistry and Biochemistry, North Dakota State University, Fargo, North Dakota, USA
First published on 13th February 2017
Abstract
Metal–organic supercontainer (MOSC) molecules are ideal candidates for gas storage applications due to their construction with customizable ligands and tunable cavity and window sizes, which are found to be elastic in nature. Force field molecular dynamics (MD) are used to evaluate the utilization of MOSCs as nanoporous structures for gas storage. A MOSC, with nitrogen gas molecules filling the cavity, progresses through MD and releases gas molecules by applying temperature to the MOSC. It is the MOSC's elasticity which is responsible for the desorption of guests at elevated temperatures. Data obtained from MD serves as a guide for the derivation of analytical equations that can be used to describe and explain the mechanism of gas desorption from within the cavity. Mathematical modeling of gas desorption from the center cavity can provide a method of predicting MOSC behavior for a broader range of pressures and temperatures, which is challenging for direct atomistic modeling. The utilization of MD can provide data for a wide variety of properties and processes in various materials under different conditions for a broad range of technology-related applications.
1. Introduction
Global energy demands are continually rising with an increasing population. Current estimates indicate that only 11% of energy globally is generated from renewable sources.1 Full utilization of clean and renewable fuel sources requires a method of storing and transporting the resulting energy, which is not without difficulty. One potential energy storage medium which could overcome these barriers is hydrogen. Hydrogen has the highest gravimetric energy density of any known fuel.2 However, under ambient conditions hydrogen, has a very low density3,4 which requires storage at very high pressures resulting in safety and cost concerns.5 The safety concerns are valid for any stored gas at high pressures, even if the gas is considered to be inert.Due to the limitations of high-pressure gas storage methods, a great deal of research focuses on the storage of hydrogen by molecular adsorption to substrates. One class of materials that has been considered is that of nanoporous sorbents which take advantage of weak van der Waals-type forces to result in the physisorption of gasses to the surface. Because of this, release temperatures6 are lower than those required by DOE standards7 and the observed hydrogen capacity in these materials is very low.8 Because of this shortcoming, efforts should be made to utilize materials that do not rely on van der Waals forces as the primary mechanism of gas adsorption, such as the material used by the authors, which, as hypothesized, does not rely on such interactions: encapsulating the gas molecule will partially solve the issue of poor adsorption caused by the presence of only weak van der Waals interactions. Recently, there have been contributions to the field of gas storage with the use of promising materials such as carbon nanotubes,9 graphenes,10 hollow spheres,11 zeolites,12 and MOFs13 either with or without a molecular simulation.
A new and particularly promising class of sorbents, which have been shown to adsorb gasses, are metal–organic supercontainers (MOSCs).14 These sorbents exemplify a new brand of container molecules. MOSCs allow for varied geometric placements of the “building blocks”, which include metal ions, carboxylate linkers, and sulfonylcalix[4]arenes, permitting a highly modular design, not unlike the related metal–organic framework (MOF) materials.15 However, a key characteristic that distinguishes MOSCs from MOFs is that MOSCs are discrete units rather than infinite polymeric structures, which allows many advantages including not only the relative ease of materials functionalization and fabrication but also the convenience of several computational manipulations. Each supercontainer molecule possesses multiple cavities, internal and external, and has variable geometry pre-determined by judicious selection of the carboxylate linker building blocks. It is because of their tunable character that MOSCs can be utilized in a wide range of applications, including gas storage. A MOSC, very similar to the one modeled here, has been shown to adsorb gasses at a higher-than-expected capacity.14
Atomistic details of gas adsorption and desorption to/from MOFs are typically studied by Monte Carlo Grand Canonical (MCGC) simulations where the nanopores of the host are filled by a random number of gas molecules placed at random positions16 or by molecular dynamics where details of propagation and redistribution of gas molecules inside the host material can be inspected.17 Molecular dynamics (MD) simulations are an invaluable tool in the computational chemistry field. Two centuries ago, the motions of gas molecules were theorized. Today, we can deterministically follow the law of motion for each molecule in an ensemble, representing interfaces of different phases: solid and gas or solid and liquid. Within each atomistic model, computer codes and software can describe interatomic forces with different approaches. Molecular dynamics simulation can provide data, as well as visual and qualitative information. It is possible to observe trends in the motion of atoms. Snapshots of the simulation can help to relate observations on how nuclear configuration changes over time. In the infinite MOF, MD shows only redistribution of gas inside, but for a finite MOSC with defined borders, MD can provide dynamics of gas leaving the container.17 Ab initio MD (AIMD) is able to describe models composed of any elements, for any type of chemical bond character, including bond breakage and formation in ground state or in optically excited state.18 The main drawback of AIMD is a high numerical expense. In contrast, force field-based MD (FFMD) are of extremely low cost for numerical resources. However, they are typically bound to a specific list of (lighter) elements and specific type of bonds. Bond breakage and formation is not available in typical FFMD, with the exception of ReaxFF.19
For metal nanocatalysts, the rate of sorption was estimated atomistically, by analysis of the time of abrupt elongation of distance from desorbing molecule to adsorbing host.20 Ultimately, in this paper, a goal of this modeling is to employ spectral monitoring21 of binding dynamics and identification of mechanisms and trends for gas storage applications. The ability to predict MOSC behavior in the presence of gas is a logical first step. Gas desorption time is used as a simple measurable that provides insight into host–guest interactions and binding affinity, which is relevant to a substrate's ability to serve as a gas storage apparatus. Gas desorption time is a reasonable signature of the intermolecular interactions for the desorption regime. However, the description of the adsorption process and mechanism of placing storable molecules into the container may need different characterization tools: placement within and removal from the container may occur at different temperature and pressure regimes.
Several variations of parameters (such as MOSC atom mobility, window size) were considered in order to test multiple hypotheses regarding gas desorption ability. Some aspects investigated were: (i) the existence of a minimal desorption temperature, (ii) the influence of the rigidity/elasticity of the MOSC on desorption rates, and (iii) the relationship of the window and cavity sizes with gas escape rates. Additionally, hydrogen gas, being the lightest of the gasses, may not appropriately represent other types of gasses as a model system. Among the more commonly used gasses (H2, CO2, O2, N2, CO, and C2H2), nitrogen gas has a middle-of-the-road kinetic diameter, at 364 pm. The previously mentioned gasses range from 289–390 pm, with an average kinetic diameter of 350 pm.22 Over and above the kinetic diameter, nitrogen gas's molecular weight is nearly equivalent to the average of the above gasses' molecular weight, 28 and 27 amu, respectively. Consequently, nitrogen gas was chosen for use in this case study. The mid-range mass and size of the molecule, as well as its inert character, allow the observations of this research to be extrapolated to other types of gasses and applications. Complementary gasses and applications that could benefit from this study are carbon dioxide gas capture from industrial flues,23 oxygen gas stabilization during storage,24 and ethylene sequestration to prevent food spoilage.25
2. Methods
The computational exploration of gas storage efficiency includes three parts: (a) overview of molecular dynamics procedure and observables and analysis of MD trajectories by Arrhenius' law, (b) analytical equation for desorption rate, and (c) details of the numerical implementation of these methods.2.a Molecular dynamics and observables
Forces, , act on each atom, I, to determine the acceleration that will be used in the Newton equation of motion,
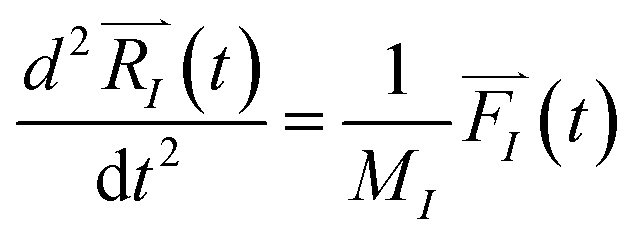 | (1) |
In order to solve the eqn (1), one needs specific initial conditions 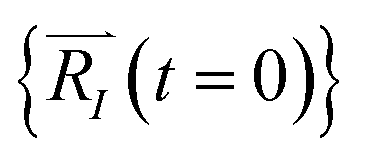 and momenta
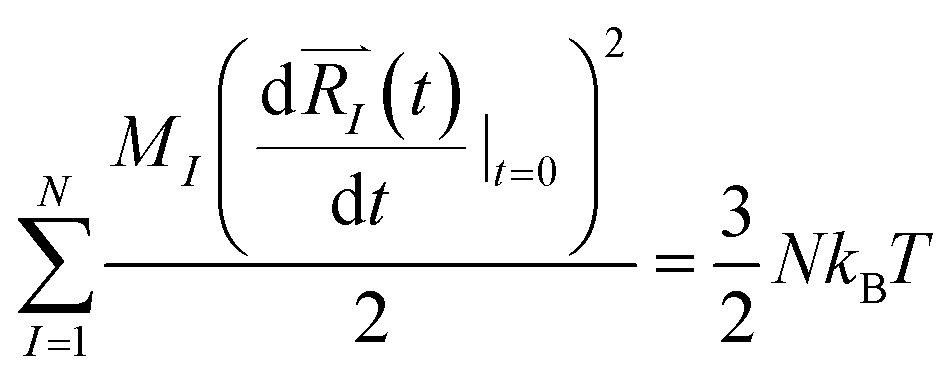
 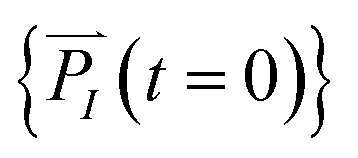 of each ion/atom of the model. Positions are taken from optimized geometry. Momenta are found as follows. The velocities of all the atoms were rescaled to mimic a constant temperature during the MD process in order to maintain a constant kinetic energy. This is shown in the following equation, where MI and
  represent the mass and initial velocity of the Ith nucleus, respectively, N is the number of nuclei, kB is the Boltzmann constant, and T is the temperature.
 | (2a) |
Upon solving eqn (1) with initial conditions from eqn (2a), MD trajectories  are explored for distances between each atom and the center of mass of the whole model,
 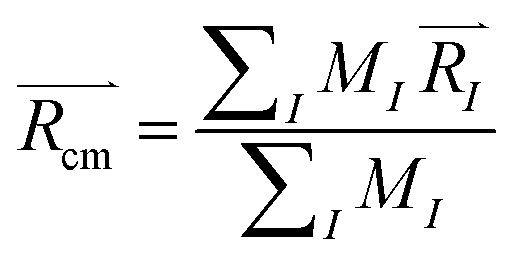 . For each atom I, belonging to a N2 gas molecule, the initial position resides within the container, i.e.
 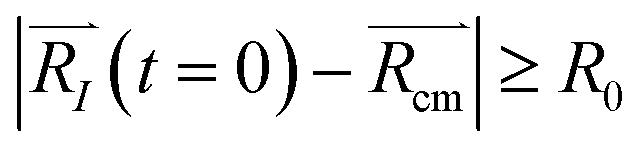 , with R0 representing the size/diameter of the MOSC cavity. As time passes, a gas molecule, and atoms which make up the molecule, may approach the inner boundary of the container, i.e.
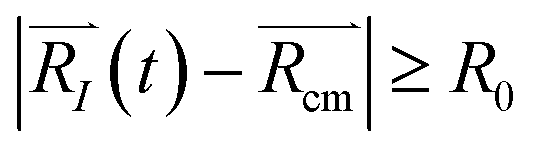
 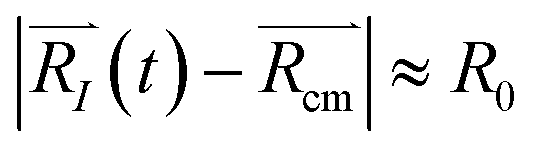 . Later on, such a gas molecule and its atoms may continue motion away from the center of the container and reach space outside of the container.
 | (2b) |
Eqn (2b) corresponds to an ion leaving the container, and can be numerically solved with time as an unknown. The solution, t = τ and t > τ allows for the quantification of the instant of time when desorption occurs. Eqn (2b) becomes true for t > τ. In other words, the distance is recorded at the time when the ion is desorbed. See eqn (S1)–(S5)† for more information.
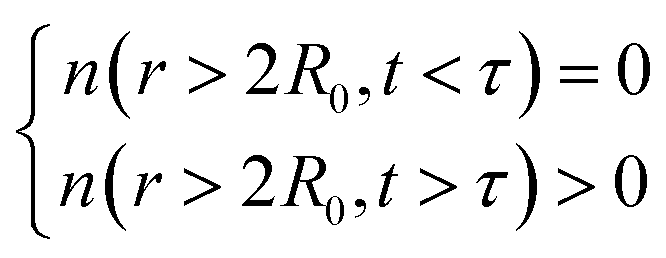
In order to monitor multiple desorption events, the authors employed a pair correlation function, defined as the number of nuclei, maintaining a given inter-nuclear distance
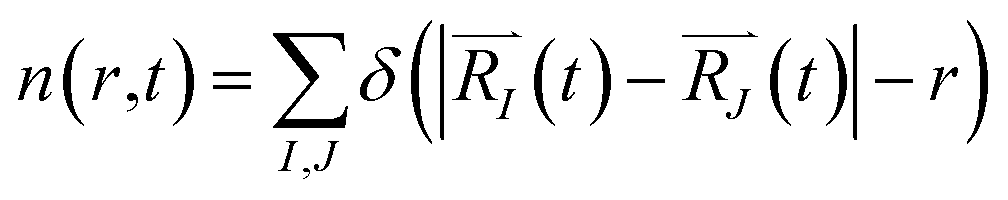 | (2c) |
The function n(r,t) gains a peak from each pair of nuclei I and J, which contribute at the argument value equal to the distance between these nuclei 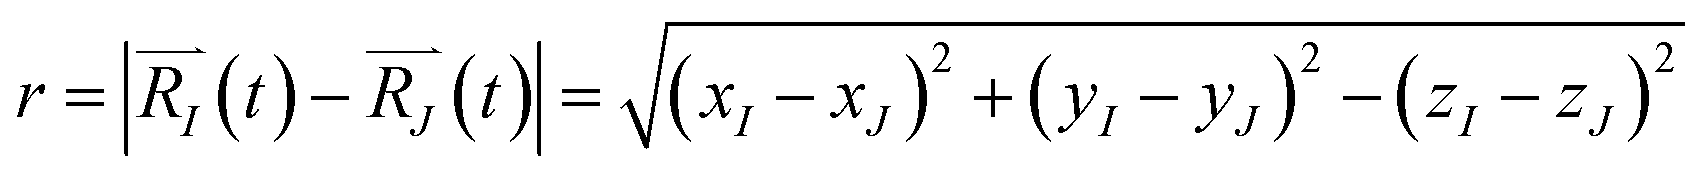 . Eqn (2c) is applied to I, J counting only the stored or released gas molecules and not including the container. The distribution n(r,t) projects 3-dimensional dynamics into a 1-dimensional distribution. Nuclear configurations before and after an escape correspond to qualitatively different n(r,t) functions. Specifically, before an escape, n(r,t)|r>R0 = 0 and after an escape n(r,t)|r>R0>0.
This function shows
 | (2d) |
We anticipate that the subsystem of gas molecules maintains the center of mass at a fixed position. Otherwise, if all stored molecules were to escape through the same window, this would be the observed behavior of jet propulsion and not a container with multiple windows.
The rate of nitrogen desorption is calculated by the inverse of desorption time,
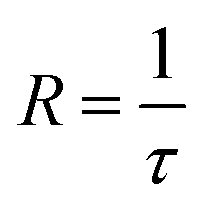 | (3) |
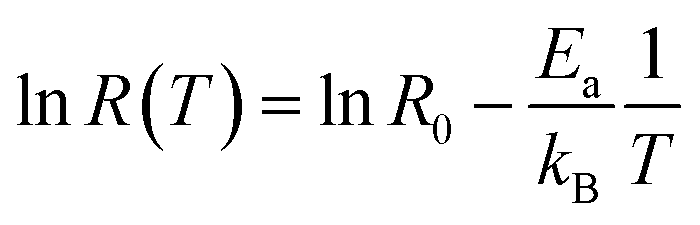
Such rates are stored again and again for different MD trajectories. Pairs of data points {T1, R1}, {T2, R2}, etc. for temperatures and rates are accumulated. For understanding general trends these data points are fit into a law, R = R(T).20 Rate, explored as a function of temperature, R(T), can be calculated with Arrhenius' Law equation, where the activation energy, Ea, and initial rate, R0 are incorporated.
| R(T) = R0e−Ea/kBT | (4) |
This equation describes an accepted relationship between rates and temperature and allows for the calculation of activation energy. The slope of a 1/T vs. ln(R) graph yields a linear relationship, from which the activation energy may be extracted.
 | (5a) |
For two specific temperatures T1 and T2, and corresponding rates R1(T1) and R2(T2), the activation energy is found as
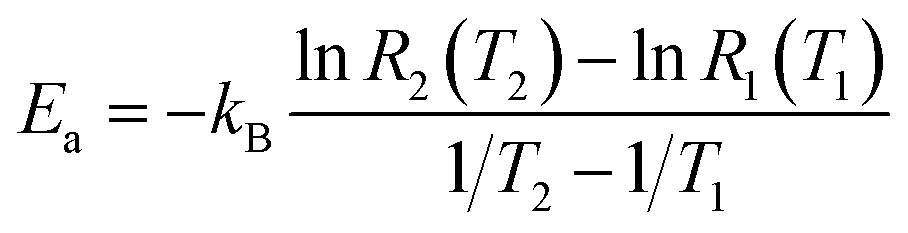 | (5b) |
2.b Equation for rate
An equation was derived to describe the behavior of the gas molecules escaping the cavity. A spherical cavity of diameter DC has Ñ = 12 circular/round windows of diameter DW. This cavity is filled with N number of nitrogen molecules, each of which has a linear velocity of the absolute value of v. The velocity, v, of N2 can be expressed based on kinetic energy with the Boltzmann constant, kB, temperature, T, and mass, m
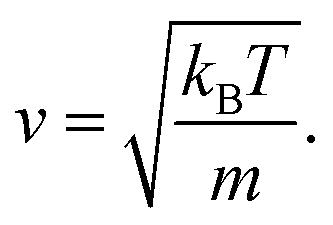 | (6) |
The time, t, of a flight across the diameter of the cavity, DC, can be written as
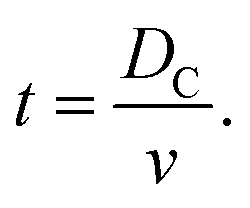 | (7) |
The frequency of hits, f, of N2 molecules into the inner wall of the spherical cavity is the inverse of time-of-flight multiplied by the number of gas molecules, N,
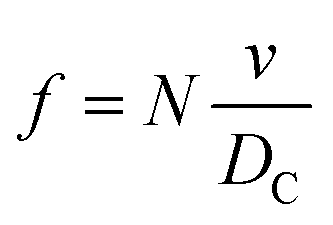 | (8) |
If the gas molecule passes through the window, it is defined as an escape, as introduced in eqn (2b). Using a ratio of the combined areas of all windows and the surface of the cavity, A = 12WA/(CA − 12WA), the rate of desorption is given by
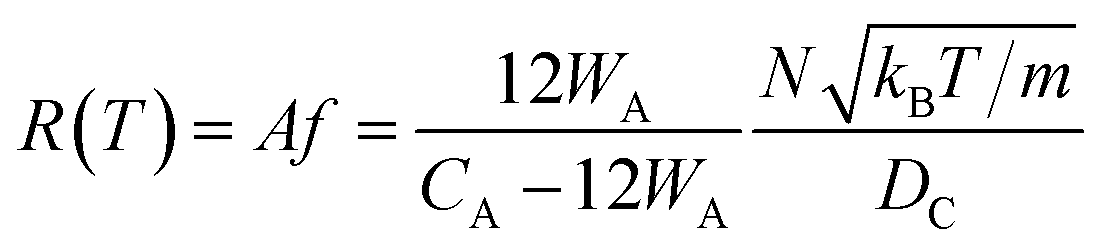 | (9) |
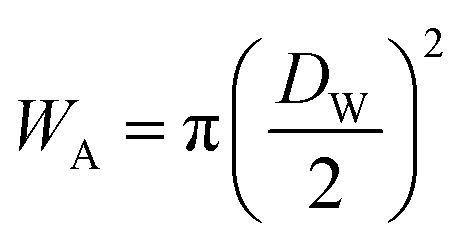 and
and 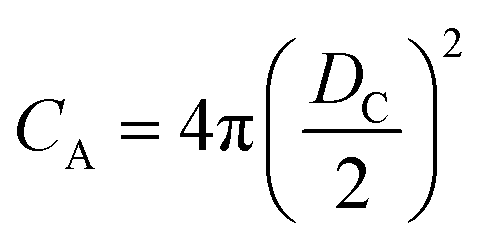 at zero Kelvin, where DW and DC are the diameters of a window and cavity, respectively. With substitutions for the diameters of the cavity and windows, eqn (9) becomes
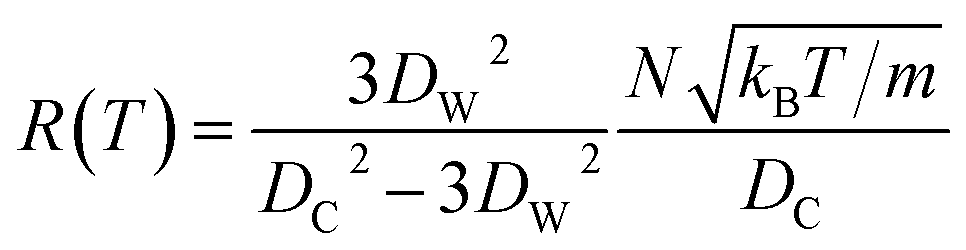 | (10) |
In this approximate equation, the sizes of the cavity and windows remain constant at any value of temperature, therefore, the above equation is termed the ‘static ballistic kinetics of gas escape’. However, the window and cavity sizes were determined to be dependent upon temperature, therefore a linear relationship is assumed as follows
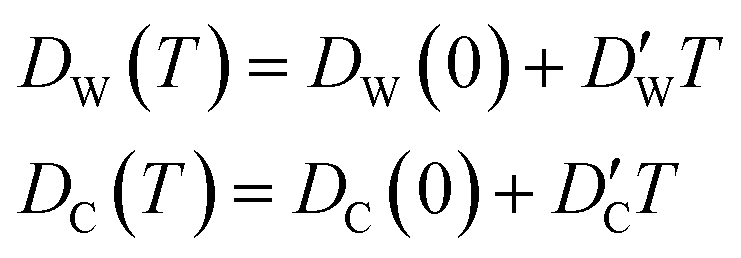 | (11) |
 and
and  stand for their linear thermal expansion coefficients (see ESI†). These constants are obtained by fitting the geometry the MOSC in force field molecular dynamics at a range of finite temperatures. Eqn (10) with the inclusion of a temperature dependence of the windows and cavity sizes is termed the ‘temperature-dependent ballistic kinetics of gas escape’ as follows:
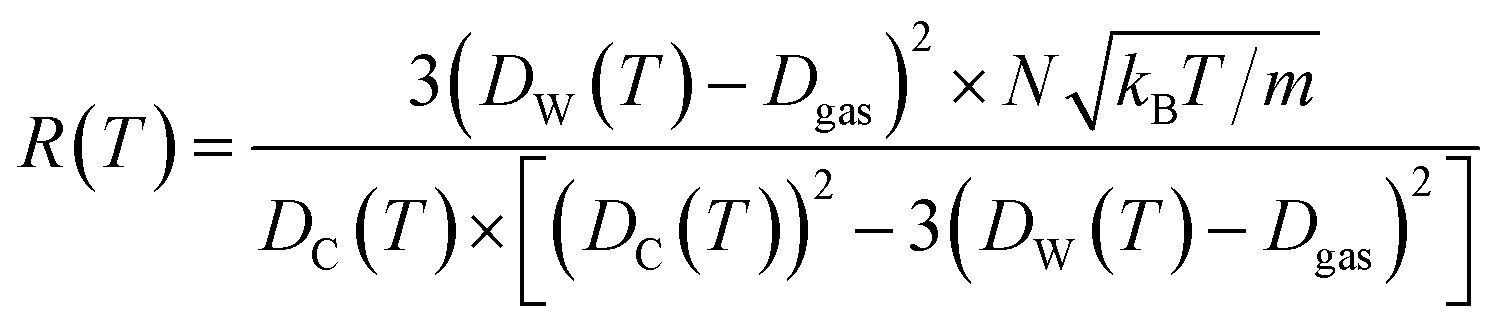 | (12) |
The Dgas term in the above equation is the subtraction of the approximate size of the stored gas molecule. Finally, additional corrections were made to the temperature dependent ballistic kinetics equations to maximize correlation with the observed behavior. The following equation is termed the ‘corrected temperature-dependent ballistic kinetics of gas escape’.
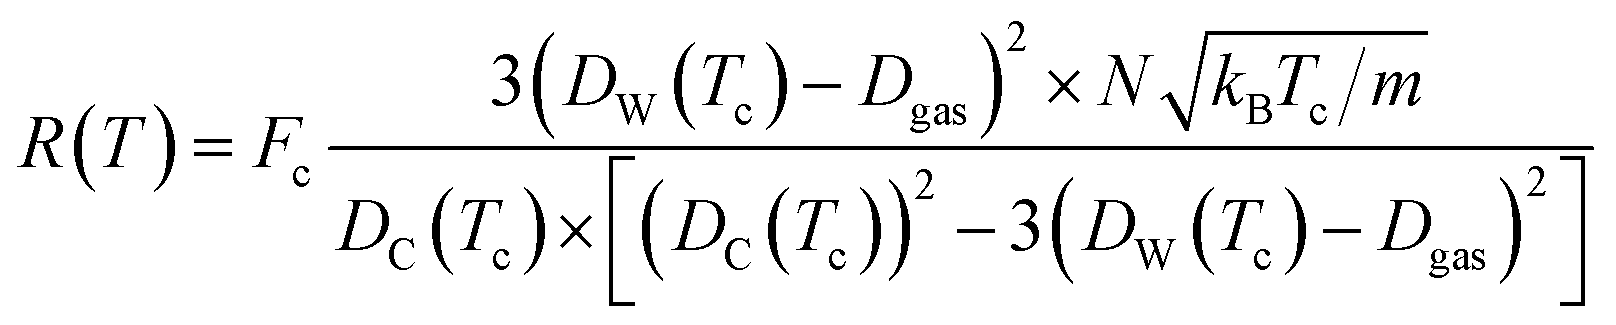 | (13) |
The differences between the previous two equations are found in the Fc term which is a correction factor for atomic interaction, and the Tc = T + ![[T with combining tilde]](https://www.rsc.org/images/entities/i_char_0054_0303.gif) term, which is a corrected temperature and allows for an observed “warm-up” period during molecular dynamics simulations. Fc and are obtained by fitting procedures.
term, which is a corrected temperature and allows for an observed “warm-up” period during molecular dynamics simulations. Fc and are obtained by fitting procedures.
2.c Numerical implementation of methods
X-ray crystallographic data14 were used to obtain structural information for the MOSC. Then the MOSC was filled with nitrogen molecules to a certain density. The inside pressure induced by the filling of the cavity with gas is taken into account during the molecular dynamics simulation, but during mathematical modeling, the gas molecules are treated as an ideal gas. Additional approximations are included in the MOSC molecule's geometry, representing a cavity by a sphere with circular windows. Furthermore, the rotation of the gas molecules and quantum effects are neglected in the analytic equation for the rate. Once the MOSC model was built and the nitrogen gas molecules were inserted into the cavity, molecular dynamics was run over a range of temperatures. The time interval required for one gas molecule to desorb, or escape, from the cavity, was recorded. Molecular mechanics simulations were performed using HyperChem software26 with the MM + force field27 and a time step of 0.5 fs. The authors surveyed various force field parameters (such as MM, MM2, Amber) but ultimately chose the MM + force field due to its simplicity while maintaining accuracy. Expanded force fields made specifically for large biomolecules were found to be unnecessary for the gas–container interactions. Each N2 molecule is modeled by a pair of nuclei interacting with each other by a potential energy function corresponding to an N–N bond. No net charges are considered for gas molecules. Case studies for a range of densities of stored N2 molecules were explored. This range of values of density above and below the typical density of liquid nitrogen (0.64 g mL−1 ≤ ρ ≤ 1.45 g mL−1). Models prepared with an extremely high density of stored gas are considered first, as an exploration of a limiting case and protocol development. Calculations at limiting conditions are made as a proof of concept with lower ranges of density to follow.3. Results and discussion
The general structure of the MOSC is shown in Fig. 1a. The particular MOSC used in this simulation is comprised of six tetranuclear complexes. A tetranuclear complex is defined as a sulfonylcalix[4]arene which has four cobalt atoms attached to its hydroxyl groups. These tetranuclear complexes are connected by eight 1,3,5-benzenetricarboxylate ligands, leading to an overall octahedral geometry of the MOSC. Reported by Dai, et al., the inner cavity of the MOSC has an estimated volume of 0.55 nm3 with windows to the cavity measuring 1.0 Å × 2.3 Å.14 The inner cavity of a MOSC is first filled with N = 16–32 N2 gas molecules and has an initial internal pressure estimated in the range of 600–1290 bar, at room temperature. It is worth noting that the typical pressure capacity of a gas storage tank is, at most, 1000 bar, but typically are found in the range of 2 to 200 bar. This research was carried out under higher pressures in order to reduce computational resources, as an increase in pressure inside the MOSC leads to an increase in the gas escape rate, which lessens the amount of time spent in the simulation. Depicted in Fig. 1b are the simplifications made when describing the MOSC, such as geometric shapes used as analogs for MOSC features. Fig. 1c depicts the gas molecules without the container molecule. This is used when performing some calculations. Finally, in Fig. 1d, the model consisting of a MOSC and gas molecules can be seen, as well as a close-up so that a clearer understanding of the boundary which the MOSC cavity creates (in a black dashed line) may be appreciated.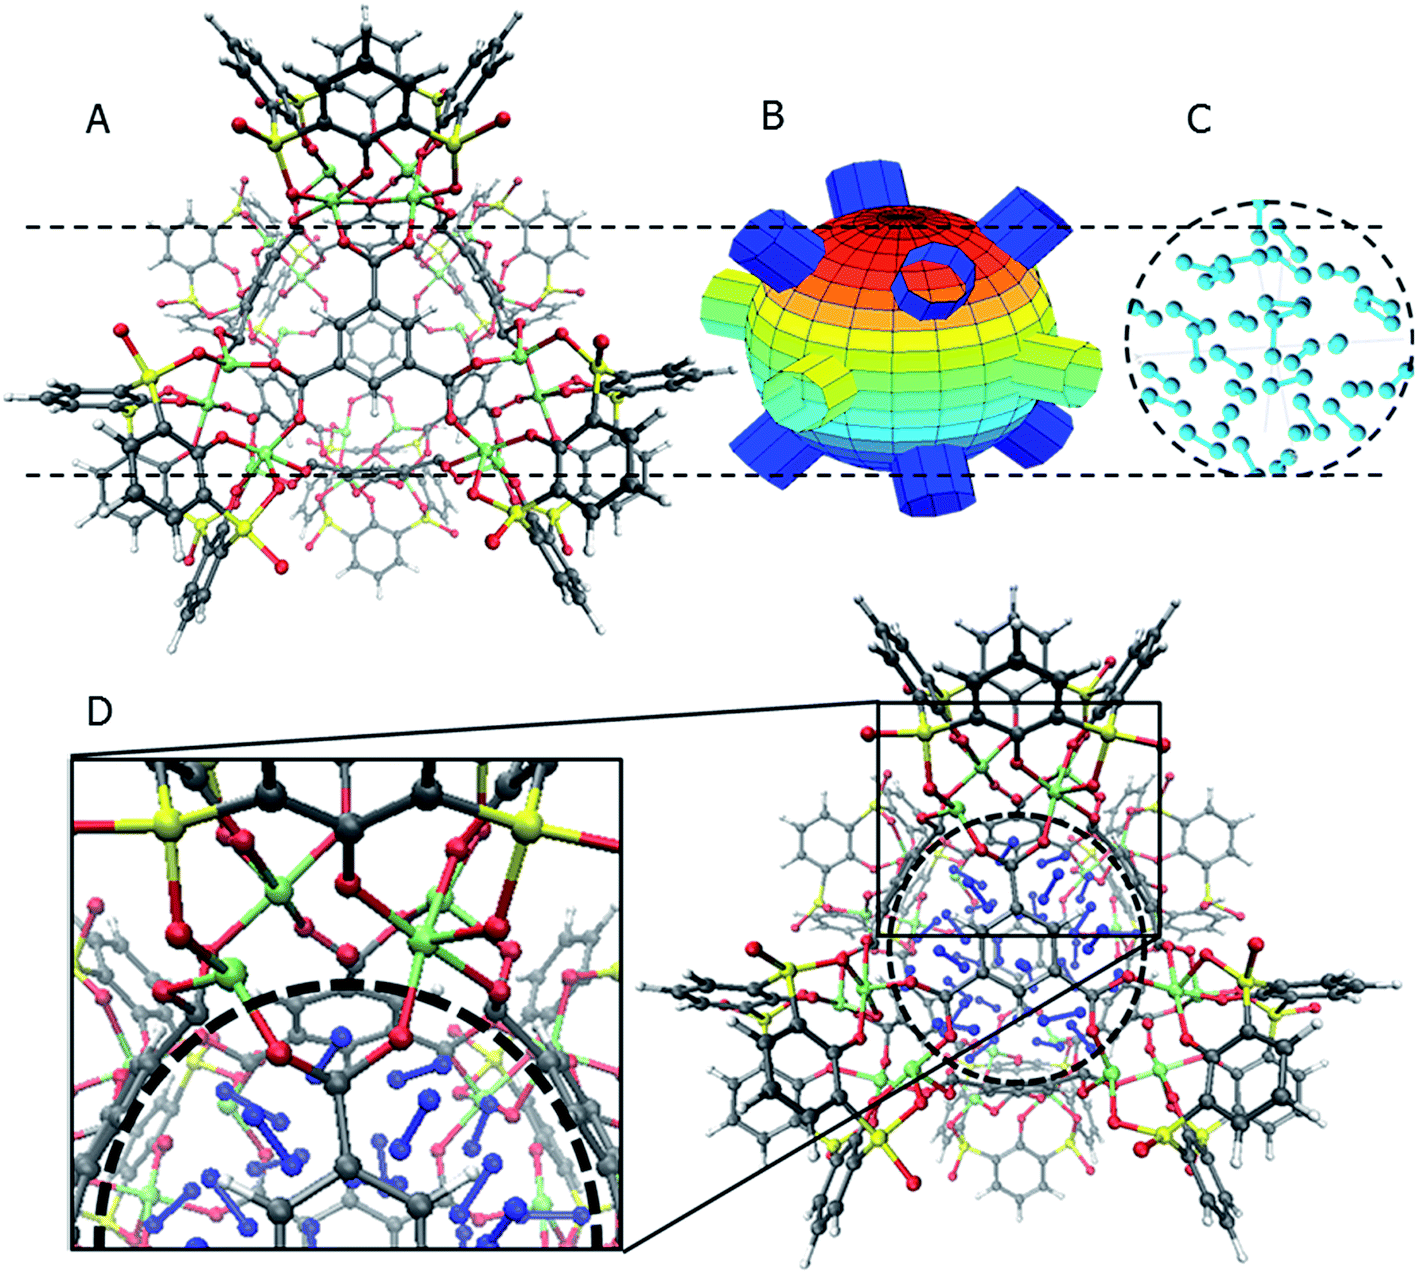 | ||
| Fig. 1 The MOSC and placement of the nitrogen atoms. The color designations for the atoms are gray for carbon, red for oxygen, yellow for sulfur, green for cobalt, blue for nitrogen, and white for hydrogen. Panel (A) The MOSC molecule. Panel (B) The center cavity of the MOSC is approximated by using a sphere. The windows to the cavity are simulated by circles or short cylinders. Panel (C) Placement of nitrogen molecules inside the cavity. Panel (D) A zoomed-in view of the specific part of the aggregate for vigilant following of the gas desorption dynamics in molecular simulations. | ||
Three approaches were considered for the modeling of gas desorption from a MOSC cavity: (i) force-field molecular dynamics simulations, (ii) the existing Arrhenius rate equation, and (iii) a derived mathematical description based on the ballistic kinetics of a gas. First, force field molecular dynamics simulations were utilized to measure gas desorption rates, by eqn (3). Data are obtained from the simulations over a range of temperatures (100–3000 K) in order to extract the activation energy, using eqn (5), which is required for the Arrhenius model. Lastly, starting with approximate expressions for particle velocity and movement across the inner cavity, gas desorption rates can be described by eqn (10). Temperature corrections for window and cavity size were implemented, as seen in the modifications to eqn (12). Eqn (10) and (12) can be used for analyzing the mechanism of desorption and predicting the rates in the regimes where an atomistic MD approach is prohibitively expensive. These three approaches will be discussed in more detail.
In Fig. 2, snapshots of the molecular dynamics trajectory are provided, at a temperature of 250 K. Detailed snapshots with finer time resolution are available in the ESI Fig. S1† and online.28 Starting at time t = 0, it is possible to see that the MOSC is filled with 32 N2 molecules. As the simulation moves toward time t = 80 fs, a gas molecule is seen peeking out a window. This is classified as desorption. Finally, at time t = 200 fs, the molecule has completely left the cavity. The left panels of Fig. 2 allow rigorous quantification of the time of desorption. Trajectories of all nitrogen gas atoms ![[R with combining right harpoon above (vector)]](https://www.rsc.org/images/entities/i_char_0052_20d1.gif) I(t) with respect to the center of mass cm are plotted as a function of time. At t = 0, all Ith nitrogen gas atoms are removed from the center of mass to the distance smaller than the cavity radius, |I(t = 0) − cm| < R0. At the initial time, the nitrogen atoms can be ordered according to their distance from the center of mass, shown in eqn (S1).† As time passes, some of the nitrogen atoms and molecules move away from the center of mass. At a specific time t′ one of the atoms starts to penetrate through the cavity wall, as described in eqn (S2).† At later time t > t′, one of the atoms leaves the cavity, in eqn (S3).† Later, at time t′′ the conjugated nitrogen atom belonging to the same N2 diatomic molecule crosses the border, as presented in eqn (S4),† and then departs further away from the cavity wall in a fashion described by eqn (S5).†
I(t) with respect to the center of mass cm are plotted as a function of time. At t = 0, all Ith nitrogen gas atoms are removed from the center of mass to the distance smaller than the cavity radius, |I(t = 0) − cm| < R0. At the initial time, the nitrogen atoms can be ordered according to their distance from the center of mass, shown in eqn (S1).† As time passes, some of the nitrogen atoms and molecules move away from the center of mass. At a specific time t′ one of the atoms starts to penetrate through the cavity wall, as described in eqn (S2).† At later time t > t′, one of the atoms leaves the cavity, in eqn (S3).† Later, at time t′′ the conjugated nitrogen atom belonging to the same N2 diatomic molecule crosses the border, as presented in eqn (S4),† and then departs further away from the cavity wall in a fashion described by eqn (S5).†
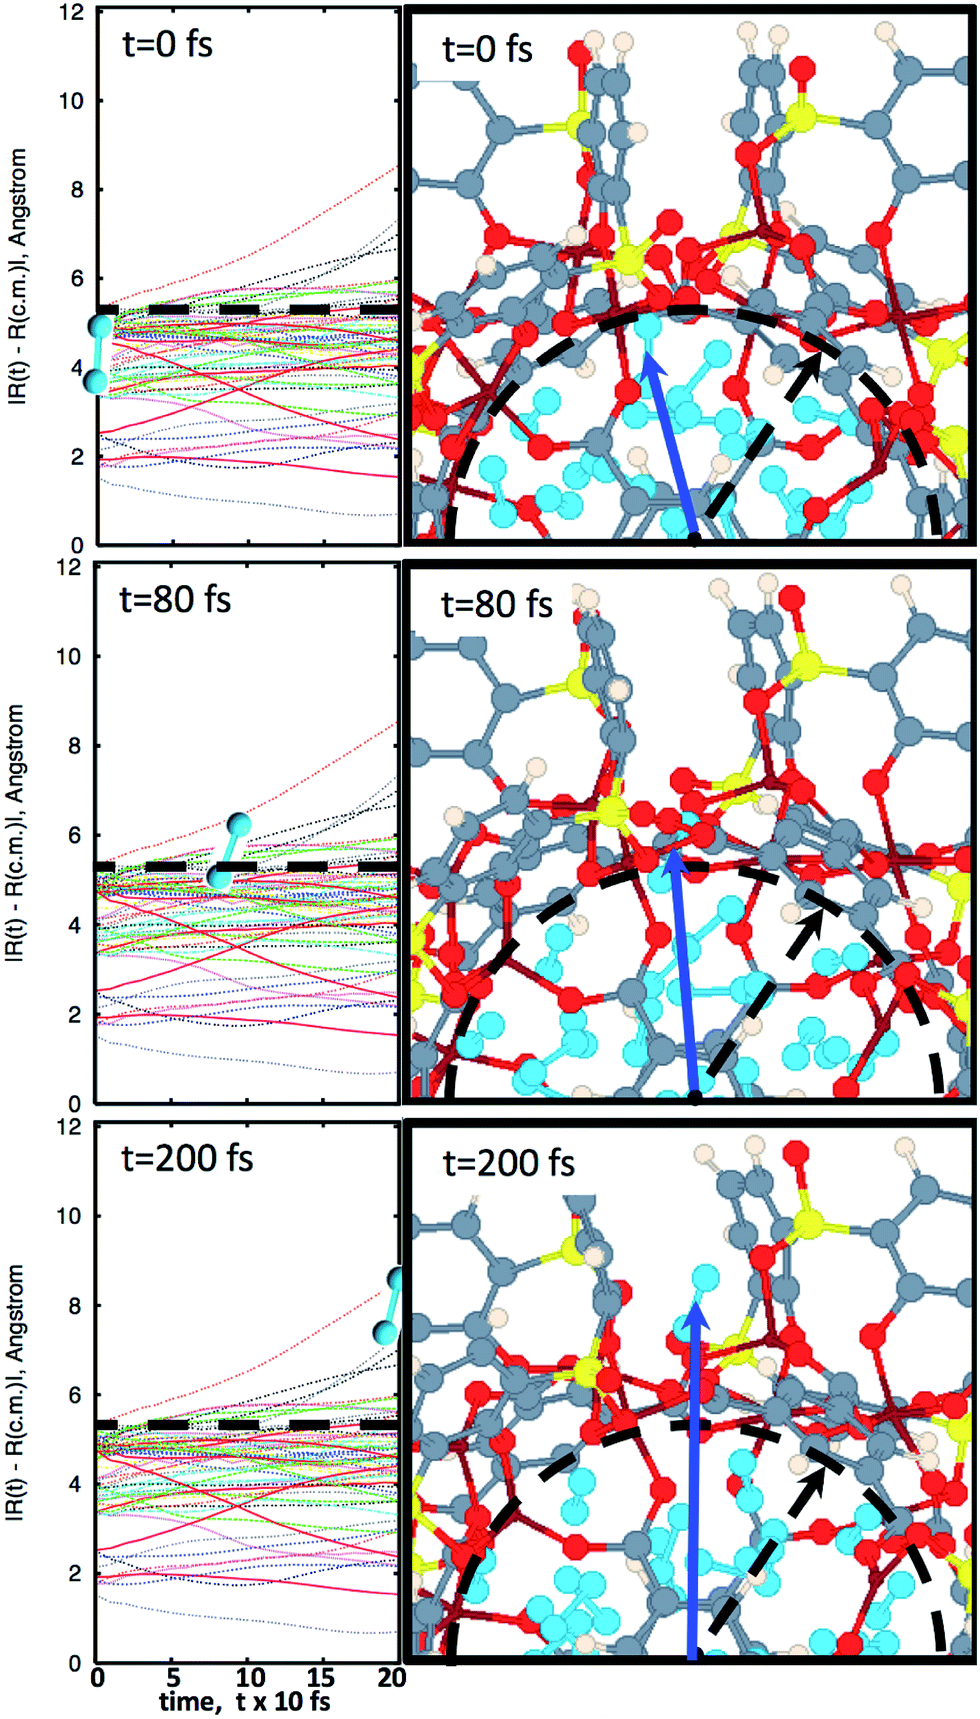 | ||
| Fig. 2 The progression of molecular dynamics simulation at 250 K. Left panels indicate trajectories of all nitrogen atoms with respect to the center of mass, |I(t) − cm|, according to eqn (2b). Right panels illustrate snapshots of molecular dynamics at the most important instants of time. The blue arrow points to the center of a N2 molecule which is about to desorb. Diatomic nitrogen gas is seen in the cavity, in sky blue. At t = 0 fs, the MOSC is filled with nitrogen gas molecules. The dashed line indicates the cavity edges which are monitored for gas molecules to pass beyond. At t = 80 fs, a nitrogen gas molecule is breaching the cavity barrier. At t = 200 fs, the gas molecule has completely left the cavity. Based on these data, τ = 105 fs, so that desorption rate reads R = 1/0.105 ps = 9.52 ps−1. | ||
The sequence of such events as nitrogen atoms and molecules infiltrating through the cavity walls can be recorded in a quantitative way by collecting the time when a given atom passes through the wall. For determining the time of desorption for a diatomic molecule one can use either time t′ when the first atom of the diatomic molecule leaves the cavity, time t′′ when the second atom of N2 diatomic leaves the cavity, or a certain time between these two boundaries.
A possible way is to track the trajectory of the position of the desorbing diatomic N2 molecule as halfway between its atoms (center of mass) 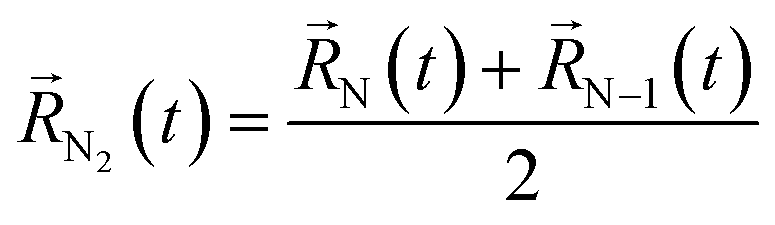 and evaluate the specific time τ at which the position of the molecule crosses the wall of the cavity
|
|N2(τ) − cm| ≥ R0
| (14) |
However, since the value of the desorption time changes by several orders of magnitude, the details of a specific definition provide a negligible contribution to the overall result.
The dynamics of N2 desorption can be also reflected in the form of pair correlation function (PCF) slides at each step of the MD trajectory, per eqn (2c). Fig. 3 shows a pair-correlation function n(r,t) computed as the model progresses through molecular dynamics, from t = 0 to t = 200 fs. This visualization allows one to monitor the spatial density of atoms with respect to the center of mass. The spike seen at r ≅ 1.3 Å is the nitrogen gas molecule bond length. From 2.3 Å to 10 Å there exists unintelligible noise which represents the quick movement of the gas molecules within the MOSC cavity. If one examines the peaks beyond the MOSC cavity diameter as time passes (n(r < 2R0, t > τ)), the emergence of a single peak can be distinguished, moving further away from the MOSC cavity. Once the small peak separates from the MOSC boundary, we can see that a N2 gas molecule has desorbed, graphically, by determining at what time a full bond's length has emerged from the cavity. In this case, desorption occurs at ∼105 fs. Per Fig. 3, at time t < τ all nonzero features of the PCF n(r,t) are detected at distances r < 2R0. Upon desorption, at time t > τ, the new nonzero features of n(r,t) start appearing at distances r < 2R0. Analysis of PCF can serve as an additional measure of gas desorption rate.
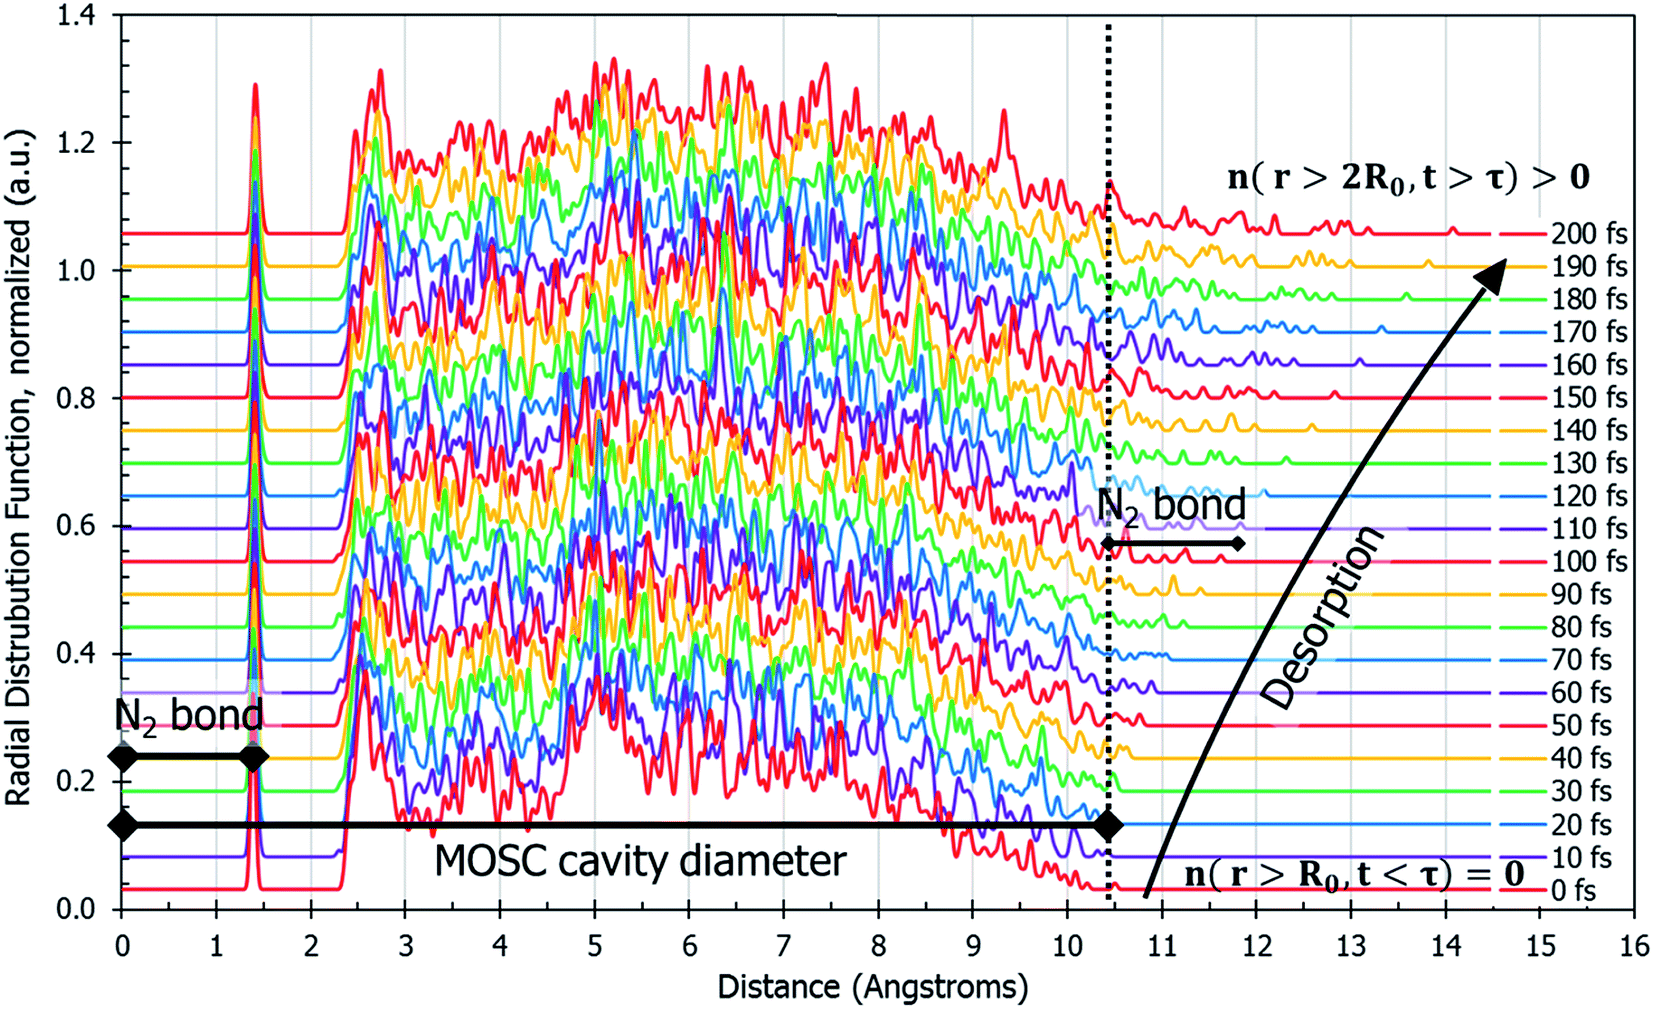 | ||
| Fig. 3 Pair correlation function, n(r,t), of only the gas molecules calculated by eqn (2c). This describes the amount of nitrogen atom pairs removed from each other to the distance of r. Prior to desorption, n(r,t) has a peak at the N2 bond length and it is zero outside of the container n(r < 2R0, t < τ) = 0. The MOSC cavity diameter is represented by the black line ranging from 0–10.4 Å. There are two instances of N2 bond length marked on the graph. The first instance occurs at 0–1.4 Å and is indicative of a nitrogen gas molecule's bond length. The second instance is evident starting at 10.4 Å and designates a N2 bond length outside of the MOSC. The multi-colored lines on the graph each represent a particular snapshot in the molecular dynamics trajectory. If one follows the small peaks present at the far right, desorption can be witnessed by observing the moment when a small peak passes a bond length's distance from the MOSC's cavity. | ||
Temperature is an additional variable which affects the gas desorption rate. Decreasing the temperature in 5–25 K increments allowed a minimum temperature of desorption to be found. While keeping the MOSCs windows frozen during the simulation, no desorption was observed below T′ ∼115 K, which is near nitrogen's critical temperature of 126.2 K. Diatomic nitrogen is in the liquid state in the range of temperatures of TN = 63–77 K. In other words, TN < T′, which means that the MOSC could indefinitely hold onto the nitrogen molecules simply with the use of liquid nitrogen as a cooling source.
Data on desorption times τ(T) were computed for several values of temperature and converted into desorption rates by eqn (3). The data is plotted in Fig. S3,† in the format of eqn (5). Shown in Fig. S3† are the rates of multiple gas molecules escaping the central cavity in succession. Focusing on Fig. S3a,† the observed trend is expected: as the pressure inside the cavity decreases (range of pressures: 978–1046 bar), more thermal energy is required for activating the gas molecule's release. Since sequential escape events are recorded, the internal pressure of the MOSC's cavity decreases with every gas molecule's exit. Thus, a decrease of internal cavity pressure correlates with a reduced gas escape rate. This is analogous to having two identical tires filled at two different pressures. If the gas is released, the initial flow rate from the higher-pressure tire will be greater than the lower-pressure tire. If it was desirable for the initial flow rates to be the same, one would have to apply heat (thermal energy) to the low-pressure tire to close the gap in flow rates. A correlation of escape rate/flow velocity is somewhat analogous to Bernoulli's principle.29 There is also a larger time interval between release events 2 and 3, than between events 1 and 2. It is expected that this trend would continue as more molecules escape the cavity. Table 1 displays the slopes and calculated activation energies for each of the escape events in Fig. S3a.† At first glance the contents of Table 1 may seem counterintuitive. Usually a rate will increase with an increase in temperature. However, at extremely high temperatures, such as the ones examined here, an increase in temperature no longer corresponds to an increase in rate, and in some cases, it can even decrease the rates. At these high temperatures, the gas molecules are colliding so furiously that it can be seen as the equivalent of a crowd of people trying to leave a room at once through only one or two exits. Other gas molecules are impeding the escape. However, this trend has noticeable fluctuations. But, in Fig. 4, the authors show that the expected trend (of increasing activation energy and the number of gas molecules decreases) exists when the number of gas molecules is expanded beyond three escape events. Ultimately, in terms specific to this application, the gas molecules are spontaneously released from the cavity. In Fig. S3b,† some of the data have been excluded from the slope estimation due to the data being obtained at extremely high and unreasonable temperatures. The activation energy of the first escape event (with 32 gas molecules) is calculated to be −0.0070 eV. At room temperature, kB × T = 0.024 eV, which is greater than Ea. Thus, N2 is expected to desorb at room temperature because the amount of energy available is sufficient.
| Escape reaction | Escape number | Slope | Ea (eV) |
|---|---|---|---|
 |
1st escape | −78.84 | 0.0070 |
 |
2nd escape | −67.35 | 0.0058 |
 |
3rd escape | −62.81 | 0.0054 |
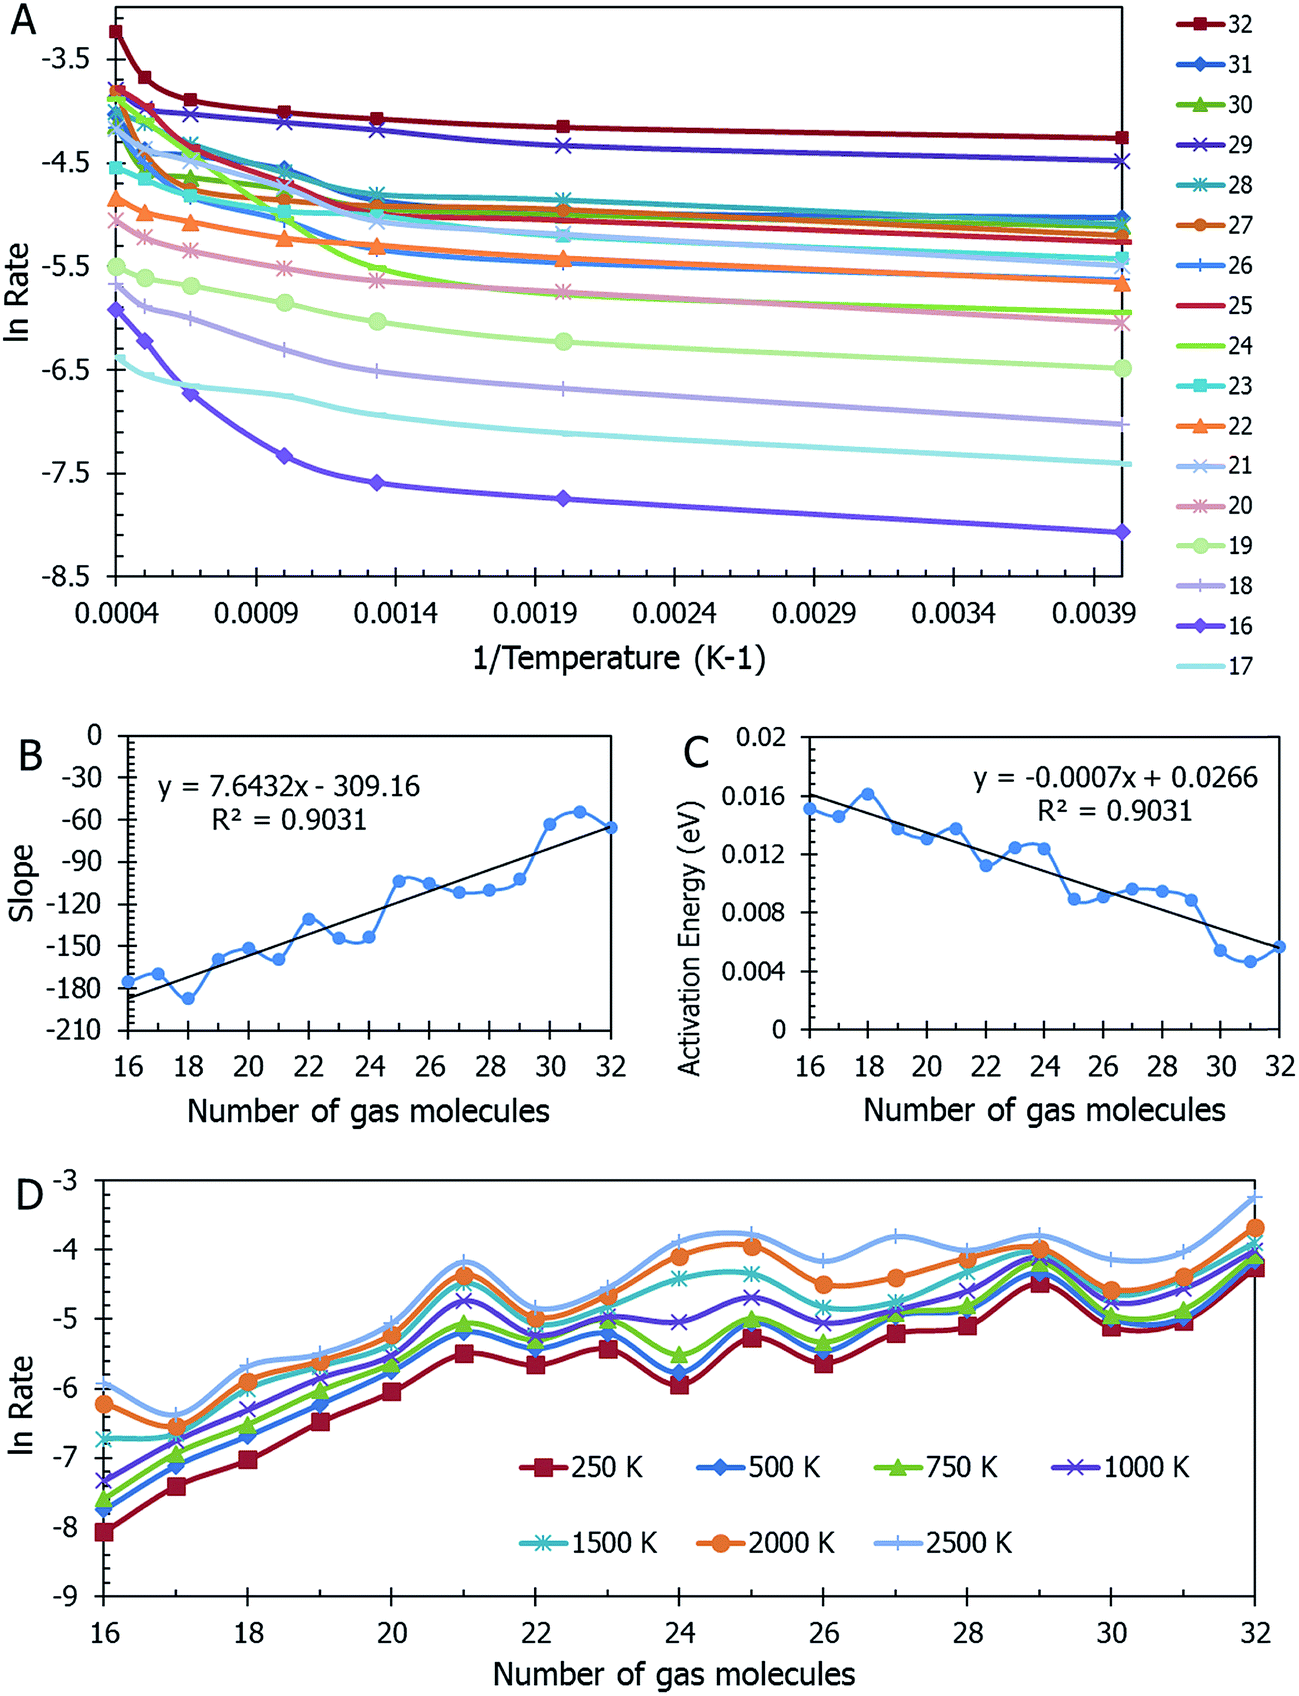 | ||
| Fig. 4 Panel (A) Collection of data over a range of nitrogen gas densities. The natural log of the rate for gas escape as it relates to the inverse of temperature is evaluated. Panel (B) The trend in the slopes of the lines seen in Panel (A). The slopes are only calculated using the first three temperatures due to the remainder of the temperatures being in a range that is considered too high for practical applications. Panel (C) The activation energy required for release decreases as the number of molecules increase. Panel (D) The natural log of the rate for gas escape over various numbers of gas molecules. There seem to be two regions of differing trends in this data: the first is from 16–21 molecules and the second is from 21–32 molecules. The first trend increases more rapidly and the second levels out. This could be indicative of a critical point occurring at 21 molecules, in which the rate is no longer dependent upon the number of molecules over 21. It is hypothesized by the authors, that for N < 21, N2 is stored in the gas phase and for N ≥ 21, the N2 is stored in the form of a supercritical liquid. | ||
A mass of data can be extracted from MD studies, as accumulated in Fig. 4. Several models were studied with the cavity filled with a range from 16 to 32 nitrogen gas molecules (0.64 g mL−1 and 1.45 g mL−1 respectively). The natural log of the rate versus the inverse of temperature in Kelvin is displayed in Fig. 4a. From this information, it can be seen that the rates vary widely among models of different densities. Visually it is difficult to determine any trend. However, if one assesses the slopes of the lines in this graph, Fig. 4b is presented. In calculating the slopes, only the lowest three temperatures are used to restrict the data to practical temperatures. As the number of gas molecules inside the cavity increases, so does the slope. The implication of this trend can be seen in Fig. 4c, which shows the activation energy (see eqn (5b)) decreasing as the gas molecule quantity increases. The global trend illustrated in Fig. 4c shows that activation energy decreases with pressure, i.e. at lower pressures, corresponding to a lower number of molecules in the container, the activation energy is higher. The fluctuations in the individual data points may, however, deviate from this trend. If one were to extrapolate the activation energy for 1 N2 molecule it would follow that Ea = 0.026 eV, which is barely greater than the energy available at room temperature (0.024 eV). For all densities of stored nitrogen, the activation energy rapidly decreases with temperature increase, thus an increase in temperature activates the desorption and facilitates the release of stored gas molecules. Or, alternatively, cooling the system allows for gas retention, thereby promoting the MOSC (at temperatures near or below the critical release temperature of ∼115 K) as a feasible gas storage device. Fig. 4d illustrates the trend that a smaller number of molecules inside the cavity, i.e. lower pressure inside the cavity, results in lower escape rate and higher values of activation energies. This trend can also be interpreted as higher temperature is needed to activate the release event at lower pressures. These global trends should be considered in average, while individual data points may fluctuate from such trend.
Temperature is not the only parameter on which the gas desorption rate relies. The window size is an important factor and its implications are shown in Fig. 5a. Referring briefly to the coefficient of eqn (10), the ratio of total window area to the cavity is an important relationship. As the combined areas of the windows approach the total surface area of the cavity, the rate reaches a maximum. This seems expected since there is a limit to how large the windows become before they “blow up” and there is no more MOSC molecule left to contain any gas. The data on thermal expansion of the window and cavity size are summarized in Table 2.
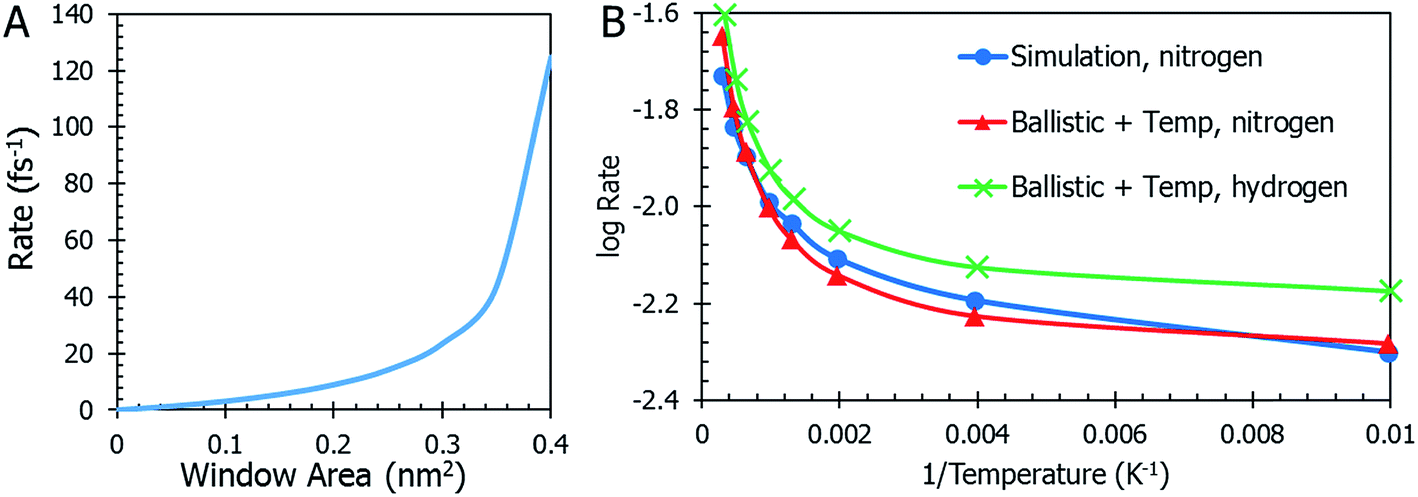 | ||
| Fig. 5 Panel (A) The rate of gas desorption is dependent on the MOSC's window size. As the sum of the area of the circular windows approaches the surface area of the cavity, the rate reaches its maximum. Beyond this, there is no gas escape, simply because there are no more walls. Panel (B) Data from the MD simulation is shown in a blue line with circles and ballistic kinetics with temperature dependence and correction factors in red with triangles. The ballistic kinetics with temperature dependence and corrections factors plot overlaps with the MD data. Finally, the equation that was derived for nitrogen gas escape was modified to be used for hydrogen gas escape. It can be seen as the green line marked with crosses. The overall trend is very similar to the results for nitrogen modeling, but the rate is higher across the range of temperatures. | ||
| Equilibrium diameter (nm) | Thermal expansion (nm K−1) | |
|---|---|---|
| Window | 0.27 | 8 × 10⁻⁵ |
| Cavity | 1.04 | 1 × 10⁻⁴ |
In order to quantitatively assess the different mechanisms of gas release, one inspects the level of agreement between atomistic data R = R(T) from eqn (3), (4), (10), (12), and (13) which reflect different mechanisms of gas desorption with and without thermal expansion of pore size. There are two data sets contained in the graph in Fig. 5b (additional data and modeling methods are provided in Fig. S2†). The blue line with circles represents the data obtained from observing the MD simulation. This data serves as the comparison for all other mathematical modeling methods. There is a faster desorption rate at higher temperatures. To better fit the MD data, the correction factors Dgas = 0.175, = 0.003, and Fc = 0.27 (see eqn (13) discussion) are applied to the ballistic equation, providing the final data (eqn (13)) plotted in red with triangles. Here, the data sets overlap quite well, with a root mean square deviation of 0.0389. The authors seek to expand the use of the derived equation to be used for other types of gasses. With this in mind, an additional data set was graphed in Fig. 5b. The equation, modified for hydrogen gas (with Dgas = 0.110), is plotted with a green line marked with crosses. The overall trend is very similar to the results for nitrogen modeling, but the rate is higher across the range of temperatures, as was expected for a smaller gas molecule.
Eqn (11) shows the simplest possible hypothesis of the size expansion trend. This dependence can have a different functional form, thus improving R = R(T) dependence. The best match between atomistic MD data and an equation based on the pore expansion hypothesis supports the following interpretation of gas desorption mechanism: the elastic nature of the container allows it to expand and open pores at elevated temperatures. Temperature-activated opening of the pores results in the non-linear deviation from the Arrhenius law: at higher temperatures, activation energy abruptly decreases.
4. Conclusions
In conclusion, the rate of N2 gas desorption from a MOSC cavity can be mathematically modeled by three methods: numerical, Arrhenius, and the ballistic kinetics of ideal gas (with and without temperature correction). Stored gas can be released by applying temperature to the container. Based on the modeling, several factors and mechanisms were identified that affect the gas release, such as the frequency of inner surface bombardment and matching of the size of the gas molecule and window. The temperature-induced expansion of the cavity and window sizes is introduced to the ballistic kinetics model so that the observed trend in the MD data can be replicated.A difficulty which was encountered was that our simulations take place at significantly high pressures, which is in the boundary between liquid and gas, especially as the temperature decreases toward the phase change temperature. Some approximations that were made are counter to this situation (the main approximation being the treatment of the nitrogen gas as ideal during some aspects of the mathematical derivations). The mathematical model predicts that the escape rate never goes to zero, only approaches it, yet MD produced a minimum temperature of ∼115 K for allowed gas desorption, below this temperature, gas does not get released from the container.
The ability of the ballistic kinetics equation to be applied to alternative gasses has yet to be explored. The authors plan to extend the equation to include modifications to terms which are dependent on the identity of the gas, as well as using first-principles MD instead of FF. Explaining the behavior of adsorbed gasses can be beneficial across multiple disciplines and numerous applications, including hydrogen fuel storage.
Acknowledgements
This research used resources of the National Energy Research Scientific Computing Center (NERSC), a DOE Office of Science User Facility supported by the Office of Science of the U.S. Department of Energy under Contract No. DE-AC02-05CH11231, allocation award 91202, “Computational Modeling of Photo-catalysis and Photo-induced Charge Transfer Dynamics on Surfaces.” Authors acknowledge the use of USD's High-Performance Computing (HPC) Cluster, which is maintained by Doug Jennewein. WS wishes to acknowledge SD IGERT DGE-0903685. ZW acknowledges the financial support of an NSF CAREER award (CHE 1352279).References
- Annual Energy Outlook with Projections to 2040, US Department of Energy, US Energy Information Administration, Office of Integrated and International Energy Analysis, Washington, DC, 2013 Search PubMed.
- R. Heinberg and D. Lerch, The Post Carbon Reader: Managing the 21st century's sustainability crises, Watershed Media, Healdsburg, California, 2010 Search PubMed.
- N. L. Rosi and J. Eckert, et al., Hydrogen storage in microporous metal–organic frameworks, Science, 2003, 300(5622), 1127–1129 CrossRef CAS PubMed.
- Hydrogen gets on board http://www.rsc.org/chemistryworld/Issues/2006/March/HydrogenOnBoard.asp, accessed April 20, 2016.
- Fuel cell vehicles: Status 2007 http://www.sciencedirect.com/science/article/pii/S0378775307000651, accessed April 20, 2016.
- S.-H. Jhi and Y.-K. Kwon, Hydrogen adsorption on boron nitride nanotubes: a path to room-temperature hydrogen storage, Phys. Rev. B: Condens. Matter Mater. Phys., 2004, 69(24), 245407 CrossRef.
- S. Satyapal and J. Petrovic, et al., The US Department of Energy's National Hydrogen Storage Project: Progress towards meeting hydrogen-powered vehicle requirements, Catal. Today, 2007, 120(3), 246–256 CrossRef CAS.
- L. Wang and R. T. Yang, New sorbents for hydrogen storage by hydrogen spillover – a review, Energy Environ. Sci., 2008, 1(2), 268–279 CAS.
- R. H. Gangupomu and M. L. Sattler, et al., Comparative study of carbon nanotubes and granular activated carbon: Physicochemical properties and adsorption capacities, J. Hazard. Mater., 2016, 302, 362–374 CrossRef CAS PubMed.
- S. Chowdhury and R. Balasubramanian, Highly efficient, rapid and selective CO2 capture by thermally treated graphene nanosheets, J. CO2 Util., 2016, 13, 50–60 CrossRef CAS.
- Y. Wang and W. Y. Zhang, et al., Design of stable cage-like CaO/CaZrO3 hollow spheres for CO2 capture, Energy Fuels, 2016, 30(2), 1248–1255 CAS.
- K. Kim and S. Lee, et al., An improved CO2 adsorption efficiency for the zeolites impregnated with the amino group: A molecular simulation approach, Int. J. Greenhouse Gas Control, 2013, 19, 350–357 CrossRef CAS.
- K. Sumida and D. L. Rogow, et al., Carbon Dioxide Capture in Metal–Organic Frameworks, Chem. Rev., 2012, 112(2), 724–781 CrossRef CAS PubMed.
- F.-R. Dai and Z. Wang, Modular assembly of metal–organic supercontainers incorporating sulfonylcalixarenes, J. Am. Chem. Soc., 2012, 134(19), 8002–8005 CrossRef CAS PubMed.
- M. Eddaoudi and D. B. Moler, et al., Modular chemistry: secondary building units as a basis for the design of highly porous and robust metal–organic carboxylate frameworks, Acc. Chem. Res., 2001, 34(4), 319–330 CrossRef CAS PubMed.
- Q. Yang and D. Liu, et al., Development of computational methodologies for metal–organic frameworks and their application in gas separations, Chem. Rev., 2013, 113(10), 8261–8323 CrossRef CAS PubMed.
- (a) M. V. Parkes and J. A. Greathouse, et al., Ab initio molecular dynamics determination of competitive O2 vs. N2 adsorption at open metal sites of M2(dobdc), Phys. Chem. Chem. Phys., 2016, 18(16), 11528–11538 RSC; (b) A. Blomqvist and C. M. Araújo, et al., Li-decorated metal–organic framework 5: a route to achieving a suitable hydrogen storage medium, Proc. Natl. Acad. Sci. U. S. A., 2007, 104(51), 20173–20176 CrossRef CAS PubMed.
- (a) R. Car and M. Parrinello, Unified approach for molecular dynamics and density-functional theory, Phys. Rev. Lett., 1985, 55(22), 2471 CrossRef CAS PubMed; (b) J. C. Chen and Q. G. Meng, et al., Time-dependent excited-state molecular dynamics of photodissociation of lanthanide complexes for laser-assisted metal–organic chemical vapour deposition, Mol. Phys., 2014, 112(3–4), 508–517 CrossRef CAS; (c) Y. Han and Q. Q. Meng, et al., Photofragmentation of the gas-phase lanthanum isopropylcyclopentadienyl complex: computational modeling vs. experiment, J. Phys. Chem. A, 2015, 119(44), 10838–10848 CrossRef CAS PubMed.
- (a) A. C. Van Duin and S. Dasgupta, et al., ReaxFF: a reactive force field for hydrocarbons, J. Phys. Chem. A, 2001, 105(41), 9396–9409 CrossRef CAS; (b) V. V. Chaban and S. Pal, et al., Laser-induced explosion of nitrated carbon nanotubes: nonadiabatic and reactive molecular dynamics simulations, J. Am. Chem. Soc., 2016, 138(49), 15927–15934 CrossRef CAS PubMed.
- (a) Q. G. Meng and P. S. May, et al., Sequential hydrogen dissociation from a charged Pt13H24 cluster modeled by ab initio molecular dynamics, Int. J. Quantum Chem., 2012, 112(24), 3896–3903 CrossRef CAS; (b) Q. G. Meng and J. C. Chen, et al., Proton reduction at surface of transition metal nanocatalysts, Mol. Simul., 2015, 41(1–3), 134–145 CrossRef CAS.
- W. Sapp and A. Erck, et al., Electronic and spectral properties of a metal–organic super container molecule by single point DFT, Mol. Phys., 2016, 114(3–4), 394–399 CAS.
- A. F. Ismail and K. C. Khulbe, et al., Gas Separation Membranes, Springer, 2015 Search PubMed.
- J. E. Park and H. K. Youn, et al., CO2 capture and MWCNTs synthesis using mesoporous silica and zeolite 13X collectively prepared from bottom ash, Catal. Today, 2012, 190(1), 15–22 CrossRef CAS.
- W. K. Wang and J. F. Yang, et al., Research on the adsorption of O2 in metal–organic frameworks with open Manganese(II) coordination sites, Funct. Mater. Lett., 2013, 6(1), 6 Search PubMed.
- A. Llorens and E. Lloret, et al., Metallic-based micro and nanocomposites in food contact materials and active food packaging, Trends Food Sci. Technol., 2012, 24(1), 19–29 CrossRef CAS.
- Hyperchem 7.5 for Windows, molecular modeling system, Hypercube Inc., 2002 Search PubMed.
- N. L. Allinger, Conformational analysis. 130. MM2. A hydrocarbon force field utilizing V1 and V2 torsional terms, J. Am. Chem. Soc., 1977, 99(25), 8127–8134 CrossRef CAS.
- W. Sapp and D. Kilin, MOSC nitrogen gas storage, https://www.youtube.com/watch?v=ZZxQFwDIGYw, accessed June 26, 2016 Search PubMed.
- P. S. Bernard, Fluid Dynamics, Cambridge University Press, 2015 Search PubMed.
Footnote |
| † Electronic supplementary information (ESI) available. See DOI: 10.1039/c6ra21876h |
| This journal is © The Royal Society of Chemistry 2017 |