 Open Access Article
Interfacing neurons on carbon nanotubes covered with diamond†
Silke Seyock a,
Vanessa Maybeck
 a,
Emmanuel Scorsone
 b,
Lionel Rousseauc,
Clément Hébert
 d,
Gaëlle Lissorgues
 c,
Philippe Bergonzo
 b and
Andreas Offenhäusser
 *a
*a
aInstitute of Complex Systems (ICS-8/PGI-8), Forschungszentrum Jülich, 52428 Jülich, Germany. E-mail: a.offenhaeusser@fz-juelich.de
bCEA, LIST, Diamond Sensors Laboratory, 91191 Gif-sur-Yvette, France
cESIEE, ESYCOM, Université Paris Est, 93162 Noisy-le-Grand, France
dCampus de la UAB, Edifici ICN2, 08193 Bellaterra, Spain
First published on 7th December 2016
Abstract
A recently discovered material, carbon nanotubes covered with diamond (DCNTs) was tested for its suitability in bioelectronics applications. Diamond shows advantages for bioelectronics applications (wide electro chemical window and bioinertness). This study investigates the effect of electrode surface shape (flat or three dimensional) on cell growth and behavior. For comparison, flat nanocrystalline diamond substrates were used. Primary embryonic neurons were grown on top of the structures and neither incorporated the structures nor did they grow in between the single structures. The interface was closely examined using focused ion beam (FIB) and scanning electron microscopy. Of special interest was the interface between cell and substrate. 5% to 25% of the cell membrane adhered to the substrate, which fits the theoretical estimated value. While investigating the conformity of the neurons, it could be observed that the cell membrane attaches to different heights of the tips of the 3D structure. However, the aspect ratio of the structures had no effect on the cell viability. These results let us assume that not more than 25% of cell attachment is needed for the survival of a functional neuronal cell.
Introduction
With today's micro- and nanotechnology fabrication processes it is possible to create fine 3D nanostructures, for example nanocones,1 nanopillars,2 or nanowires3 (see Table 1 in Bonde et al.4). Of special interest are the interaction with, and the contact of, biological material and these 3D nanostructures. While investigating the interface between cell and substrate, good cell adhesion to 3D structures was shown with different structures. For example Yu et al. showed the growth and adhesion of neuronal cells on vertically aligned carbon nanofibers.1 To provide better implants in the future and to optimize 3D materials further, knowing the interaction of the cell and substrate is of special importance. Materials for medical electronic implants today on one hand need to be stable for a long time, inert and show good electronic properties, on the other hand they need to be biocompatible and in close contact with the tissue.Here, we present a recently discovered material that combines carbon nano-tubes (CNTs) with boron-doped diamond (BDD) forming a triangular 3D structure.5 Conductive BDD is inert and stable,6 provides a low background current and a wide potential window.5,7 Additionally, its biocompatibility and conductivity was shown previously.8–11 In contrast to previous work12–14 we present here cell growth on BDD substrates which were not surface functionalized before culturing cells on top. However, BDD shows a lower capacitance and higher impedance than metallic electrode materials. This can be overcome by engineering the surface area of the electrode. To increase the surface area, and thus the capacitance of BDD culture surfaces, CNTs were chosen as the core material for their high conductance.5 CNTs can suffer from instability, a small potential window and could be internalized by cells.15 Still, good biocompability of CNTs to cells is known16–18 and can even enhance the activity of electrically active cells.19 However, their combination with BDD encapsulates them in place on the surface. The CNTs were grown on boron-doped nanocrystalline diamond to form vertically-aligned carbon nanotubes. To add additional stability, they were covered with BDD,5 resulting in diamond covered CNTs. The resulting structure of cones forms as several CNTs touch at their tips and are covered to form one DCNT structure. Thus, the drawbacks of the two materials were overcome: long-term stability and high biocompatibility of BDD are combined with a large surface area and low impedance of CNTs. Improved electronic properties compared to the individual materials, such as better impedance, has been shown previously.5
The biocompatibility of this material was shown previously.5,9 Neuronal activity of a whole spine could be recorded with electrodes produced of DCNT and stimulations were performed by Piret et al.9 However, electrical performance was not as improved as predicted by the geometry of the structures. This work will address the cortical neuron viability on and interaction with the DCNT structures in comparison to planar nanocrystalline diamond substrates. Of special interest is to examine the interface between the cell membrane and the DCNT material to determine how cell-material coupling may counter the electrical gains of substrate geometry. FIB milling was used to access the interface of the cell with the DCNT material and investigate the interaction between the cell and substrate in cross-section. We were interested in the cell adhesion on the structure, also in the conformity of the cell on top of such a structure. Three different heights of CNTs (1 μm, 2 μm, and 3 μm) were examined. We found cells attached to 3D DCNT structures at the same percentage of connectivity as they do on flat substrates, irrespective of structure height.
The main focus lays on the requirements for an attachment of a neuronal cell to the DCNT structures. We want to determine the minimum surface area a neuronal cell needs to survive and prosper.
Materials and methods
Contact angle meter
With a contact angle system from Dataphysics, the contact angle was measured. A drop of MilliQ (2 μL) was dispensed onto the sample. The contact angle of every sample was measured at least three times using a Teli camera. Three replicates were measured with the 1 μm samples, five for the 2 μm samples, one for the 3 μm samples, and three for the control samples. Values were shown as mean ± standard error of the mean (SE). P values were estimated using a one way analysis of variance (ANOVA) test.Cortical neurons and coating
The samples were sterilized for 10 min in 70% ethanol and afterwards washed with bidistilled water. They were coated with poly-L-lysine (0.01 mg mL−1) in Gey's balanced salt solution (GBSS) for one hour, then washed with GBSS and left in the fridge until cell preparation. Primary embryonic rat cortical neurons were isolated from E18 Wistar rats or BrainBits (UK) Sprague Dawley rats. 138 or 2222 cells per mm2 were seeded in 1 mL Neurobasal Medium (Life Technologies, containing 1% B27 (Gibco), 0.25% L-glutamine, and 0.1% gentamicin) on top of the samples. After one hour of adherence the medium was changed. The cells were cultured at 37 °C in a humidified environment containing 5% CO2. Half of the medium was changed twice a week. Depending on the experiment, the cells were cultured six, 14 or 17 days.Live/dead staining
The cells were stained for 15 min with calcein-AM (1 μg mL−1) in dimethyl sulfoxide (DMSO) and ethidium homodimer (4 μM) in DMSO (both Life Technologies) prepared in cell culture media. The samples were observed with a Zeiss Image.Z1 microscope. For the cell viability ratio, the dead and living cells were counted and set into relation.Fixation, scanning electron microscope (SEM) and FIB cuts
After the live and dead staining, the samples were washed two times with warm phosphate-buffered saline (PBS), then fixed for 15 min with 3.2% glutaraldehyde in PBS. After removing the glutaraldehyde and washing the samples again with PBS and MilliQ the samples were diluted to 100% ethanol in steps of 10%.Afterwards, the samples were dried in a critical point drier and sputtered with 5 nm platinum. The samples were observed in a Scanning Electron Microscope (SEM Gemini 1550 Zeiss). For milling with the FIB they were inserted into a Helios Nanolab Dual-beam system (FEI company). With an electron beam induced deposition, a layer of platinum (0.5 μm) was deposited on top of the selected sample section. After turning the sample 52° the section was cut using a voltage of 30 kV and a current of 0.79 nA.
3-(4,5-Dimethylthiazol-2-yl)-2,5-diphenyltetrazolium bromide (MTT) assay
To determine the cell metabolism, filtered MTT (0.5%) in PBS was applied to each sample and then incubated for four hours. Following this, lysis buffer (consisting of 10 g sodium dodecyl sulfate, 25 mL dimethylformamide, 25 mL MilliQ, adjusted to pH 4 with 1 M hydrogen chloride) was added and the samples were incubated overnight. The differences in color were measured with a BioTek Synergy plate reader at 570 nm and 630 nm. Three replicates of three repetitions were measured with the samples. Seven 1 μm samples, eight 2 μm samples, three 3 μm samples and five control samples were measured. Values were shown as mean ± SE. P values (p = 0.07) were estimated using a one way ANOVA test.If not stated otherwise all chemicals were purchased from Sigma Aldrich.
All experiments were performed according to statutory regulations (approved by the Landesumweltamt für Natur, Umwelt und Verbraucherschutz Nordrhein-Westfalen, Recklinghausen, Germany (number 84-02.04.2015.A173)). They were performed in accordance with the German animal protection act §8, paragraph 1 and before May 2015 in accordance with §6 TierschG., §4 TSchG i.V. and §2 TierSchVerV.
Results and discussion
Material
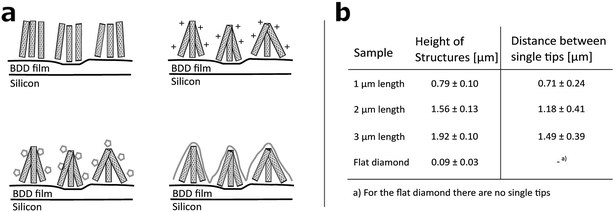
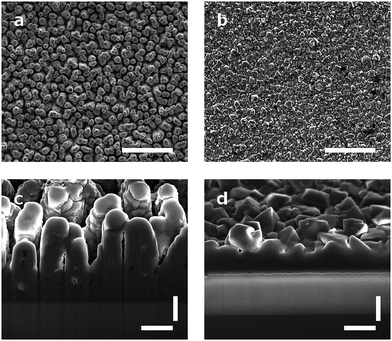
Arrays of three dimensional DCNT samples were produced. CNTs are grown on a diamond surface and afterwards made hydrophilic using an ozone atmosphere. After a first annealing of diamond crystals, a boron-doped diamond layer is grown on top of the CNTs (see Fig. 1a). For a more detailed description see Hébert et al.5 Three different heights of CNTs (1 μm, 2 μm, and 3 μm) were coated with 25 nm boron-doped diamond. As control, flat nanocrystalline diamond (NCD) structures as described by Hébert et al.20 were used. One sample of the DCNTs (1 μm) and one control sample can be seen in Fig. 2a and b, thus illustrating the different features. Fig. 2c and d display cross sections of the DCNT and the control sample. In the former picture, the internal CNTs are revealed. First of all, the dimensions of the features were estimated. The single structures of one DCNT sample vary in their heights, for example the measured height (which is measured from wafer to tip) of the structures for the 1 μm CNT sample range between 0.69 μm and 0.89 μm, this difference is also visible in the cross-section in Fig. 2c. For convention, we use the prepared height of the CNTs to name the samples throughout this paper, the reader is referred to Fig. 1b for real dimensions. In line with the different heights, the distances between the single tips vary; the higher the tips, the wider the distance between them. Thus, the distance between two single tips varies from 0.71 μm ± 0.24 μm (1 μm height sample) to 1.49 μm ± 0.39 μm (3 μm height sample). Additionally Taylor et al.10 characterizes flat BDD in terms of roughness, for which they find a roughness factor Ra of 38 nm ± 1 nm. Furthermore, DCNT were characterized in the literature10 according to bundles per μm2, in which case 1 μm and 2 μm samples exhibit 9 and 4 bundles per μm2, respectively. They do not provide a number for the 3 μm sample.Contact angle measurement
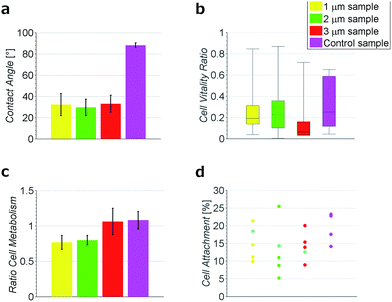
To test the hydrophobicity of the samples, the contact angle was estimated. This parameter is of importance to qualify if the samples have a good protein and cell attachment. The DCNT samples have low contact angles, which show their hydrophilicity. The means range between 29.6° ± 7.6° and 32.9° ± 8.01°, see Fig. 3a. No significant difference in hydrophobicity between the different heights of samples could be estimated (p = 0.971). However, the control samples with a mean of 88.2° ± 2.2° show a clearly higher hydrophobicity then the DCNT samples (p = 0.004). Thus, the DCNT structures show good parameters for cell culture. A reason for these low hydrophobicity values could be the permeation of the aqueous solution into the DCNT structures as described in the Wenzel's model.21 Martines et al. state that the shape and the curvature of the edge are important for the wettability of the samples. Their most effective superwettable configurations are blunt, slender pillars.22 This is in line with our observations where the blunt DCNT samples have the highest hydrophilicity.Cell metabolism
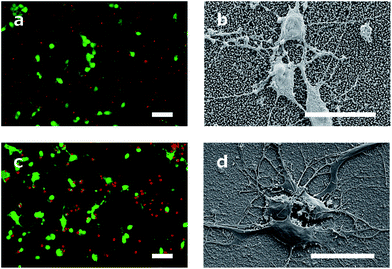
The cell viability was shown by staining neuronal embryonic cells with a mixture of calcein-AM and ethidium homodimer. Living cells are stained green using calcein-AM and exposed DNA of dead cells is stained red using ethidium homodimer. Observed after 14 days, the neurons on the DCNTs samples show a vitality ratio from 0.15 to 0.49, see Fig. 3b. This seemingly low value matches to vitality values measured on standard glass substrates, which are around 0.5. A high amount of dead cells is produced by the mechanical stress of the primary cell preparation and this material is transferred to the substrate along with the living cells during seeding. Vitality ratios of the cell suspensions applied to the samples are approximately 50%. These dead cell fragments may adhere to the surface and cannot be removed from the samples during the culture. Additionally, an impression of the network is seen in Fig. 4a and c. Here, almost the same amount of living and dead cells can be observed. The samples of the DCNTs and the controls show similar network building. The diamond control samples show a similar survival of living cells as the DCNT samples. The three different heights of DCNTs were tested for differences in cell vitality but no significant distinctions could be observed (p = 0.123). The cell morphology does not show big variances between the DCNT samples and their control, as can be seen in the exemplary SEM pictures in Fig. 4b and d. Clearly the cell bodies can be distinguished from the dendrites which elongate from the cells.The good biocompatibility of the DCNTs and control diamond was shown beforehand with different cell types. Ojovan et al. showed that hippocampal cells grow better with an applied protein layer, as we could also see in our experiments.23 Furthermore, on the DCNT structures a good biocompability of neural stem cells10 and the growth of hippocampal and spinal cord cells were shown without coating.9 Our experiments with an applied protein coating show a better survival of the cells. The neurons form a nice network structure, showing distinctive neurite connections.
The growth of hippocampal and spinal cord cells on flat diamond but without coating were shown by Piret et al.9 and Ojovan et al.23 Additionally, the biocompability of flat nanocrystalline diamond to renal epithal cells,24 cardiomyocytes25 and to neurons26,27 was shown. The flat diamond used as our control depicts similar good results.
The metabolic level of neurons on DCNTs could be shown using a colorimetric assay. Neurons on glass cover slips were used for the reference metabolic activity and values are provided relative to this activity. In line with the previous staining, the DCNT samples show a good cell metabolism. The 3 μm samples exhibit a high activity level in the range of 1.06 ± 0.18. In comparison, the 1 μm and 2 μm samples show slightly lower, though not significantly different (p = 0.07), cell metabolism values (0.77 ± 0.09 and 0.79 ± 0.07). In comparison also the control flat diamond samples show high metabolic values (1.08 ± 0.12), in line with 3 μm DCNT samples, see Fig. 3c. Since the morphology and metabolic activity of the neurons is not significantly different, we exclude cell viability as a source of the discrepancy in DCNT electrode performance.
Network activity of tissue has been shown before using DCNT multi-electrode arrays (MEAs) by Piret et al.,9 where they recorded neuronal signals from a whole spinal cord using the DCNT as MEA electrodes.
Interface and surface area
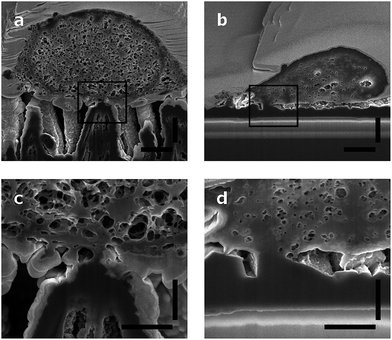
Neurons grow on top of the DCNT structures and a good adhesion to the substrate can be observed via cross-sectioning. The contact points of the cell membrane can be found at the top of the tips, as can be seen in Fig. 5a. Fig. 5c is an enlargement of one contact point image, which shows clearly the cell attachment to the top of the underlying structure. The cell membrane does not grow in the space between the DCNTs and also does not incorporate them. However, on some samples it can be seen that the membrane bends slightly in between two single structures. Additionally, it can be observed that in most of the pictures the dendrites and axons grow among the structures. Especially on a dense neuronal culture, the neurites grow in between the structures and underneath the cell bodies thus supporting the network formation. The underlying 3D structures give them support to grow in three dimensions. However, this is not to be mistaken as a 3D cell culture such as hydrogels where multilayers of cells form.In Fig. 5b a cross section of a control sample is depicted. Even though it is a flatter substrate, the attachment from the cell to the surface is similar to the DCNT structures. Furthermore, the cells do not follow the features and apparently there are gaps underneath the cell membrane. The cell only attaches to the control sample at some certain points, as can be seen in Fig. 5d, which shows the corresponding enlargement.
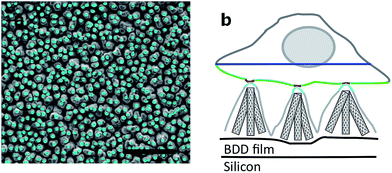
The surface of the contact points (attachment of cell membrane to the tips of the DCNT) was determined. The surface area of nanostructures proved to be the most important factor concerning the promotion or inhibition of cell adhesion.4 The percent of attachment amounts to only 5% to 25% of the total bottom cell membrane of the soma for the different length of DCNTs samples, see Fig. 3e. In line with these results, the observed cell attachment of the control sample is 14% to 24%. In general, it can be said that the difference between cell attachment on flat diamond substrates and the attachment on DCNT samples is small. To estimate the theoretical attachment surface available, the area of the tips of the DCNTs was set in relation to the in plane surface area of the substrate (see Fig. 6a and b). Thus, it is possible to compare the theoretical attachment area assuming no wrapping of the structures with the actual attachment. The results of the actual surface of the contact points are in line with the theoretical estimated attachment points: 18% for the 1 μm sample, 14% for the 2 μm samples and 12% for the 3 μm samples (see Fig. 3e). The question is addressed of how much surface is actually needed for a cell to adhere to a substrate.
Cell attachment of 5% to 20% was reported previously on flat silicon.28 However, in these experiments human embryonic kidney cells were used instead of neuronal cells. In general, in our experiments, it seems sufficient to provide a surface where a cell can adhere with 5% to 25% of the total bottom cell membrane.
On the DNCT structure the neuronal cells meet the requirement of attachment by using all available tips (maximum 25% attachment). The DCNT structures are not sharp enough to pierce into cells (like nanostructures used for drug delivery29) but offer enough place to let cells adhere. Furthermore, the structures are also stable enough to not get bent by cell traction forces, as shown in literature, for example with silicon nanowires.30,31
On control samples the majority of the available surface is ignored and the cell membrane attaches only to selected points. As long as the DCNT structures provide at least 5% of surface at the tips, the cells do not need to wrap the structures to adhere. Further investigations are needed to estimate the exact amount of a surface a neuronal cell needs to attach to survive. The next step would be to separate the single DCNT structures from each other more to estimate the exact minimum cell attachment to these structures and to investigate how much the cells would stretch to stay on top of the structure.
For comparison an immunostaining against the focal adhesion protein vinculin and microtubule-associated protein 2 (MAP-2) was performed. The staining does not show differences in between DCNT and the control (see Fig. S1†). It can be observed that the focal adhesion points of the neurites lay in a different focal plane than the cell bodies, in agreement with positioning seen in the FIB cuts. Also here it can be observed that the neurites do not only grow on top of the structures but also in between them. However, the DCNT structures cannot be observed using a light microscope, thus making it difficult to examine where exactly the neurons are attaching to the substrate. Additionally, it is reported that there is no correlation between focal adhesion points and area of close adhesion to surface32 which makes it necessary to test the adhesion not only with immunostaining but also with cross-sections.
Cell rigidity
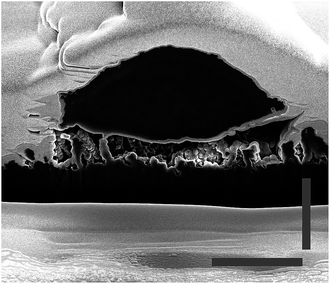
It can be observed from the cross sections that the cell membrane of the neurons is able to compensate small variances between the heights of the tips. Thus, the cell membrane attaches to the top of the tips, as described before. Whereas, if the distance between two tips (step size) is too large, as can be observed in Fig. 7, where the cell grew on a scratch, the cell membrane cannot attach to the broken tips. Rather than bending to contact the shorter structures, it spans the distance between two unbroken tips. Additionally, it was observed that the cells generally avoid areas with broken tips. This further indicates that the cell attaches to the underlying CNT structure as little as possible, and the benefit of a fully sealed diamond layer encapsulating the CNTs.This behavior of limited bending to reach lower tips lets us assume a certain rigidity of the cells. To quantify this, the curvature of the cells was estimated; the length of the bottom cell membrane was set in contrast to the diameter of the cell (see Fig. 6b). The higher the value, the less bending occurred, and therefore the more rigid the cell is. The values range between 49% and 92%, with a mean of 76%. This shows a relatively high rigidity, thus a low curvature of the cell. Still, the cell membrane is flexible enough to bend down to slightly lower single tips. However, due to high membrane bending energies at the nanoscale it is difficult for the cell membrane to closely wrap around sharp corners. Adhering to the top of the DCNT structures is a good compromise between bending of the cell membrane and still having enough adhesion points. Neurites may provide a cell a means of increasing contact points via a cell structure with a higher degree of bending. However, on DCNT structures, we do not observe more conformational adhesion of neurites than cell bodies (see Fig. S2†). The specific behavior of neurites on DCNT is beyond the scope of this work, as strong coupling to the soma is the best way to assure good electrical signal detection.
Next to needing a certain amount of attachment points, the cells show a certain rigidity. When designing materials that provide enough attachment points for cell growth, the rigidity factor will influence the pitch that can be used for structures of a given height.
The phenomenon of adhering only on top of different structures was observed already on several substrates with different cell types. On the other side, engulfment of the structures by cells was also investigated. In general, the parameters determining if cells engulf nanostructures or grow on top are the distance between the single structures, the geometry, the material, the height, the diameter of the single structures and the bending energy of the cell membrane. It was observed that cells on arrays of nanostructures with a high density sit on top of the structures.
For example neurons grown on an array with single structures 2 μm away from each other span from one structure to the other without touching the bottom of the substrate in between.33 This was also described for cardiomyocytes.2 Also, Bugnicourt et al. state that neurons grow on top of their nanowires and they determined the distance between neurite adhesion points to be 527 nm ± 27 nm.34 Retinal cells also grow on top of high density nanowires (0.2 to 10 nanostructures per μm2).35 Summarized, it can be seen that different cell types, including neurons, show the same behaviour on samples with a low pitch.
On the contrary, on an array of gold pillars with 25 nm distance between structures neurons did not grow.36 Here, the topography (60 nm diameter and 100 nm height difference between the pillars) suppresses the cell growth. The step size is too large for a good adhesion of neurons, and presumably not enough places for adhesion points are provided. Additionally, the high rigidity of the cells makes it difficult for them to bend in between structures with low pitch.
In contrast, if cells grow on arrays with a low density the structures are engulfed by the cells. Bonde et al. describe the critical separation of two single structures to be between 2 μm to 3 μm.4 Examples therefore are nanostructures that show a pitch of 4 μm37,38 or 5 μm.39 Additionally, McKnight et al. reported carbon structures with a pitch of around 15 μm, which are engulfed by neuronal cells as well.40 This separation allows engulfment with lower bending energies induced in the cells.
The structures investigated in this study belong to the group of nanomaterials where the cells sit on top. This can be also seen from the pitch, which is between 0.7 μm and 1.5 μm. Here, we focus mainly on one parameter, the pitch. That this is not the only factor determining if a cell engulfs a structure or grows on top was shown by Hanson et al.41 They show that samples with a small pitch (1 μm) but also a small diameter (200 μm) are also engulfed by cells. In contrast, the cells growing on 500 μm samples with a pitch of 1 μm grow on top of the structures. Here, our structures resemble more the latter one. However, one also has to consider the different materials and the roughness of the materials. Thus making a comparison difficult.
Conclusions
A novel 3D material is presented with three different heights. However, the different heights neither influence the growth nor the attachment of the primary cortical neurons to the substrate. Low hydrophobicity values suggest a good surface for cell culture. The DCNT substrates offer good neuronal cell viability and promote metabolic activity of the cells. The neuronal cells grow on top of the DCNT substrates and do not bend into the space between the CNTs, which is supported by high rigidity values of the cell membrane. Only 5% to 25% of the cell membrane is attached to the surface of the DCNT. The theoretical estimated maximum attachment without bending of the cell membrane ranges from 12% to 18%, according to the different heights of the DCNT structures. Unexpectedly a similar percentage (14% to 24%) is shown with cells attached to flat control samples. This leads to the assumption that only around 5% to 25% of cell attachment is needed to assure a good cell attachment and growth. This fraction presumably allows a high leak current between the cell and the material when it is used as an electrode. However, the question remains if further improvements are possible by optimization of the 3D design. If the neuronal cells need not more than maximum 25% of attachment, providing a larger surface area is not necessary, but reducing the volume for leak currents may be important. In this work we showed that no matter if the cells adhere to flat diamond structures or 3D structures, not more than 25% of attachment is needed. This leads to the assumption that not the structure of the 3D sample is important, but the attachment area provided for cell vitality. However, the bluntness of the structures and the distance between the single structures is another critical point which needs to be considered to reduce the volume of the gap.Acknowledgements
This work was financed with the Neurocare project, EU-FP7 project #280433. We would like to thank Elke Brauweiler-Reuters and Elmar Neumann for the help with the FIB cuts and Bettina Breuer for help with the dissection of the rat tissue.References
- Z. Yu, T. E. McKnight, M. N. Ericson, A. V. Melechko, M. L. Simpson and B. Morrison, Nanomedicine, 2012, 8, 419–423 CAS.
- F. Santoro, J. Schnitker, G. Panaitov and A. Offenhäusser, Nano Lett., 2013, 13, 5379–5384 CrossRef CAS PubMed.
- M. Kwak, L. Han, J. J. Chen and R. Fan, Small, 2015, 11, 5600–5610 CrossRef CAS PubMed.
- S. Bonde, N. Buch-Månson, K. R. Rostgaard, T. K. Andersen, T. Berthing and K. L. Martinez, Nanotechnology, 2014, 25, 362001 CrossRef PubMed.
- C. Hébert, J. P. Mazellier, E. Scorsone, M. Mermoux and P. Bergonzo, Carbon, 2014, 71, 27–33 CrossRef.
- M. D. Fries and Y. K. Vohra, Diamond Relat. Mater., 2004, 13, 1740–1743 CrossRef CAS.
- R. Kiran, L. Rousseau, G. Lissorgues, E. Scorsone, A. Bongrain, B. Yvert, S. Picaud, P. Mailley and P. Bergonzo, Sensors, 2012, 12, 7669–7681 CrossRef CAS PubMed.
- C. Hébert, J. Warnking, A. Depaulis, L. A. Garçon, M. Mermoux, D. Eon, P. Mailley and F. Omnès, Mater. Sci. Eng., C, 2015, 46, 25–31 CrossRef PubMed.
- G. Piret, C. Hébert, J.-P. Mazellier, L. Rousseau, E. Scorsone, M. Cottance, G. Lissorgues, M. O. Heuschkel, S. Picaud, P. Bergonzo and B. Yvert, Biomaterials, 2015, 53, 173–183 CrossRef CAS PubMed.
- A. C. Taylor, B. Vagaska, R. Edgington, C. Hébert, P. Ferretti, P. Bergonzo and R. B. Jackman, J. Neural Eng., 2015, 12, 66016 CrossRef PubMed.
- A. Bendali, L. Rousseau, G. Lissorgues, E. Scorsone, M. Djilas, J. Dégardin, E. Dubus, S. Fouquet, R. Benosman, P. Bergonzo, J.-A. Sahel and S. Picaud, Biomaterials, 2015, 67, 73–83 CrossRef CAS PubMed.
- L. Marcon, C. Spriet, Y. Coffinier, E. Galopin, C. Rosnoblet, S. Szunerits, L. Heliot, P.-O. Angrand and R. Boukherroub, Langmuir, 2010, 26, 15065–15069 CrossRef CAS PubMed.
- K. F. Chong, K. P. Loh, S. R. K. Vedula, C. T. Lim, H. Sternschulte, D. Steinmüller, F.-S. Sheu and Y. L. Zhong, Langmuir, 2007, 23, 5615–5621 CrossRef CAS PubMed.
- P. Ariano, P. Baldelli, E. Carbone, A. Gilardino, A. Lo Giudice, D. Lovisolo, C. Manfredotti, M. Novara, H. Sternschulte and E. Vittone, Diamond Relat. Mater., 2005, 14, 669–674 CrossRef CAS.
- G. Cellot, L. Ballerini, M. Prato and A. Bianco, Small, 2010, 6, 2630–2633 CrossRef CAS PubMed.
- S. Marchesan, M. Melchionna and M. Prato, ACS Nano, 2015, 9, 9441–9450 CrossRef CAS PubMed.
- N. A. Kotov, J. O. Winter, I. P. Clements, E. Jan, B. P. Timko, S. Campidelli, S. Pathak, A. Mazzatenta, C. M. Lieber, M. Prato, R. V. Bellamkonda, G. A. Silva, N. W. S. Kam, F. Patolsky and L. Ballerini, Adv. Mater., 2009, 21, 3970–4004 CrossRef CAS.
- M. K. Gottipati, J. J. Samuelson, I. Kalinina, E. Bekyarova, R. C. Haddon and V. Parpura, Nano Lett., 2013, 13, 4387–4392 CrossRef CAS PubMed.
- S. Marchesan, S. Bosi, A. Alshatwi and M. Prato, Nano Today, 2015, 11, 398–401 CrossRef.
- C. Hébert, E. Scorsone, A. Bendali, R. Kiran, M. Cottance, H. A. Girard, J. Degardin, E. Dubus, G. Lissorgues, L. Rousseau, P. Mailley, S. Picaud and P. Bergonzo, Faraday Discuss., 2014, 47–59 Search PubMed.
- R. N. Wenzel, Ind. Eng. Chem., 1936, 28, 988–994 CrossRef CAS.
- E. Martines, K. Seunarine, H. Morgan, N. Gadegaard, C. D. W. Wilkinson and M. O. Riehle, Nano Lett., 2005, 5, 2097–2103 CrossRef CAS PubMed.
- S. M. Ojovan, M. McDonald, M. McDonald, N. Rabieh, N. Shmuel, H. Erez, M. Nesladek and M. E. Spira, Front. Neuroeng., 2014, 7, 17 Search PubMed.
- T. Lechleitner, F. Klauser, T. Seppi, J. Lechner, P. Jennings, P. Perco, B. Mayer, D. Steinmüller-Nethl, J. Preiner, P. Hinterdorfer, M. Hermann, E. Bertel, K. Pfaller and W. Pfaller, Biomaterials, 2008, 29, 4275–4284 CrossRef CAS PubMed.
- V. Maybeck, R. Edgington, A. Bongrain, J. O. Welch, E. Scorsone, P. Bergonzo, R. B. Jackman and A. Offenhäusser, Adv. Healthcare Mater., 2014, 3, 283–289 CrossRef CAS PubMed.
- L. Tang, C. Tsai, W. W. Gerberich, L. Kruckeberg and D. R. Kania, Biomaterials, 1995, 16, 483–488 CrossRef CAS PubMed.
- P. Ariano, O. Budnyk, S. Dalmazzo, D. Lovisolo, C. Manfredotti, P. Rivolo and E. Vittone, Eur. Phys. J. E: Soft Matter Biol. Phys., 2009, 30, 149–156 CrossRef CAS PubMed.
- G. Wrobel, M. Höller, S. Ingebrandt, S. Dieluweit, F. Sommerhage, H. P. Bochem and A. Offenhäusser, J. R. Soc., Interface, 2008, 5, 213–222 CrossRef PubMed.
- C. Chiappini, E. De Rosa, J. O. Martinez, X. Liu, J. Steele, M. M. Stevens and E. Tasciotti, Nat. Mater., 2015, 14, 532–539 CrossRef CAS PubMed.
- Z. Li, J. Song, G. Mantini, M.-Y. Lu, H. Fang, C. Falconi, L.-J. Chen and Z. L. Wang, Nano Lett., 2009, 9, 3575–3580 CrossRef CAS PubMed.
- D. Kim, G. Lee, G. Kim and S. Lee, Nanoscale Res. Lett., 2012, 7, 1–8 CrossRef PubMed.
- Y. Iwanaga, D. Braun and P. Fromherz, Eur. Biophys. J., 2001, 30, 17–26 CrossRef CAS PubMed.
- G. Panaitov, S. Thiery, B. Hofmann and A. Offenhäusser, Microelectron. Eng., 2011, 88, 1840–1844 CrossRef CAS.
- G. Bugnicourt, J. Brocard, A. Nicolas and C. Villard, Langmuir, 2014, 30, 4441–4449 CrossRef CAS PubMed.
- G. Piret, M. Perez and C. N. Prinz, Biomaterials, 2013, 34, 875–887 CrossRef CAS PubMed.
- D. Brüggemann and K. E. Michael, Int. J. Nano Biomater., 2012, 4, 108–127 CrossRef.
- A. Hai, D. Kamber, G. Malkinson, H. Erez, N. Mazurski, J. Shappir and M. E. Spira, J. Neural Eng., 2009, 6, 66009 CrossRef PubMed.
- M. Kwiat, R. Elnathan, A. Pevzner, A. Peretz, B. Barak, H. Peretz, T. Ducobni, D. Stein, L. Mittelman, U. Ashery and F. Patolsky, ACS Appl. Mater. Interfaces, 2012, 4, 3542–3549 CAS.
- A. Hai, A. Dormann, J. Shappir, S. Yitzchaik, C. Bartic, G. Borghs, J. P. M. Langedijk and M. E. Spira, J. R. Soc., Interface, 2009, 6, 1153–1165 CrossRef CAS PubMed.
- T. E. Mcknight, A. V. Melechko, B. L. Fletcher, S. W. Jones, D. K. Hensley, D. B. Peckys, G. D. Griffin, M. L. Simpson and M. N. Ericson, J. Phys. Chem. B, 2006, 110, 15317–15327 CrossRef CAS PubMed.
- L. Hanson, Z. C. Lin, C. Xie, Y. Cui and B. Cui, Nano Lett., 2012, 12, 5815–5820 CrossRef CAS PubMed.
Footnote |
| † Electronic supplementary information (ESI) available. See DOI: 10.1039/c6ra20207a |
| This journal is © The Royal Society of Chemistry 2017 |

