 Open Access Article
Creative Commons Attribution 3.0 Unported Licence
Biosynthesis of zinc sulfide quantum dots using waste off-gas from a metal bioremediation process
Angela J. Murray†
a,
Jimmy Roussel†a,
John Rolleya,
Frankie Woodhalla,
Iryna P. Mikheenkoa,
D. Barrie Johnsonb,
Jaime Gomez-Bolivarc,
Mohamed L. Merrounc and
Lynne E. Macaskie *a
*a
aUnit of Functional Bionanomaterials, School of Biosciences, University of Birmingham, Edgbaston, Birmingham B15 2TT, UK. E-mail: L.E.Macaskie@bham.ac.uk; Tel: +44-(0)1214145889
bCollege of Natural Sciences, Bangor University, Deiniol Rd., Gwynedd LL57 2UW, UK
cDepartment of Microbiology, Faculty of Sciences, University of Granada, Campus Fuentenueva, 18071, Granada, Spain
First published on 18th April 2017
Abstract
Dissimilatory reduction of sulfate, mediated by various species of sulfate-reducing bacteria (SRB) and a few characterized species of archaea, can be used to remediate acid mine drainage (AMD). Hydrogen sulfide (H2S/HS−) generated by SRB removes toxic metals from AMD as sulfide biominerals. For this, SRB are usually housed in separate reactor vessels to those where metal sulfides are generated; H2S is delivered to AMD-containing vessels in solution or as a gas, allowing controlled separation of metal precipitation and facilitating enhanced process control. Industries such as optoelectronics use quantum dots (QDs) in various applications, e.g. as light emitting diodes and in solar photovoltaics. QDs are nanocrystals with semiconductor bands that allow them to absorb light and re-emit it at specific wavelength couples, shifting electrons to a higher energy and then emitting light during the relaxation phase. Traditional QD production is costly and/or complex. We report the use of waste H2S gas from an AMD remediation process to synthesize zinc sulfide QDs which are indistinguishable from chemically prepared counterparts with respect to their physical and optical properties, and highlight the potential for a empirical process to convert a gaseous “waste” into a high value product.
Introduction
Hydrogen sulfide is a waste product from the dissimilatory reduction of sulfate, elemental sulfur and other oxidized sulfur species. The latter are used as terminal electron acceptors, coupled to the oxidation of organic (e.g. lactate) or inorganic (e.g. hydrogen) electron donors, by some species of bacteria and archaea, under anaerobic conditions. Although H2S is highly toxic, biosulfidogenesis is a very useful process in some contexts, e.g. for remediating acidic metal-contaminated waste waters, recovering metals from process waters and removing soluble sulfate. The ‘ThioTeq’ (operated by Paques, The Netherlands) and ‘BioSulphide’ (operated by BioteQ, Canada) processes use neutrophilic bacteria to generate H2S from sulfate and elemental sulfur, respectively, in full-scale bioremediation operations. In the Talvivaara mine in Finland, H2S is used to selectively remove nickel from pregnant leach solutions (PLS) generated by bioleaching a polymetallic ore body.1 Biosulfidogenic reactors that operate at pH 2.5–4.0 have also been established at the laboratory scale, used to remove sulfate2 and to selectively precipitate transition metals as sulfides either within the bioreactor itself3 or within a separate reaction vessel.4 One advantage of mediating sulfate reduction in acidic liquors is that the end products are almost exclusively H2S and CO2 rather than, at higher pH, H2S/HS− and HCO3−. H2S and CO2 are readily transferred in waste gas streams from bioreactors to other reactor vessels to facilitate off-line metal precipitation.Contacting H2S with many (chalcophilic) transition metal cations can, depending on factors such as pH, generate metal sulfides. Nanoparticulate metal sulfides are a major current focus due to their potential applications in optoelectronic devices.5 Optoelectronics industries increasingly rely on quantum dots (QDs) for applications such as light emitting diodes and solar photovoltaics. QDs are nanocrystals with semiconductor bands that allow them to absorb light and re-emit it intensely at specific wavelength couples. This property is confined to small nanoparticles (NPs) which allow electrons to be shifted to a higher energy and then emit light towards the red end of the spectrum during the relaxation phase. The QD elemental composition, and the presence of doping agent, determine its electronic band gaps and can be used to tune the QD to the desired red-shifted emission wavelengths. However traditional QD production at scale is costly and/or complex.
Zinc sulfide is a II–VI semiconducting material with a bandgap varying from 3.7 eV (bulk material) to 4.2 eV (NPs)6,7 with a large exciton energy (∼40 meV) which has been applied in devices such as flat panel displays and light emitting diodes.8 The QDs that comprise such materials consist of NPs usually synthesized and stabilized in such as way as to reduce agglomeration. This is important because the quantum yield (number of electrons released by a photocell per photon of incident radiation of a given energy) is higher by using NPs than that from larger particles, underpinning the former as the focus of current applications.8 Zinc is especially attractive in, for example, biological imaging due to its relatively low biological toxicity.
Quantum dot particles are usually synthesized chemically in organic solvent9 or in the presence of a surfactant or capping agent to prevent agglomeration. Typical organic and wet chemical methods of quantum dot production, e.g. aqueous colloidal synthesis, micro-emulsions etc. may have limited reproducibility and are costly (see ref. 10 for overview). Various options have been examined to reduce the high cost of synthesis of ZnS NPs at scale. Khani et al.11 used ZnCl2 and Na2S with 2-mercaptoethanol as the capping agent. Later, Senthilkumar et al.12 used Zn2+ solution with Na2S and mercaptopropionic acid in the presence of tetrapropyl ammonium hydroxide with a refluxing step. The absorption edge was 315 nm, the emission peak was ∼415 nm and the QD size was ∼4–5 nm.12 A similar study produced ZnS QDs of size 3.5 nm using Zn2+, Na2S and thiolactic acid, observing QD absorbance and emission at 279 nm and 435 nm respectively.13
In a preliminary test we established that ZnS made by gassing a complex bioleach liquor containing Zn2+ produced metal sulfide material with no optical property, probably due to the presence of a mixture of metals in the leachate and precluding a simple ‘waste to QD product’ process. This highlighted the need for a well-defined metal solution or segregation of metals from the waste, e.g. as described by Nancucheo & Johnson.3 As an alternative to using waste metals, the objective of this study was to fabricate ZnS quantum dots by using a Zn2+ solution and by feeding excess H2S from the off-gas from the sulfidogenic metal remediation process. We report the light emitting property of the resulting ZnS quantum dots in comparison with those made by published chemical methods requiring more complex synthetic procedures.
Materials and methods
Microbial growth, H2S production and formation of ZnS
For batch-tests, the sulfate-reducing deltaproteobacterium Desulfovibrio desulfuricans NCIMB 8307 was grown anaerobically in Postgate's medium C. Gas samples were withdrawn from the culture headspace, through a rubber septum, during (i) mid-late exponential growth phase, (ii) after 48 h, and (iii) following culture ageing for several weeks with no further addition of nutrients. Test solutions (40 mL of 50 mM ZnSO4 in 50 mM citrate buffer, pH 6.0) were put into 50 mL serum bottles, which were sealed with rubber septa, and the head space air was displaced with N2 gas bubbled through the mixture, allowing air to escape though a needle in the septum. Gas samples (5 mL per addition) from the D. desulfuricans culture were injected into zinc sulfate–buffer solution in the serum bottle under positive pressure, and bottles were shaken to facilitate mass transfer through the liquid phase. The pressure was released via insertion of a needle after every 10 mL of gas addition. The white precipitate obtained from several sequential injections was harvested by centrifugation, washed in water (purified by reverse osmosis) twice (50 mL) and the putative nanoparticles (NPs) were resuspended in aqueous dispersion. ZnS was also generated using a N2/H2S gas stream from a low pH (4.0) continuous-flow sulfidogenic bioreactor, which used glycerol as the electron donor.4 Hydrogen sulfide generated by SRB in the reactor vessel was removed in a continuous stream of oxygen-free nitrogen. The gas flow rate was 185 mL min−1, and the H2S content was 0.1%. This gas was fed into a bottle containing 40 mL of 50 mM zinc sulfate/citrate solution (as above) for 5 min intervals, with shaking between dosings. Samples were stored in the dark (4 °C) and examined as described for batch tests using D. desulfuricans. Experiments were carried out at least twice using separate batch preparations of D. desulfuricans or in two sampling periods from the continuous sulfidogenic reactor, separated by several weeks.Analysis of head gas of D. desulfuricans
The head gas was analyzed by GC (Waters GCT Premier gas chromatograph) fitted with an orthogonal acceleration-flight of time mass spectrometer. The m/z range was from 0 to 80 and m/z values were compared with literature databases.Examination of material by use of scanning and transmission electron microscopy, X-ray powder diffraction (XRD) and analytical disc centrifuge
For routine TEM examination, the samples were diluted in distilled water (1![[thin space (1/6-em)]](https://www.rsc.org/images/entities/char_2009.gif) :
:![[thin space (1/6-em)]](https://www.rsc.org/images/entities/char_2009.gif) 5 vol/vol), 3 μL of the diluted sample was applied onto copper grids (formvar coated 3 mm, 300 mesh) and left to air dry briefly. The grids were then carefully submerged in distilled water (to remove residual solute and prevent inorganic salt crystallization), and air dried. Samples were examined using a Jeol 1200-EX TEM (accelerating voltage 80 kV). Dried samples (50 °C; desiccator) were also washed with water (2 × 50 mL) and examined (vacuum mode) using an environmental scanning electron microscope (ESEM: Philips XL-30; LaB6 filament) fitted with a HKL EBSD system with NodrlysS camera, and an INCA EDS detector (Oxford Instruments) for energy dispersive X-ray analysis (EDS). High resolution transmission and scanning-transmission electron microscopy (TEM-STEM) were performed using a Tecnai F30 (FEI) instrument at a working voltage of 300 kV. TEM images and Selected Area Electron Diffraction (SAED) patterns were obtained with a coupled CCD camera (Gatan), whereas High Angle Annular Dark Field (STEM-HAADF) images were obtained with a HAADF detector (Fischione). In order to confirm the chemical composition of the materials, X-ray Energy Dispersive Spectra (EDS) were obtained with an EDAX detector. Lattice spacings were determined using “ImageJ” through profiling of high resolution HRTEM images and compared against lattice spacing of ZnS from the JCPDS 79-0043 database.
5 vol/vol), 3 μL of the diluted sample was applied onto copper grids (formvar coated 3 mm, 300 mesh) and left to air dry briefly. The grids were then carefully submerged in distilled water (to remove residual solute and prevent inorganic salt crystallization), and air dried. Samples were examined using a Jeol 1200-EX TEM (accelerating voltage 80 kV). Dried samples (50 °C; desiccator) were also washed with water (2 × 50 mL) and examined (vacuum mode) using an environmental scanning electron microscope (ESEM: Philips XL-30; LaB6 filament) fitted with a HKL EBSD system with NodrlysS camera, and an INCA EDS detector (Oxford Instruments) for energy dispersive X-ray analysis (EDS). High resolution transmission and scanning-transmission electron microscopy (TEM-STEM) were performed using a Tecnai F30 (FEI) instrument at a working voltage of 300 kV. TEM images and Selected Area Electron Diffraction (SAED) patterns were obtained with a coupled CCD camera (Gatan), whereas High Angle Annular Dark Field (STEM-HAADF) images were obtained with a HAADF detector (Fischione). In order to confirm the chemical composition of the materials, X-ray Energy Dispersive Spectra (EDS) were obtained with an EDAX detector. Lattice spacings were determined using “ImageJ” through profiling of high resolution HRTEM images and compared against lattice spacing of ZnS from the JCPDS 79-0043 database.
XRD analysis of powdered, dried samples was carried out using a Bruker D8 Advanced Powder X-ray Diffractometer; 2 theta range of 20–70° with step of 0.02°; 25 °C.
Particle size distribution analysis was performed on aqueous NP suspensions using differential centrifugation (CPS 24000 analytical disc centrifuge: Analytik Ltd). Samples were analyzed via injection into the centrifuge with a sucrose gradient (8–24%) applied to separate the particles by size on a disc rotating at 22![[thin space (1/6-em)]](https://www.rsc.org/images/entities/char_2009.gif) 000 rpm. Detection of the number of particles was estimated using a light detector on the edge of the disc and the particle size was estimated using software supplied by the manufacturer. The lowest limit of detection was ∼5 nm.
000 rpm. Detection of the number of particles was estimated using a light detector on the edge of the disc and the particle size was estimated using software supplied by the manufacturer. The lowest limit of detection was ∼5 nm.
Spectroscopic analysis of materials
Prior to analysis, samples were diluted to an absorbance of 0.2–0.8. The absorption, excitation and emission wavelengths were determined using, respectively, a Cary 50 Eclipse UV-visible spectrometer (scanning range from 200 nm to 800 nm) using 3 mL quartz cuvettes and a FLSP920 Time Resolved Spectrometer in a quartz cuvette over a range of excitation wavelengths from 250 nm to 450 nm; emission peaks were quantified from 350 nm to 650 nm for the emission wavelength by use of a 340 nm filter.Reproducibility of data
Experiments were carried out multiple times in succession using separate bacterial preparations by way of two research teams separated by ∼two years, with similar results.Results and discussion
Effect of culture age and headspace gas analysis
Identical results were obtained using head gas samples withdrawn from actively growing cultures of D. desulfuricans during mid-late exponential growth, after 48 h and by using aged cultures after several weeks. Analysis of the culture head gas (Fig. 1) shows peaks at m/z values of 33.0–36.0 which correspond to the fragmentation pattern of H2S. No dimethyl sulfide (CH3CH3S; m/z = 62) or dimethyl disulfide (CH3CH3S2 m/z = 94–97), which could have provided a ‘capping’ function, were detected. An unidentified peak at m/z = 40.0 was attributed to background noise from the instrument and additional peaks at m/z of 63.9 and 44–45 m/z were not identified further. The concentration of H2S in the headspace of the batch cultures was not quantified.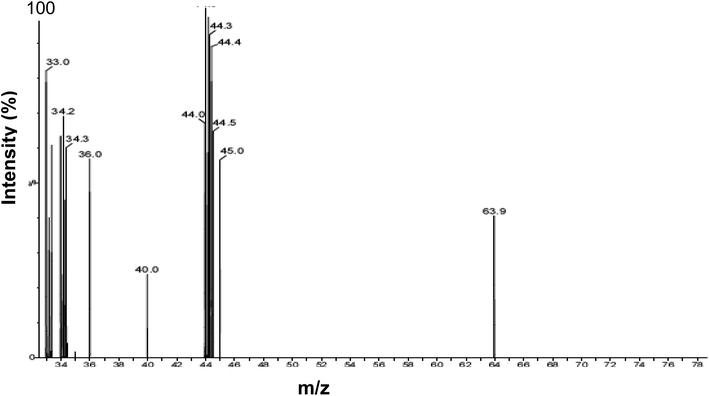 | ||
| Fig. 1 Analysis of D. desulfuricans culture headspace gas using GC-MS. Peaks (m/z) were assigned by reference to MS databases. | ||
Examination of the material made via culture head gas
A turbid white suspension was formed immediately after addition of D. desulfuricans off-gas into the serum bottle (Fig. 2a) which settled only slowly (several days) under gravity. Similar results were obtained using the batch cultures and the sulfidogenic culture off-gas. A colloidal suspension was similarly observed by Bol et al. (2002)14 during chemical synthesis of ZnS nanoparticles. The expected compounds formed under anoxic conditions are amorphous ZnS, crystallized sphalerite (a gemstone) or wurtzite, a zinc iron sulfide mineral. However, the former is yellow, orange or green while the latter is orange/reddish brown to black, whereas the material formed here was white (Fig. 2a). The minerals have crystallite diameters on the micrometer scale.15 During preparation of the material for solid state analysis (by XRD; below) a large agglomerated structure was apparent (by ESEM) after centrifugation (Fig. 2b). Dried precipitate, made from the suspension and viewed by ESEM (Fig. 2c, inset) and TEM at 80 kV (Fig. 2d, inset) appears to comprise nanoparticles of size estimated at 20–40 nm, with smaller NPs visible within the larger ones (Fig. 2c inset). A size distribution analysis of the small NP inclusions was precluded due to their lack of definition (Fig. 2c, inset) while the larger NPs were not sufficiently well separated for analysis with confidence (Fig. 2d, inset).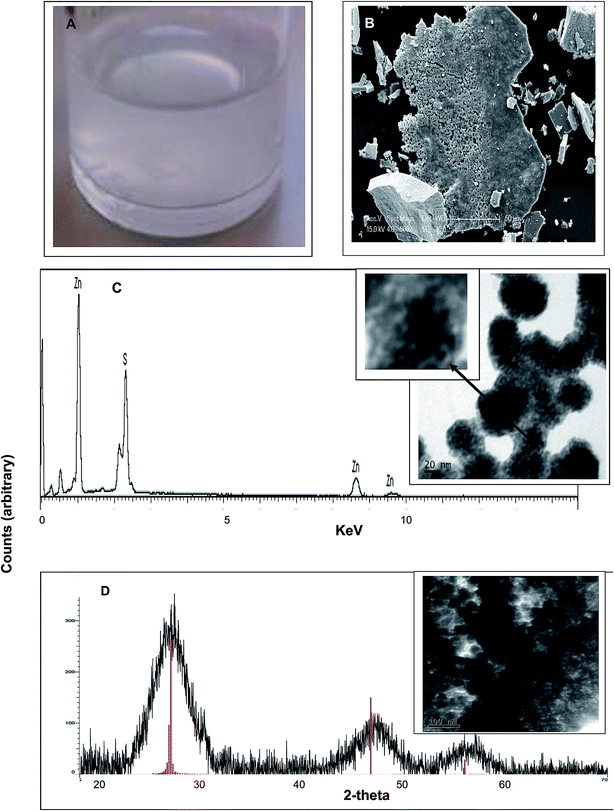 | ||
| Fig. 2 Material formed after addition of D. desulfuricans head-gas to a mixture of 50 mM ZnSO4 and 50 mM citrate buffer, pH 6. Similar results were obtained using the sulfidogenic bioreactor off-gas. (A) White precipitate formed in the solution. (B) Appearance of the material by ESEM following centrifugation to make a pellet. (C) EDS analysis (under ESEM) of specimen microareas with peaks assigned to Zn and S. Inset: appearance of the material by TEM under accelerating voltage of 80 kV (for good contrast25) note the speckled appearance of individual nanoparticles (bar is 20 nm). (D) X-ray powder diffraction analysis of the bulk material shown inset (bar is 100 nm). Vertical lines are reference peaks for ZnS (file: 04-017-5723). | ||
The putative zinc sulfide nano-material (Fig. 2a and b) was formed identically in contact with both sources of biological head gas which contained H2S. Energy dispersive X-ray analysis confirmed the presence of both zinc and sulfur (Fig. 2c); the mass ratio was determined (mass percentage) as Zn![[thin space (1/6-em)]](https://www.rsc.org/images/entities/char_2009.gif) :
:![[thin space (1/6-em)]](https://www.rsc.org/images/entities/char_2009.gif) S of 2
S of 2![[thin space (1/6-em)]](https://www.rsc.org/images/entities/char_2009.gif) :
:![[thin space (1/6-em)]](https://www.rsc.org/images/entities/char_2009.gif) 1. Since the atomic weight of zinc (65.4 g mol−1) is about twice that of sulfur (32.1 g mol−1) the ratio of Zn
1. Since the atomic weight of zinc (65.4 g mol−1) is about twice that of sulfur (32.1 g mol−1) the ratio of Zn![[thin space (1/6-em)]](https://www.rsc.org/images/entities/char_2009.gif) :
:![[thin space (1/6-em)]](https://www.rsc.org/images/entities/char_2009.gif) S was 1
S was 1![[thin space (1/6-em)]](https://www.rsc.org/images/entities/char_2009.gif) :
:![[thin space (1/6-em)]](https://www.rsc.org/images/entities/char_2009.gif) 1, supporting the identification of the material as ZnS. To confirm this, XRD analysis (Fig. 2d) showed a crystalline structure with three distinct peaks at 2 theta of 28.9°, 47.6° and 57.5°, matching with the ZnS reference and confirming the identity of the material. XRD also gives information about the crystal structure. Several studies11,12,16,17 have shown that the three peaks can be assigned to the reflection of a cubic crystal structure of ZnS with c(111) at 28.9°, c(220) at 47.6° and c(311) at 57.5°. The XRD powder pattern was also used to calculate the crystalline domain size by application of the Debye–Scherrer equation.18 The average size from the three peaks gave a diameter of 2.3 nm. This value was similar to that (1.5–3.0 nm) found during XRD analysis of several ZnS materials11,16 and it was concluded that ZnS nanoparticles were formed. The NP size found by XRD (2.3 nm) was smaller than the NPs visible in Fig. 2c (inset) and was in ∼accordance with the small NPs within the agglomerations (Fig. 2c, inset, arrowed). The size and appearance of the NPs by electron microscopy is in accordance with those reported by Ramachandran et al.19 obtained at an accelerating voltage of 30–50 kV; these authors estimated the small NP size of ∼6 nm with aggregation attributed to van der Waals forces between the small particles to form the larger bodies19 while similar structures were observed by Shahid et al.20 and also by Shin et al.21 in the case of CdSe/ZnS core–shell QDs (ZnS shell).
1, supporting the identification of the material as ZnS. To confirm this, XRD analysis (Fig. 2d) showed a crystalline structure with three distinct peaks at 2 theta of 28.9°, 47.6° and 57.5°, matching with the ZnS reference and confirming the identity of the material. XRD also gives information about the crystal structure. Several studies11,12,16,17 have shown that the three peaks can be assigned to the reflection of a cubic crystal structure of ZnS with c(111) at 28.9°, c(220) at 47.6° and c(311) at 57.5°. The XRD powder pattern was also used to calculate the crystalline domain size by application of the Debye–Scherrer equation.18 The average size from the three peaks gave a diameter of 2.3 nm. This value was similar to that (1.5–3.0 nm) found during XRD analysis of several ZnS materials11,16 and it was concluded that ZnS nanoparticles were formed. The NP size found by XRD (2.3 nm) was smaller than the NPs visible in Fig. 2c (inset) and was in ∼accordance with the small NPs within the agglomerations (Fig. 2c, inset, arrowed). The size and appearance of the NPs by electron microscopy is in accordance with those reported by Ramachandran et al.19 obtained at an accelerating voltage of 30–50 kV; these authors estimated the small NP size of ∼6 nm with aggregation attributed to van der Waals forces between the small particles to form the larger bodies19 while similar structures were observed by Shahid et al.20 and also by Shin et al.21 in the case of CdSe/ZnS core–shell QDs (ZnS shell).
Characterization of nanoparticles using differential centrifugal analysis
XRD is a ‘bulk’ method that gives information about average nanoparticle sizes but not size distributions. Size distribution was not possible to analyze by direct examination (data from several authors: above). Moreover, the samples were dried for EM examination. Particle size distribution analysis used differential centrifugal sedimentation and wet samples, confirming the presence of NPs in the suspensions (Fig. 3), of size distribution from below 10 nm to 20 nm. The mean NP size of those detected (by number count, ignoring those below 5 nm) was 13 nm; the lowest detection limit of the analytical disc centrifuge under the conditions used is ∼5 nm so an accurate analysis of small NPs was not possible. The average size, of those that could be determined by this method (Fig. 3), was within the range (5–20 nm) of ZnS QDs produced in earlier studies6,22 as well as the measurement by XRD (∼2–3 nm: above) aligning with other reports (3.5 nm (ref. 12 and 13)). The actual size deduced is governed to some extent by the method used but this method of size distribution analysis suggests the absence of large NPs or agglomerations, contrasting with Fig. 2c and d (insets). Since the analytical disc centrifuge was used at near to its detection limit these results may be subject to error in the case of small NPs but confirm both direct observation of the small NPs within agglomerations (Fig. 2c, inset), and those from XRD analysis (Fig. 2d); most of the particles were suggested to be between 3–15 nm diameter. The strength of the centrifugal analysis is that the suspension can be examined dynamically, i.e. in the native state without drying or other preparation, which would also enable the evolution of NPs to be followed in real time or to quantify the effects of capping agents in a way that electron microscopy cannot. The ‘snapshot’ of Fig. 3, at the specified sucrose gradient and rotating disc speed, revealed only ∼5% of the NPs to be of sizes more than 20 nm and approximately 50% of them of ∼10 nm, in apparent contradiction to the TEM data. It is not possible to obtain a size distribution of the smallest NPs; the rate of NP sedimentation and analysis time is controlled by various factors both sample based (size and density) and instrument based (disc speed, sedimentation volume/depth and fluid viscosity). It is possible to size particles down to 3–4 nm using particles of high density e.g. gold nano-particles (density 19.3 g cm−3) but not attainable with ZnS (density < 10 g cm−3). Even with a long sedimentation time data become unreliable due to Brownian motion effects between sedimenting particles and fluid/solvent (H. Vegad, personal communication).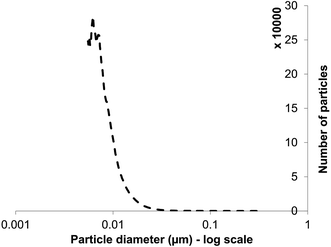 | ||
| Fig. 3 Particle size distribution (number of particles at each size) for ZnS quantum dots (lower detection limit: 5 nm) obtained by differential centrifugal sedimentation analysis. | ||
We suggest that the centrifugal forces in the sucrose density gradient could be sufficient to overcome the van der Waals forces holding the agglomerations. However, while van der Waals forces are simple to calculate between parallel surfaces of >10 nm apart, a calculation between only two nanospheres <5 nm apart becomes difficult,23 and, with the agglomerations comprising many small NPs, and additional consideration of the differential centrifugal force, the calculation is well beyond the scope of this study. An alternative explanation is that while drying (used in the EM method but not in the differential centrifugal method) the small NPs are pulled together by water surface tension force which causes them to agglomerate artifactually; hence the centrifugal method gives a more accurate representation. In support of this, the technique is used widely to characterize latexes and emulsions, agglomerates and aggregates such as protein clusters, dimers, trimers and tetramers of proteins and virus particles. All of these are held together by van der Waals forces yet the observed peaks for these materials correspond to the different sizes (e.g. ref. 24) i.e. the centrifugal force does not have a disrupting effect on these entities and there is no reason to suggest that ZnS NPs should be any different.
We conclude that the use of electron microscopy to obtain particle size distributions has limitations in the case of ZnS; even with a high contrast image (e.g. ref. 19) the small NPs are insufficiently well defined and well separated to facilitate reliable computational image analysis. The differential centrifugal sedimentation method can give a size distribution profile with a cutoff of about 5–6 nm and hence neither method is satisfactory. An average ZnS NP size (2.4 nm) was back-calculated from the absorption peak using Brus' effective model;20 this analysis method agrees with the XRD data we report (above) but, again, the calculation from optical data does not inform about the NP size distribution.
Characterization by high resolution TEM
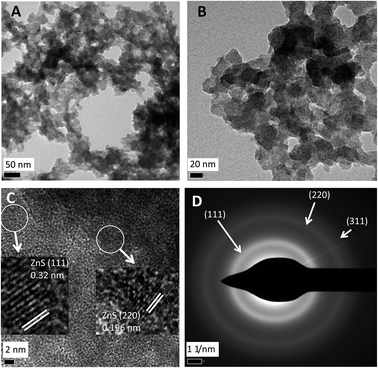
In order to obtain high resolution data via HRTEM an accelerating voltage of 300 kV was used. The EDS data obtained thus (not shown) confirmed that shown in Fig. 2c. Egerton25 noted that while high voltages give high resolution for structural analysis lower voltages can be useful to provide more contrast for size and morphology analysis (as above). Accordingly, under HRTEM the details of the NPs were lost (Fig. 4a and b) but fine structure is apparent in Fig. 4c which shows the lattice fingers in crystalline material with lattice interplanar spacings of 0.32 nm corresponding to the ZnS (111) facet and 0.196 nm corresponding to the ZnS (220) facet. Examination by SAED (Fig. 4d) shows diffraction rings indexed to the (111), (220) and (311) planes to the cubic phase; both sets of data are in agreement with the XRD data in Fig. 3d and are consistent with other reports.19–21,26Optical properties of biogenic zinc sulfide nanoparticles and potential for use as quantum dots
The presence of nano-material per se is not sufficient to obtain quantum dots; the compound in suspension must possess a semi-conductor band allowing the absorption of light energy by electron displacement. During the electron relaxation, the energy stored is released as light emission at a specific wavelength; the characteristic of the band is determined by its specific absorption and emission wavelengths.The zinc sulfate/citrate solution was sparged with the H2S/N2 gas from the sulfidogenic bioreactor for increasing times up to 35 min. The emission peak intensity of the ZnS material obtained (see below) was proportional to the period of gas-sparging. Saturation, after ∼25 min, had no apparent effect on the emission peak position of the ZnS product. The exposure time did not therefore influence the QD size, and particles did not start to aggregate, and thereby lose their optical properties.
Examination of both sets of materials by UV-visible spectroscopy showed absorption in a band width of 270–320 nm (Fig. 5) with a peak at 290 nm, suggesting that the suspended NPs have an electronic gap band of 4.2 eV (E = hc/λ; E is photon energy h is Planck constant, λ wavelength and c speed of light). A ZnS nanoparticle has a high band gap and so absorbs in the UV part of the spectrum while macro-ZnS (lower band gap) absorbs in the visible spectrum, via deduction from the energy band gap difference between macro and nano size (E = 3.6 eV for macrostructure and 4.2 eV for a nanostructure).
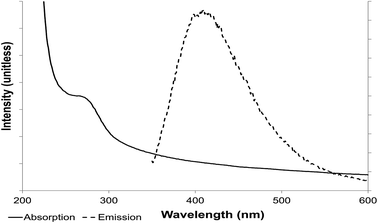 | ||
| Fig. 5 Photoluminescence properties of ZnS quantum dots. Absorption (solid line) and emission (dotted line) spectroscopy. | ||
This absorption wavelength (Fig. 5) was used to excite the electron present on the valence orbital onto the first excited orbital. The light-emission wavelength, resulting from the release of the electron to the valence band, was determined, with an emission peak of 410 nm. The maximum was conserved at an excitation wavelength of 290–305 nm (optimally at 290 nm) (Fig. 5 and 6).
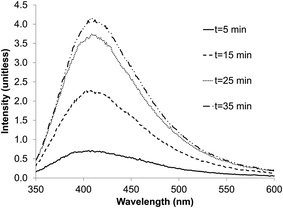 | ||
| Fig. 6 Effect of exposure time to AMD sulfidogenic bioreactor off-gas on the emission peaks for biogenic ZnS quantum dots. | ||
Light emission from the suspended ZnS NPs was observed in the visible spectrum (excitation wavelength 290–310 nm) with photoluminescence in a broad spectrum from 350 nm to 500 nm, around the peak emission at 410 nm. Several different excitation wavelengths (270–320 nm) were used to confirm that the emission was from this band gap and to determine the best excitation wavelength (290 nm) and the couple excitation/emission wavelengths of 290/410 nm for the suspended ZnS nanoparticles.
The results reported here are in accordance with other authors; Shahid et al.20 noted an emission peak for cubic phase ZnS QDs at 439 nm (excitation at 260 nm), discussing their results in terms of strong quantum confinement effects, the quantum confinement arising from the small size of the ZnS QDs comparable to the excitonic Bohr diameter;20 with cubic phase ZnS this is ∼2.4 nm.27 Further, Shahid et al.20 calculated the size of the QDs to be 2.4 nm from the absorption peak using Brus' effective model which is in agreement with the results obtained here using XRD. However the optical data was not used to inform about NP size distribution. As shown in Fig. 5, the emission peak20 was broad with no strongly defined maximum. Ramachandran et al.19 noted an emission peak at 424 nm (excitation at 320 nm) for a ZnS/graphene composite, i.e. a slight red-shift in the excitation and emission wavelengths as compared to the work reported here; they suggested that the electronic properties of the ZnS are modified by the presence of electrically conductive graphene, also noting that the photoluminescence intensity of the composite was higher than that of pure ZnS NPs, attributed to an energy transfer from graphene to ZnS.
In two cases20,26 the emission peak for ZnS QDs was similarly broad to that shown in Fig. 5; Ramachandran et al.19 reported a narrower peak (412–437 nm) but this was not attributable to the presence of graphene since the peaks obtained by ZnS with and without graphene were identical. These works, in accordance with the current study, have focused on the light emitting properties of ZnS QDs but have tended to overlook the quantum yield which is also important with respect to future applications. The QY of the biogenic material is under current consideration.
Conclusions
It is concluded that, by a very simple one-step method, ZnS quantum dots analogous to those produced commercially and as reported by numerous authors, can be made in a scalable way via using waste biogenic H2S. This produces both a safe disposal route for this toxic gaseous byproduct of AMD remediation and a potentially valuable material. The Zn2+ is not placed in contact with the bacteria and hence metal toxicity to them is not an issue, while the product contains no bacterial cells. Harnessing a continuous bioprocess for H2S production would overcome potential issues of economic QD production at scale and this approach would be applicable also to making sulfide quantum dots of other group IIB metals.Acknowledgements
This work was supported by NERC (Grant No. NE/L014076/1 and NE/L014114/1). We acknowledge with thanks useful discussions with Prof Z. Pikramenou (University of Birmingham) and H. Vegad (Analytik). This research was supported through Birmingham Science City (West Midlands Centre for Advanced Materials Project 2), with support from Advantage West Midlands and part funded by the European Regional Development Fund.References
- P. Saari and M. Riekkola, J. South. Afr. Inst. Min. Metall., 2012, 112, 1013–1020 Search PubMed.
- I. Nancucheo, S. Hedrich and D. B. Johnson, Mineral. Mag., 2012, 76, 2683–2692 CrossRef CAS.
- I. Nancucheo and D. B. Johnson, Microb. Biotechnol., 2012, 5, 34–44 CrossRef CAS PubMed.
- S. Hedrich and D. B. Johnson, Environ. Sci. Technol., 2014, 48, 12206–12212 CrossRef CAS PubMed.
- P. F. Smet, I. Moreels, Z. Hens and D. Poelman, Materials, 2010, 3, 2834–2883 CrossRef CAS.
- J. Huang, Y. Yang, S. Xue, B. Yang, S. Liu and J. Shen, Appl. Phys. Lett., 1997, 70, 2335–2337 CrossRef CAS.
- A. A. Khosravi, M. Kundu, L. Jatwa, K. Deshponde, U. A. Bhagwart, M. Sasatry and S. K. Kulkami, Appl. Phys. Lett., 1995, 67, 2702–2704 CrossRef CAS.
- C. H. Lai, M. Y. Lu and L. J. Chen, J. Mater. Chem., 2012, 22, 19–30 RSC.
- R. L. Johnston and J. P. Wilcoxon, Metal Nanoparticles and Nanoalloys, Elvesier, London, 2012, vol. 3 Search PubMed.
- N. Dixit and H. P. Soni, Superlattices Microstruct., 2014, 65, 344–352 CrossRef CAS.
- O. Khani, H. R. Rajabi, M. H. Yousefi, A. A. Khosravi, M. Jannesari and M. Shamsipur, Spectrochim. Acta, Part A, 2011, 79, 361–369 CrossRef CAS PubMed.
- K. Senthilkumar, K. Ramamurthi, T. Kalaivani and V. Balasubramanian, Indian J. Adv. Chem. Sci., 2013, 2, 1–5 Search PubMed.
- A. Mandal, A. Dandapat and G. De, Analyst, 2012, 137, 765–772 RSC.
- A. A. Bol, J. Ferwerda, J. A. Bergwerff and A. Meijerink, J. Lumin., 2002, 99, 325–334 CrossRef CAS.
- E. Pelletier, P. Ilipila and D. Fowle, Appl. Geochem., 2011, 26, 1673–1680 CrossRef.
- D. J. Jovanovic, I. L. Validzic, I. A. Jankovic, N. Bibic and J. M. Nedeljkovic, Mater. Lett., 2007, 61, 4396–4399 CrossRef CAS.
- N. K. Abbas, K. T. Al-Rasoul and Z. J. Shanan, Int. J. Electrochem. Sci., 2013, 8, 3049–3056 CAS.
- A. L. Patterson, Phys. Rev. B: Condens. Matter Mater. Phys., 1939, 56, 978–982 CAS.
- R. Ramachandran, M. Suranya, P. Kollu, B. P. C. Ragupathy, S. K. Jeong and A. N. Grace, Electrochim. Acta, 2015, 178, 647–657 CrossRef CAS.
- R. Shahid, M. S. Toprak, H. M. A. Soliman and M. Muhammed, Cent. Eur. J. Chem., 2012, 10, 54–58 CrossRef CAS.
- H. Shin, D. Jang, J. Hwang, Y. Jang, M. Cho and K. Park, J. Mater. Sci.: Mater. Electron., 2014, 25, 2047–2052 CrossRef CAS.
- S. Lee, D. Sond, J. Lee, S. Kim, I. Y. Park and M. S. Won, Mater. Sci. Eng., B, 2003, 103, 241–245 CrossRef.
- Y. Luo, R. Zhao and J. B. Pendry, Proc. Natl. Acad. Sci. U. S. A., 2014, 111, 18422–18427 CrossRef CAS PubMed.
- H. Amiri, L. Bordonali, A. Lascialfari, S. Wan, M. P. Monopoli, I. Lynch, S. Laurentg and M. Mahmoudi, Nanoscale, 2013, 5, 8656–8665 RSC.
- R. F. Egerton, Ultramicroscopy, 2014, 145, 85–93 CrossRef CAS PubMed.
- X. Huang, M. G. Willinger, H. Fan, Z. I. Xie, A. K. Hoffmann, F. Girgsdies, C. S. Lee and X. M. Meng, Nanoscale, 2014, 6, 8787–8795 RSC.
- H. Tang, G. Xu, L. Weng, L. Pan and L. Wang, Acta Mater., 2004, 52, 1489–1494 CrossRef CAS.
Footnote |
| † Co-first authors; contributed equally to the work. |
| This journal is © The Royal Society of Chemistry 2017 |

