
Regioselective plasmonic nano-assemblies for bimodal sub-femtomolar dopamine detection†
Fengli
Gao
ab,
Liqiang
Liu
 ab,
Gang
Cui
ab,
Liguang
Xu
ab,
Xiaoling
Wu
*ab,
Hua
Kuang
*ab and
Chuanlai
Xu
ab
ab,
Gang
Cui
ab,
Liguang
Xu
ab,
Xiaoling
Wu
*ab,
Hua
Kuang
*ab and
Chuanlai
Xu
ab
aState Key Laboratory of Food Science and Technology, Jiangnan University, Wuxi, Jiangsu 214122, People's Republic of China. E-mail: wuxiaoling@jiangnan.edu.cn; kuangh@jiangnan.edu.cn; Tel: +86-0510-85329076
bInternational Joint Research Laboratory for Biointerface and Biodetection, and School of Food Science and Technology, Jiangnan University, Wuxi, Jiangsu 214122, People's Republic of China
First published on 23rd November 2016
Abstract
Reliable and ultrasensitive quantification of dopamine (DA) is essential in the precise diagnotherapy of neurological diseases. In this study, dual mode counterpropagating-responsive gold@silver nanoparticle–gold nanorod (Au@AgNP–AuNR) nano-assemblies were fabricated for the precise quantification of DA. The plasmonic Au@AgNP–AuNR assemblies possessed high surface-enhanced Raman scattering (SERS) activity and strong fluorescence quenching, due to the prominent electromagnetic enhancement between the hotspots of the assemblies. In the presence of a DA target, the Au@AgNP–AuNR assemblies dissociated, leading to an increase in fluorescence intensity and a decrease in SERS intensity. The limit of detection (LOD) of DA was 0.04 fM and 0.02 fM by the fluorescence method and SERS method, respectively. The linear range was 0.1–10 fM. These findings demonstrated that the simultaneous positive fluorescence response and negative SERS response ensured the accurate detection of DA, which opens up a new avenue for the early diagnotherapy of neurological diseases.
Introduction
Dopamine (DA), a significant neurotransmitter, is essential for nervous system functions.1,2 An abnormal concentration of DA in vivo is responsible for serious neurological diseases such as epilepsy, Alzheimer's disease, attention deficit hyperactivity disorder, and Parkinson's disease.3–7 Many methods have been developed for the detection of DA, including instrumental methods,8 immunoassays,9 electrochemical detection,5,10–13 colorimetric biosensors,14,15 and others.16,17 Although some progress has been made, these approaches either lacked adequate sensitivity and stability, or required complex pretreatment and costly instruments. There are also reports on DA biosensing using fluorescence and surface-enhanced Raman scattering (SERS), which have resulted in some improvements in sensitivity.18–22 However, these methods are still unsatisfactory for early diagnosis and monitoring.23,24 More importantly, most of these reported studies were focused on the detection of DA using one method, which is not sufficient for the reliable and precise quantification of DA, especially low DA concentrations.Nanoparticles (NPs) and their assemblies are among the most active and intriguing research fields, and have attracted a great deal of attention from both scientists and researchers.25–27 They play important roles in scientific studies and in applications such as biosensing, catalysis, medical health, energy sources, and environmental conservation.25,28–30 In particular, due to the collective synergistic effects of their building blocks, nano-assemblies have excellent optical, electrical, mechanical and magnetic properties.27,31,32 Various nano-assemblies have been reported, including dimers,29 trimers,33 tetramers,32,34,35 helices,36 and other structures.37 In addition, they are assembled from various nanomaterials such as metal NPs, organic polymers, semiconductor NPs, and nanocomposite materials, resulting in SERS,18 chiral activity,29,36 magnetic and fluorescence properties,27 as well as multifunctional features.38
Therefore, in this study, dual mode ultrasensitive detection of DA, with a simultaneous counterpropagating-response, was established. The developed biosensor was based on the self-assembly of fluorescent and SERS encoded Au@AgNP–AuNR heterodimers by a DA aptamer. The Au@AgNP and AuNR building blocks were specifically utilized in the design due to their strong SERS activity. Furthermore, a fluorescent dye (Cy5) was included in the system, endowing the heterodimers with a fluorescent response.
Experimental section
Materials
All chemicals, unless otherwise stated, were purchased from Sigma-Aldrich. Deionized water was obtained using a Milli-Q device. Thiolated DNA sequences and aptamers were obtained from Shanghai Sangon Biological Engineering Technology & Services Co., Ltd and used after purification by high performance liquid chromatography.The detailed aptamer and DNA sequences were as follows:
DNA 1 (DA-aptamer): 5′-SH-GTC TCT GTG TGC GCC AGA GAC ACT GGG GCA GAT ATG GGC CAG CAC AGA ATG AGG CCC-Cy5-3′.
DNA 2 (DA-partly complementary): 3′-CAG AGA CAC ACG AAC CAG ATC ACT TCT TAC TCC GGG-SH-5′.
Instrumentation
Transmission electron microscopy (TEM) images were acquired using a JEOL JEM-2000 at an acceleration voltage of 200 kV. Hitachi F-7000 was employed to characterize the fluorescence spectra. The Raman spectra were measured with a LabRam-HR800 micro-Raman spectrometer, using 633 nm excitation. A Zetasizer Nano ZS system was used to analyse the dynamic light scattering (DLS) data. The Milli-Q device was purchased from Millipore (Molsheim, France).Synthesis of AuNPs
AuNPs (9.8 ± 1.3 nm) were prepared according to reported methods.32 Briefly, 0.25 mM of hydrogen tetrachloroaurate (HAuCl4, 100 mL) was heated to boiling. Then, 3.5 mL of freshly prepared trisodium citrate solution (1% by weight) was added under vigorous stirring. The reaction solution quickly changed to a stable wine red color. After cooling to room temperature, AuNPs were obtained and stored at 4 °C until used.Preparation of Au@AgNPs
Au@AgNPs (12.3 ± 2.2 nm) were obtained by the classic reduction method of a silver nitrate (AgNO3) shell on the surface of AuNPs using ascorbic acid (AA).39 Typically, 20 μL of AgNO3 (0.6 mM), 10 μL of AA (0.1 M), and 20 μL of sodium hydroxide (NaOH, 10 mM) were added to 100 μL of the as-prepared AuNPs solution. Under vigorous stirring for 5 min, the reaction solution was centrifuged at 9000 rpm, and resuspended in deionized water before use.Synthesis of AuNRs
AuNRs were synthesized according to previously published reports, which included the synthesis of Au seeds and the growth of AuNRs.28 Briefly, 0.01 M sodium borohydride (NaBH4, 300 μL) was added to a solution containing HAuCl4 (2.5 mL, 0.5 mM) and 0.2 M hexadecyltrimethylammonium bromide (CTAB, 2.5 mL) under rapid stirring. After 2 min, the Au seed solution was prepared. To grow the AuNRs, AgNO3 (0.15 mL, 4 mM) was slowly added into a clean flask with HAuCl4 (5 mL, 1 mM) and CTAB (5 mL, 0.2 M) solution. The solution was mixed for 5 min and AA (70 μL, 0.079 M) was added. After reacting for 2 min, the as-prepared Au seeds (12 μL) were added under vigorous stirring for 20 s. The reaction solution was then left at 30 °C for 3 h. Finally, the AuNR solution was centrifuged (7000 rpm, 20 min) and resuspended in 5 mM CTAB solution.Modification of Au@AgNPs and AuNRs
The AuNRs and Au@AgNPs were functionalized with DA aptamer (DNA 1) and its partly-complementary DNA (DNA 2), respectively.19 Briefly, AuNRs (100 μL) and Au@AgNPs (100 μL) were centrifuged at 7000 rpm and 7500 rpm, respectively, for 20 min. They were resuspended in 5 mM CTAB–10 mM Tris buffer (AuNRs) and 10 mM Tris buffer, respectively. Then, 2 μL of DNA 1 (5 μM) and DNA 2 were added to the AuNRs and Au@AgNPs solution, respectively, and then incubated for 12 h, followed by centrifugation to remove excess DNA. Finally, the DNA modified AuNRs and Au@AgNPs were resuspended in 100 μL of 5 mM CTAB–10 mM Tris buffer (AuNRs–DNA) and 10 mM Tris buffer (Au@AgNPs–DNA), respectively.DA detection
AuNRs–DNA (100 μL) and Au@AgNPs–DNA (100 μL) were mixed with different concentrations of DA (final concentrations of 0 fM, 0.1 fM, 0.5 fM, 1 fM, 5 fM, 10 fM), respectively. After 6 h of incubation at 35 °C, 1 μL of Raman reporter (4-ATP, final concentration of 10 μM) was added to the mixture.19 The final reaction solutions then underwent fluorescence and Raman measurements.Results and discussion
Establishment of Au@AgNP–AuNR heterodimers
Bimodal counterpropagating-responsive Au@AgNP–AuNR heterodimers were assembled from AuNR–Cy5 modified DA aptamers and Au@AgNPs–partly complementary DNA conjugation according to the protocols described in the Experimental section. Without a DA analyte, the fluorescence intensity of Cy5, located in the hotspots of the heterodimers, was remarkably quenched due to the intense electromagnetic field. Meanwhile, the SERS intensity of Raman reporter 4-ATP was significantly enhanced. In the case of the existence of a DA analyte, fewer heterodimers were formed, resulting in an increase of fluorescence intensity, as well as decrease of SERS intensity (Scheme 1).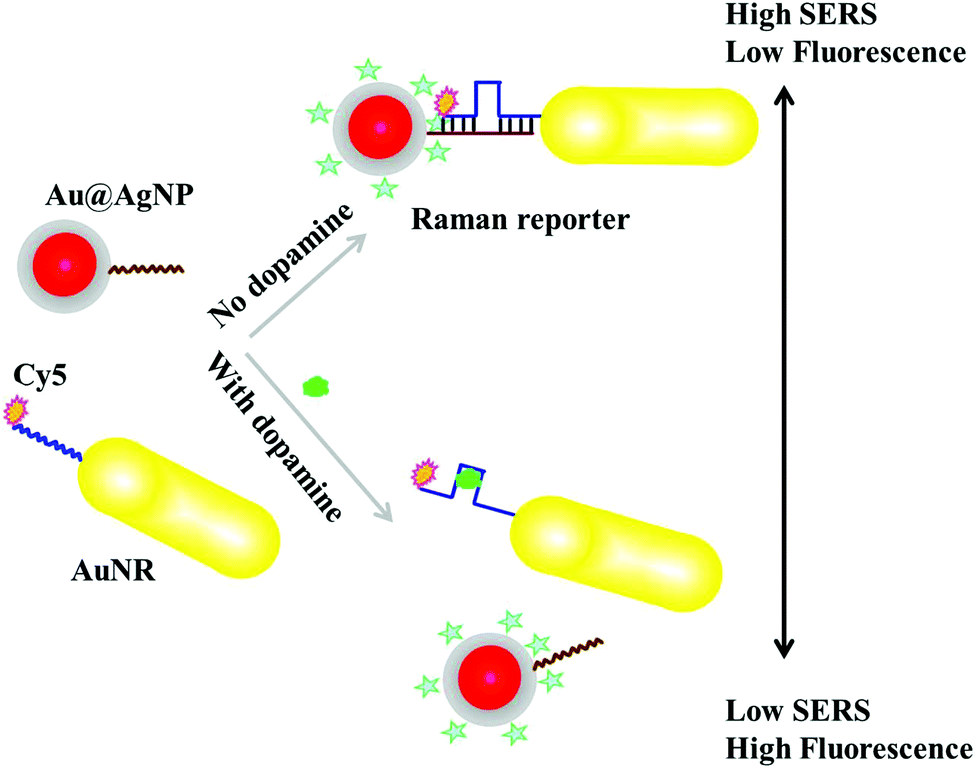 | ||
| Scheme 1 Scheme for DA detection with dual signals based on Au@AgNP–AuNR heterodimers. | ||
To assemble Au@AgNP–AuNR heterodimers, AuNRs (42 ± 2.5 nm, 12 ± 1.3 nm) and Au@AgNPs (12.3 ± 2.2 nm) were modified with DA aptamers and their partly-complementary DNA sequences, respectively, in a molar ratio of 1![[thin space (1/6-em)]](https://www.rsc.org/images/entities/char_2009.gif) :1 (Scheme 1 and Fig. 1). Due to the low density of CTAB, the DA aptamers preferentially bound to the end site of the AuNRs. In the absence of DA analytes, the AuNRs–DNA and Au@AgNPs–DNA assembled to the heterodimers, due to the hybridization of aptamers and DNA sequences. The strong electromagnetic enhancement in the hotspots of the assembled heterodimers resulted in high SERS activity. To obtain a dual signal response, Cy5 was functionalized on the DA aptamer. Therefore, the fluorescence intensity was significantly quenched when the heterodimers were formed. In the presence of target analytes, more DA was recognized by the aptamers and bonded with each other, leading to more monodispersed AuNRs–DNA and Au@AgNPs–DNA, which resulted in low SERS intensity and high fluorescence signals. The counterpropagating-response of the fluorescence and SERS activity of the assemblies to the DA analyte was specifically designed to ensure reliable and precise quantification of DA in the measurement range (Scheme 1).
:1 (Scheme 1 and Fig. 1). Due to the low density of CTAB, the DA aptamers preferentially bound to the end site of the AuNRs. In the absence of DA analytes, the AuNRs–DNA and Au@AgNPs–DNA assembled to the heterodimers, due to the hybridization of aptamers and DNA sequences. The strong electromagnetic enhancement in the hotspots of the assembled heterodimers resulted in high SERS activity. To obtain a dual signal response, Cy5 was functionalized on the DA aptamer. Therefore, the fluorescence intensity was significantly quenched when the heterodimers were formed. In the presence of target analytes, more DA was recognized by the aptamers and bonded with each other, leading to more monodispersed AuNRs–DNA and Au@AgNPs–DNA, which resulted in low SERS intensity and high fluorescence signals. The counterpropagating-response of the fluorescence and SERS activity of the assemblies to the DA analyte was specifically designed to ensure reliable and precise quantification of DA in the measurement range (Scheme 1).
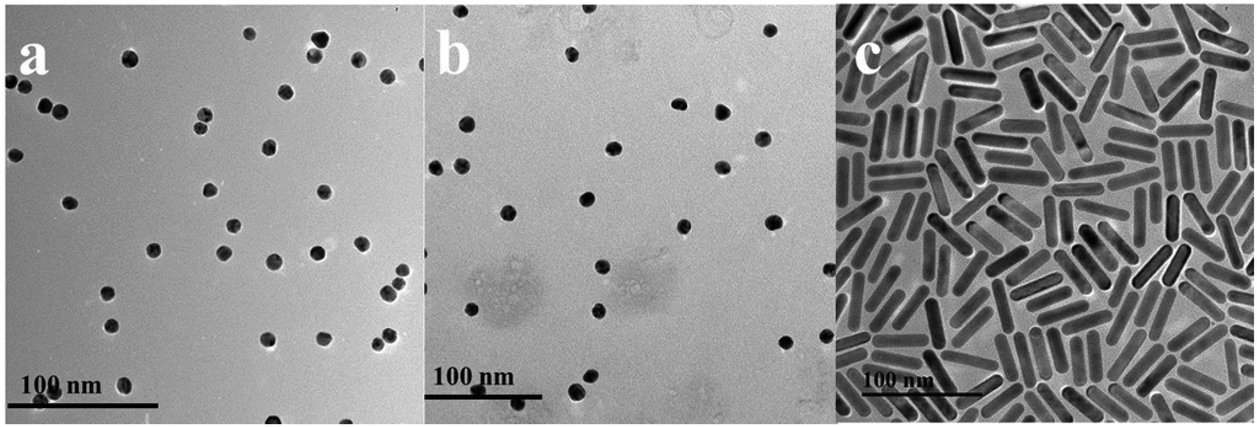 | ||
| Fig. 1 Representative TEM images of (a) AuNPs, (b) Au@AgNPs, and (c) AuNRs. | ||
As shown in the TEM images (Fig. 2a), the heterodimers were successfully assembled. From the results of the DLS measurements shown in Fig. 3, the hydrodynamic sizes of the assembled heterodimers increased compared with those before the assembly, and these sizes corresponded with the TEM measurements, which further confirmed successful dimer assembly.28 Moreover, there were no large aggregations or spontaneous disassembly in the DLS spectra even for more than 10 h, which demonstrated the good stability and dispersibility of the nano-assemblies (Fig. S1†).29,39
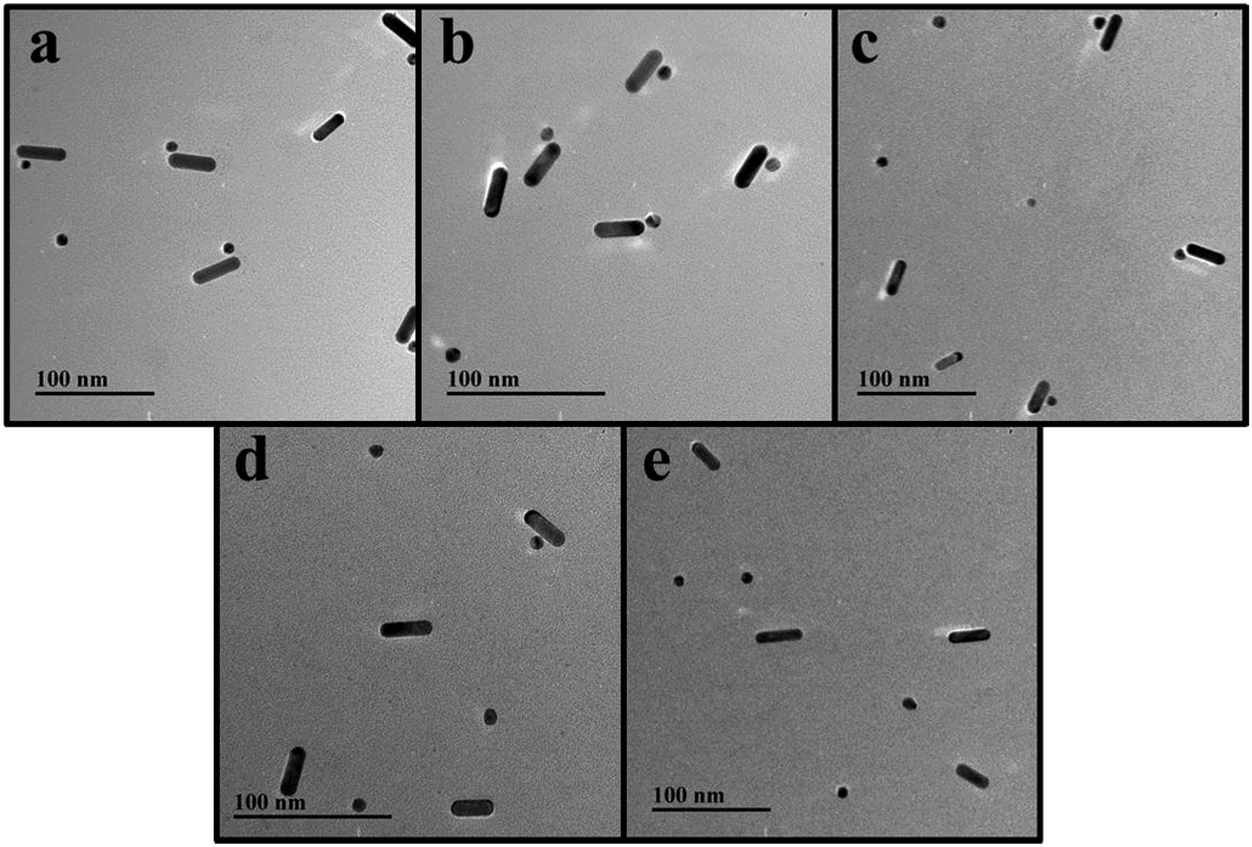 | ||
| Fig. 2 Representative TEM images of Au@AgNP–AuNR heterodimers with different concentrations of DA: (a) 0 fM, (b) 0.1 fM, (c) 0.5 fM, (d) 1 fM, (e) 10 fM. | ||
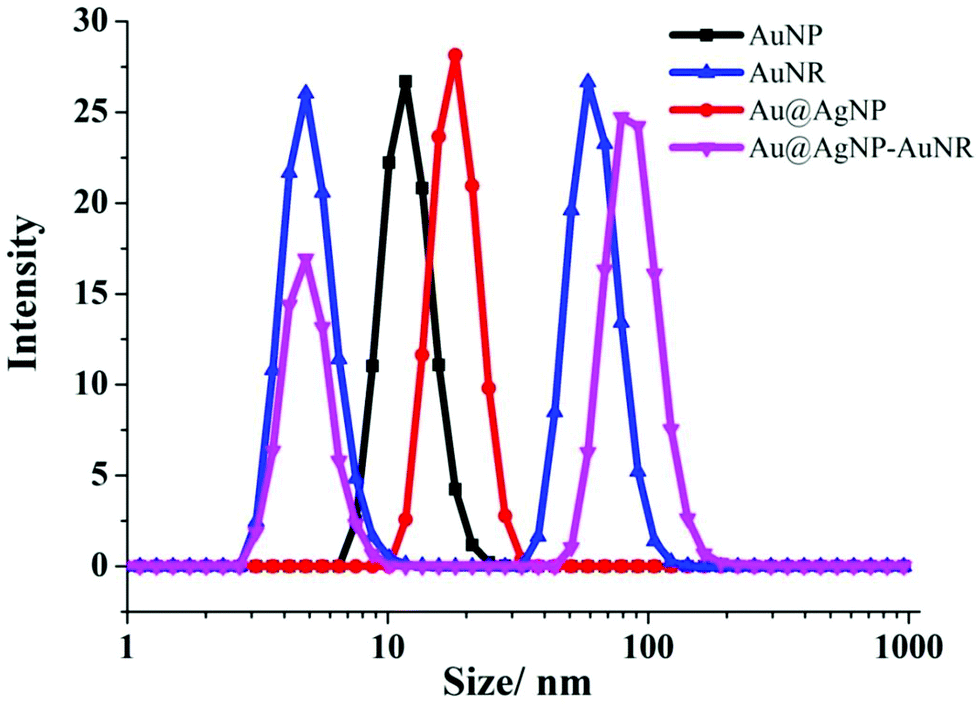 | ||
| Fig. 3 Hydrodynamic size of Au@AgNP–AuNR assemblies and their controls. | ||
DA detection by fluorescence signals
Following formation of the heterodimers, the nano-assemblies were then obtained and optically characterized. Firstly, their fluorescence properties were measured. The excitation of Cy5 was set at 650 nm. As shown in Fig. 4a, the emission was at approximately 679 nm. However, after the assemblies were formed, the intensity decreased from 19730 to 5634, and the quenching efficiency was about 71.45%. The notable quenching effect mainly resulted from the strong hotspots of the plasmonic assemblies.38,40 It is worth mentioning that the fluorescence intensity of AuNR–DNA 1–Cy5 was about 19550 at 679 nm. While the other Au@AgNP–AuNR control assemblies showed almost no fluorescence intensity (Fig. S2†).
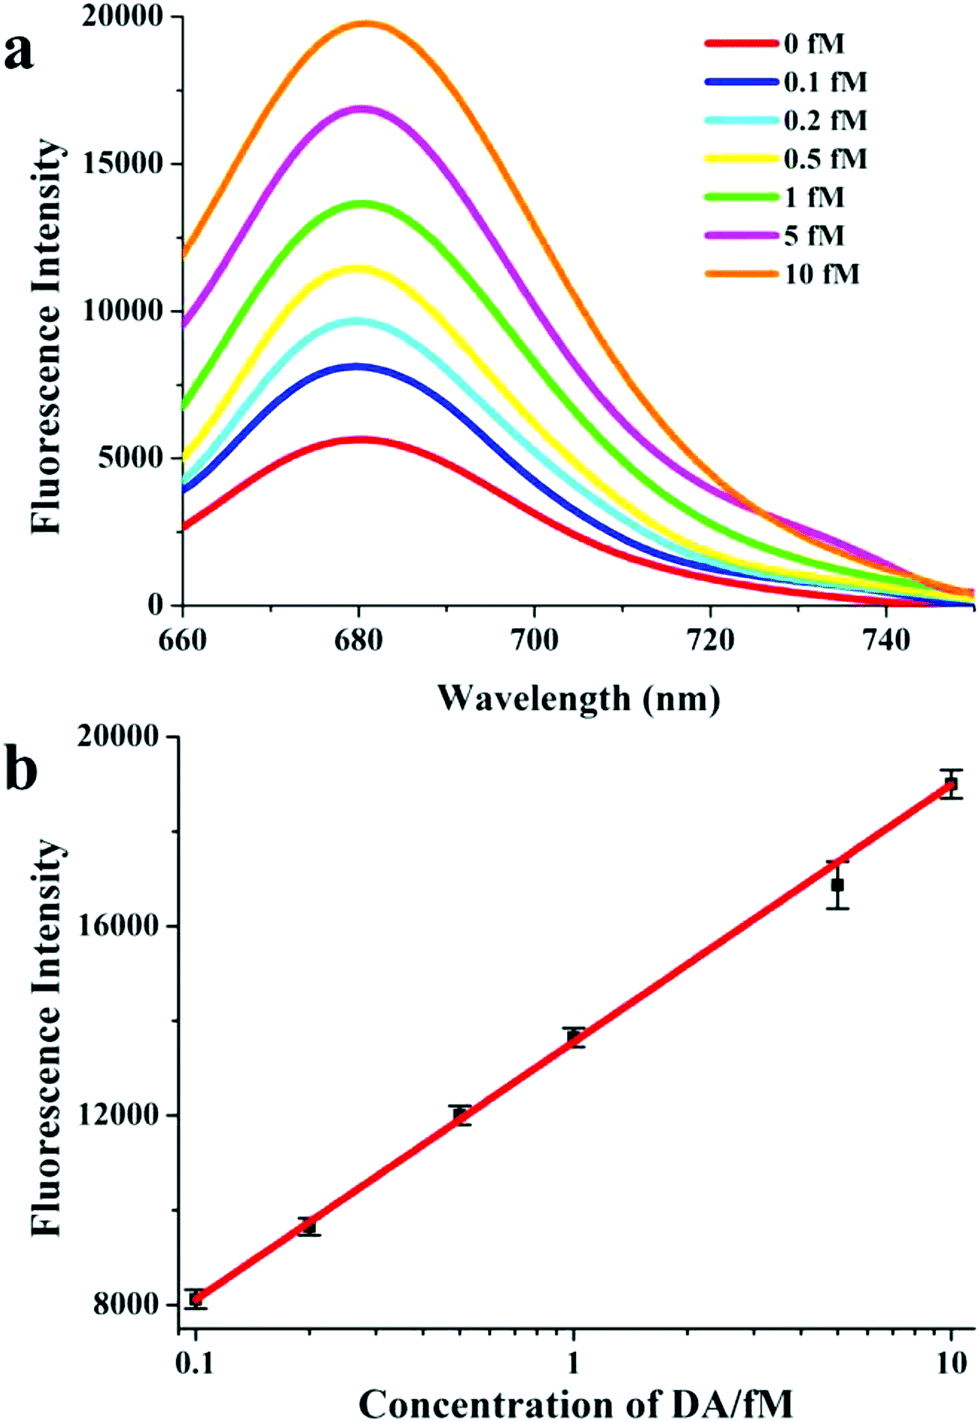 | ||
| Fig. 4 DA detection by fluorescence signal with Au@AgNP–AuNR heterodimers. (a) Fluorescence spectra for different concentrations of DA. (b) The corresponding fluorescence standard curve for DA detection. | ||
When DA was present, fewer dimers were formed, and more Cy5 dye disappeared from the hotspots. Thus, the fluorescence signal gradually recovered. The fluorescence intensity linearly increased in the presence of a larger number of DA analytes, which was consistent with the TEM images (Fig. 2). For the quantification of DA by the fluorescence signal, a series of DA solutions at final concentrations of 0 fM, 0.1 fM, 0.2 fM, 0.5 fM, 1 fM, 5 fM, and 10 fM was added to the dimers, respectively. Following incubation, their fluorescence spectra were measured (Fig. 4a). As shown in Fig. 4b, the corresponding standard curve was established using the logarithmic concentration of DA analytes as the x-axis and the fluorescence intensity as the y-axis. The LOD of DA was determined by the noise level and linear fitting curve. It was calculated as LOD = 3SD/S, where SD is the standard deviation of the noise level based on five measurements and S is the slope of the linear fitting curve. Therefore, the LOD was calculated to be 0.04 fM, which was more than 10 times lower than that reported in previous methods.41 The linear range was from 0.1 fM to 10 fM, with an excellent correlation coefficient of 0.995.
DA detection by SERS signals
In addition to fluorescence measurement, plasmonic assemblies were also used in the analysis of SERS activity. In this study, we used 4-ATP at a final concentration of 10 μM as the Raman reporter.34 The excitation was selected at 633 nm, and the acquisition time was 10 s. From the SERS spectra in Fig. 5a, the heterodimer assemblies had high SERS activity ranging from 400 to 1600 cm−1, corresponding to that of 4-ATP.34 The highest SERS intensity was 2257 at 1145 cm−1, which was selected as the signal peak for the subsequent study. And the monomers and other heterodimer controls present significantly weaker signals than the assembled dimers (Fig. S3†). The prominent Raman enhancement was attributed to the strong electric field of the hotspots, which was consistent with the quenching of the fluorescence signal shown above (Fig. 4).34,38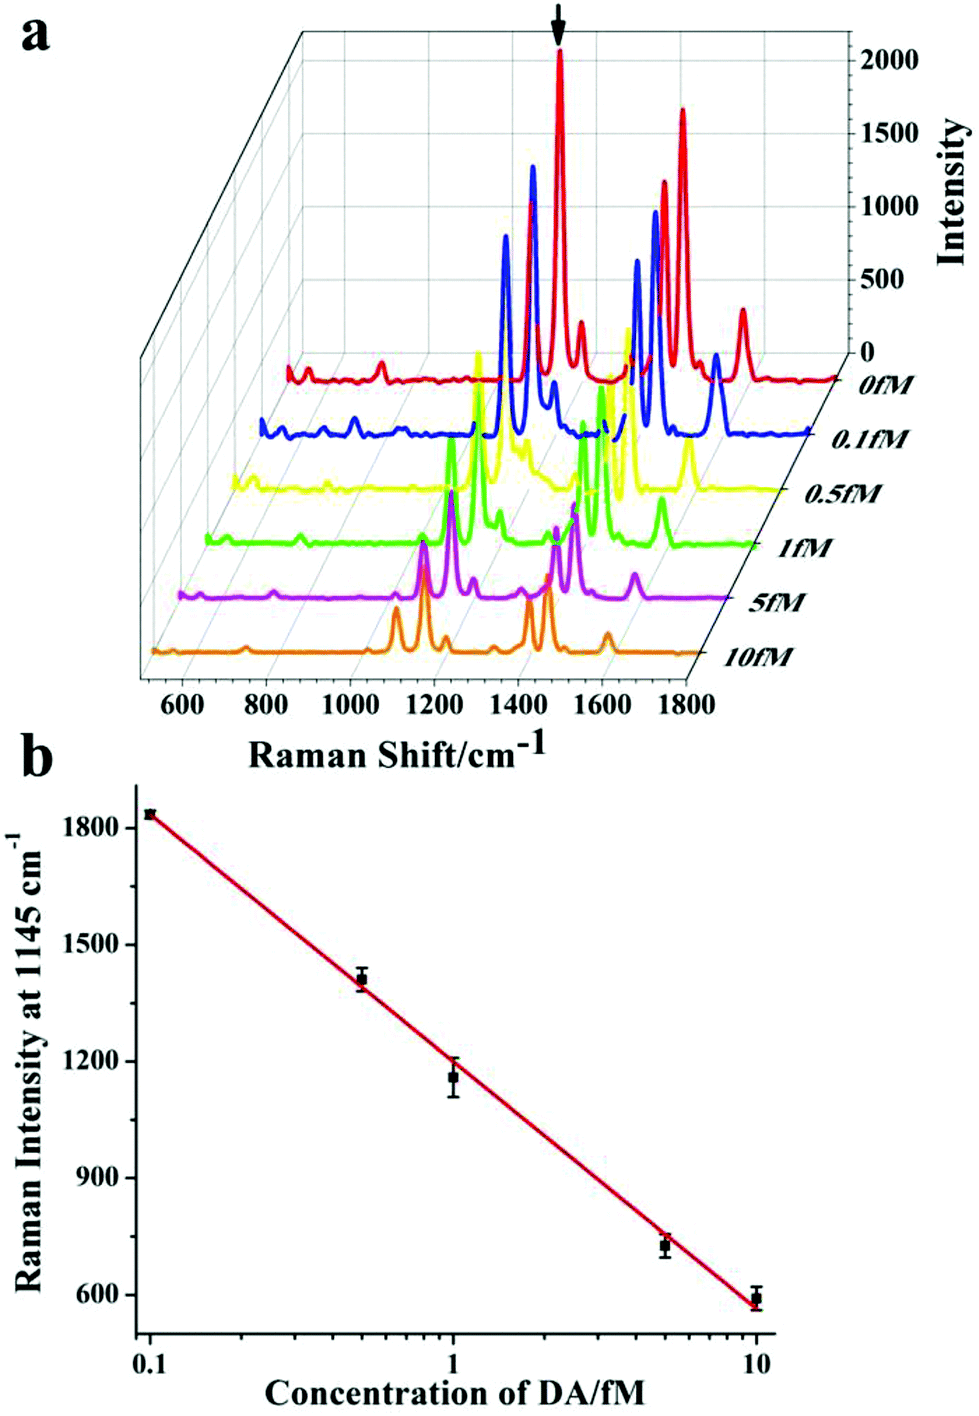 | ||
| Fig. 5 DA detection by SERS signal with Au@AgNP–AuNR heterodimers. (a) SERS spectra for different concentrations of DA. (b) The corresponding SERS standard curve for DA detection. | ||
In the presence of DA, the SERS signal significantly decreased as the concentration of DA increased. It can be clearly seen in Fig. 5a that the SERS intensity was markedly reduced to 1835 following the addition of 0.1 fM of DA analytes, which indicated the ultrasensitive SERS response to low concentrations of analyte compared to that using the fluorescence method. When the concentration of DA was 10 fM, the SERS amplitude was 590. A logarithmic concentration of the linear calibration curve was plotted. As shown in Fig. 5b, the corresponding detection range was 0.1–10 fM. The obtained LOD was 0.02 fM, which was two times lower than that of the fluorescence method, and more than 20 times lower than that of other reported methods.41 The excellent sensitivity can probably be attributed to high electric field enhancement and good signal-to-noise ratio.29,36,42 More importantly, the SERS signal was a negative response, while the fluorescence signal was a positive response. The opposite response of these two modes was beneficial for reliable DA detection.
Selectivity of the developed DA sensor
In addition to determining the sensitivity of the developed sensor, we also investigated its specificity. Six interfering substances, a blank control and two mixed samples were tested under the same conditions.19 Even at high concentrations, the fluorescence signal showed no observable increase with these interfering chemicals (Fig. 6). Similarly, there was no obvious reduction in SERS activity (Fig. 7). These results demonstrated that the developed sensor had high selectivity for the detection of DA.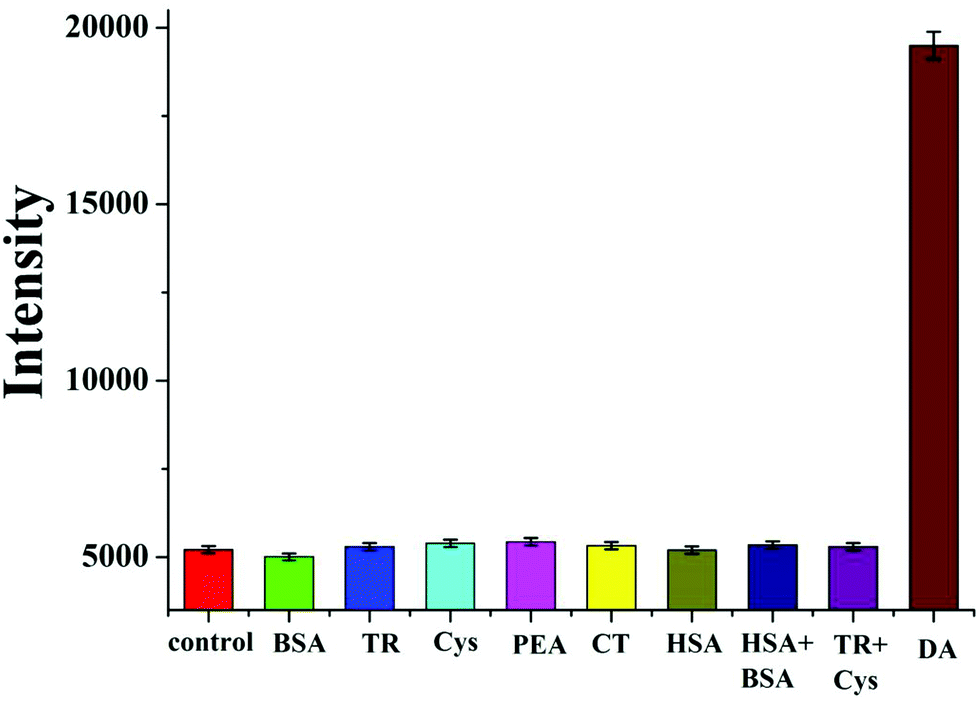 | ||
| Fig. 6 Selectivity of the developed DA biosensor by fluorescence signal. DA concentration is 10 fM. BSA and HSA concentrations are 1 mM (BSA, bovine serum albumin; HSA, human serum albumin, HSA + BSA). The control is the blank sample without any analytes. The other substances are 1 nM (TR, tyrosine; Cys, L-cysteine; PEA, phenethylamine; CT, catechol, TR + Cys). | ||
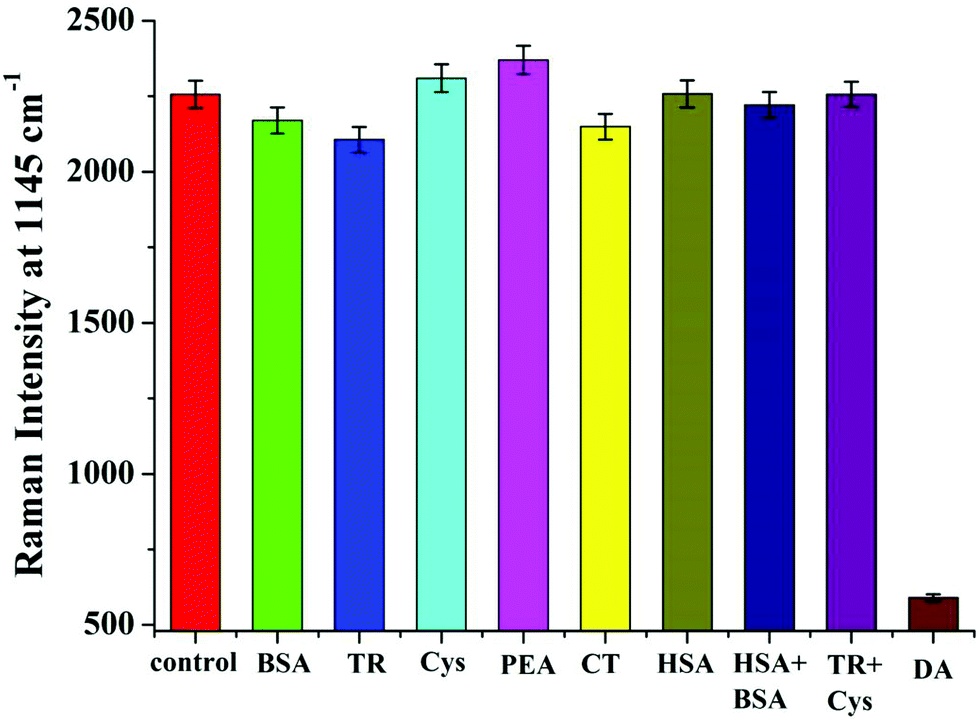 | ||
| Fig. 7 Selectivity of the developed DA biosensor by SERS signal. DA concentration is 10 fM. BSA and HSA concentrations are 1 mM (BSA, bovine serum albumin; HSA, human serum albumin, HSA + BSA). The control is the blank sample without any analytes. The other substances are 1 nM (TR, tyrosine; Cys, L-cysteine; PEA, phenethylamine; CT, catechol, TR + Cys). | ||
DA determination in real serum samples
Following the demonstration of its excellent sensitivity and good specificity, the developed method was applied for DA analysis in real samples. The experiment was approved by the local Ethics Committee of the Second Hospital. The serum samples were from healthy human donors at the Second Hospital in Wuxi. Before measurements using the proposed methods above, an additional serial dilution process (dilution in 0.01 M PB) was needed. As shown in Tables 1 and 2, the developed system presented good recoveries (90%–106%) and acceptable R.S.D. values (<6%). Moreover, we also tested other fluid conditions for the DA analysis. The results in Fig. S4 and S5† demonstrate excellent detection of DA analytes by the developed biosensor, which is promising for clinical applications.| Serum samplea | Added (aM) | Measured (aM) | Recovery (%) | R.S.D.b (n = 5) |
|---|---|---|---|---|
| a Original serum samples were serially diluted with 0.01 M PB buffer (pH 7.0) to a dilution factor of 7, thoroughly mixed and then stood for at least 2 h before the determination. b R.S.D. was calculated based on five parallel experiments for each sample. | ||||
| 1 | 200 | 180 ± 10 | 90 ± 5.2 | 5.8 |
| 2 | 1000 | 1060 ± 50 | 106 ± 3.7 | 3.5 |
| 3 | 5000 | 4820 ± 200 | 96 ± 4.1 | 4.3 |
| Serum samplea | Added (aM) | Measured (aM) | Recovery (%) | R.S.D.b (n = 5) |
|---|---|---|---|---|
| a Original serum samples were serially diluted with 0.01 M PB buffer (pH 7.0) to a dilution factor of 7, thoroughly mixed and then stood for at least 2 h before the determination. b R.S.D. was calculated based on five parallel experiments for each sample. | ||||
| 1 | 200 | 210 ± 10 | 105 ± 4.8 | 4.6 |
| 2 | 1000 | 980 ± 40 | 98 ± 5.4 | 5.5 |
| 3 | 5000 | 4710 ± 150 | 94 ± 4.0 | 4.3 |
Conclusions
In summary, for the first time, fluorescence and SERS active Au@AgNP–AuNR heterodimers were developed in this study for the dual mode sub-femtomolar detection of DA. The counterpropagating-response of the fluorescence and SERS activity of the assemblies system to the DA analyte, established a novel strategy for reliable DA quantification. More importantly, the developed method can easily be extended to the analysis of other cancer biomarkers, and could provide a new platform for the early diagnosis and therapy of cancers and other diseases, which will play an important role in precise medication and in clinical science in the future.Acknowledgements
This work is financially supported by the National Natural Science Foundation of China (21631005, 21673104, 21522102, 21503095, 21471068, 31400848, 21471128, 21371081 and 21301073).Notes and references
- N. Eshel, J. Tian, M. Bukwich and N. Uchida, Nat. Neurosci., 2016, 19, 479–486 CrossRef CAS PubMed.
- P. M. Rappold, M. Cui, J. C. Grima, R. Z. Fan, K. L. de Mesy-Bentley, L. Chen, X. Zhuang, W. J. Bowers and K. Tieu, Nat. Commun., 2014, 5, 5244 CrossRef CAS PubMed.
- L. Li, C.-W. Zhang, G. Y. J. Chen, B. Zhu, C. Chai, Q.-H. Xu, E.-K. Tan, Q. Zhu, K.-L. Lim and S. Q. Yao, Nat. Commun., 2014, 5, 3276 Search PubMed.
- H. Y. Yue, S. Huang, J. Chang, C. Heo, F. Yao, S. Adhikari, F. Gunes, L. C. Liu, T. H. Lee, E. S. Oh, B. Li, J. J. Zhang, T. Q. Huy, N. V. Luan and Y. H. Lee, ACS Nano, 2014, 8, 1639–1646 CrossRef CAS PubMed.
- S. Kruss, M. P. Landry, E. Vander Ende, B. M. A. Lima, N. F. Reuel, J. Zhang, J. Nelson, B. Mu, A. Hilmer and M. Strano, J. Am. Chem. Soc., 2014, 136, 713–724 CrossRef CAS PubMed.
- L. Schmidt, E. K. Braun, T. D. Wager and D. Shohamy, Nat. Neurosci., 2014, 17, 1793–1797 CrossRef CAS PubMed.
- P. Calabresi and M. Di Filippo, Nat. Neurosci., 2015, 18, 1196–1198 CrossRef CAS PubMed.
- M. Hefnawy, A. Alanazi, M. Abounassif, M. Mohammed, I. Al-Swaidan, S. Attia, G. Mostafa, H. El-Subbagh and J. Lehmann, Chromatographia, 2015, 78, 655–661 CrossRef CAS.
- J. Kim, H. Park, J. Ryu, O. Jeon and I. R. Paeng, J. Immunoassay Immunochem., 2009, 31, 33–44 CrossRef PubMed.
- W. Yang, B. Liu, T. Fang, W.-A. Jennifer, L. Christophe, Z. Li, X. Zhang and X. Jiang, Nanoscale, 2016, 8, 18197–18203 RSC.
- C. Yang, C. B. Jacobs, M. D. Nguyen, M. Ganesana, A. G. Zestos, I. N. Ivanov, A. A. Puretzky, C. M. Rouleau, D. B. Geohegan and B. J. Venton, Anal. Chem., 2016, 88, 645–652 CrossRef CAS PubMed.
- X. Yan, Y. Gu, C. Li, L. Tang, B. Zheng, Y. Li, Z. Zhang and M. Yang, Biosens. Bioelectron., 2016, 77, 1032–1038 CrossRef CAS PubMed.
- J. Liu, X. Leng, Y. Xiao, C. Hu and L. Fu, Nanoscale, 2015, 7, 11922–11927 RSC.
- Y. Zheng, Y. Wang and X. Yang, Sens. Actuators, B, 2011, 156, 95–99 CrossRef CAS.
- Y. Tao, Y. Lin, J. Ren and X. Qu, Biosens. Bioelectron., 2013, 42, 41–46 CrossRef CAS PubMed.
- A. Kumar, S. Kim and J.-M. Nam, J. Am. Chem. Soc., 2016, 138, 14509–14525 CrossRef CAS PubMed.
- T. O. Ahmadov, P. Joshi, J. Zhang, K. Nahan, J. A. Caruso and P. Zhang, Chem. Commun., 2015, 51, 11425–11428 RSC.
- P. Wang, M. Xia, O. Liang, K. Sun, A. F. Cipriano, T. Schroeder, H. Liu and Y.-H. Xie, Anal. Chem., 2015, 87, 10255–10261 CrossRef CAS PubMed.
- L. Tang, S. Li, F. Han, L. Liu, L. Xu, W. Ma, H. Kuang, A. Li, L. Wang and C. Xu, Biosens. Bioelectron., 2015, 71, 7–12 CrossRef CAS PubMed.
- H. Huang, S. Shi, X. Gao, R. Gao, Y. Zhu, X. Wu, R. Zang and T. Yao, Biosens. Bioelectron., 2016, 79, 198–204 CrossRef CAS PubMed.
- H. Li, M. Yang, J. Liu, Y. Zhang, Y. Yang, H. Huang, Y. Liu and Z. Kang, Nanoscale, 2015, 7, 12068–12075 RSC.
- A. J. Stewart, J. Hendry and L. Dennany, Anal. Chem., 2015, 87, 11847–11853 CrossRef CAS PubMed.
- J. Kirsch, C. Siltanen, Q. Zhou, A. Revzin and A. Simonian, Chem. Soc. Rev., 2013, 42, 8733–8768 RSC.
- H. Liang, X.-B. Zhang, Y. Lv, L. Gong, R. Wang, X. Zhu, R. Yang and W. Tan, Acc. Chem. Res., 2014, 47, 1891–1901 CrossRef CAS PubMed.
- A. Credi, Chem. Soc. Rev., 2014, 43, 4003–4004 RSC.
- L. Xu, W. Ma, L. Wang, C. Xu, H. Kuang and N. A. Kotov, Chem. Soc. Rev., 2013, 42, 3114–3126 RSC.
- G. Zabow, S. J. Dodd and A. P. Koretsky, Nature, 2015, 520, 73–77 CrossRef CAS PubMed.
- W. Ma, H. Kuang, L. Xu, L. Ding, C. Xu, L. Wang and N. A. Kotov, Nat. Commun., 2013, 4, 2689–2696 Search PubMed.
- X. Wu, L. Xu, L. Liu, W. Ma, H. Yin, H. Kuang, L. Wang, C. Xu and N. A. Kotov, J. Am. Chem. Soc., 2013, 135, 18629–18636 CrossRef CAS PubMed.
- I. Vaya, V. Lhiaubet-Vallet, M. C. Jimenez and M. A. Miranda, Chem. Soc. Rev., 2014, 43, 4102–4122 RSC.
- Z.-G. Wang and B. Ding, Acc. Chem. Res., 2014, 47, 1654–1662 CrossRef CAS PubMed.
- S. Li, L. Xu, W. Ma, X. Wu, M. Sun, H. Kuang, L. Wang, N. A. Kotov and C. Xu, J. Am. Chem. Soc., 2016, 138, 306–312 CrossRef CAS PubMed.
- K. L. Wustholz, A.-I. Henry, J. M. McMahon, R. G. Freeman, N. Valley, M. E. Piotti, M. J. Natan, G. C. Schatz and R. P. V. Duyne, J. Am. Chem. Soc., 2010, 132, 10903–10910 CrossRef CAS PubMed.
- L. Xu, W. Yan, W. Ma, H. Kuang, X. Wu, L. Liu, Y. Zhao, L. Wang and C. Xu, Adv. Mater., 2015, 27, 1706–1711 CrossRef CAS PubMed.
- X. Shen, A. Asenjo-Garcia, Q. Liu, Q. Jiang, F. J. García de Abajo, N. Liu and B. Ding, Nano Lett., 2013, 13, 2128–2133 CrossRef CAS PubMed.
- A. Kuzyk, R. Schreiber, Z. Fan, G. Pardatscher, E.-M. Roller, A. Högele, F. C. Simmel, A. O. Govorov and T. Liedl, Nature, 2012, 483, 311–314 CrossRef CAS PubMed.
- M. Sun, L. Xu, W. Ma, X. Wu, H. Kuang, L. Wang and C. Xu, Adv. Mater., 2016, 28, 898–904 CrossRef CAS PubMed.
- X. Wu, L. Xu, W. Ma, L. Liu, H. Kuang, N. A. Kotov and C. Xu, Adv. Mater., 2016, 28, 5907–5915 CrossRef CAS PubMed.
- X. Wu, L. Xu, W. Ma, L. Liu, H. Kuang, W. Yan, L. Wang and C. Xu, Adv. Funct. Mater., 2015, 25, 850–854 CrossRef CAS.
- A. B. Chinen, C. M. Guan, J. R. Ferrer, S. N. Barnaby, T. J. Merkel and C. A. Mirkin, Chem. Rev., 2015, 115, 10530–10574 CrossRef CAS PubMed.
- Y. Li, J. Liu, M. Liu, F. Yu, L. Zhang, H. Tang, B.-C. Ye and L. Lai, Electrochem. Commun., 2016, 64, 42–45 CrossRef CAS.
- C. Hao, L. Xu, W. Ma, L. Wang, H. Kuang and C. Xu, Small, 2014, 10, 1805–1812 CrossRef CAS PubMed.
Footnote |
| † Electronic supplementary information (ESI) available. See DOI: 10.1039/c6nr08264e |
| This journal is © The Royal Society of Chemistry 2017 |