
Mechanism of α-synuclein translocation through a VDAC nanopore revealed by energy landscape modeling of escape time distributions
David P.
Hoogerheide
*a,
Philip A.
Gurnev
b,
Tatiana K.
Rostovtseva
b and
Sergey M.
Bezrukov
*b
aCenter for Neutron Research, National Institute of Standards and Technology, Gaithersburg, MD 20899, USA. E-mail: david.hoogerheide@nist.gov
bSection on Molecular Transport, Eunice Kennedy Shriver National Institute of Child Health and Human Development, National Institutes of Health, Bethesda, MD 20892, USA. E-mail: bezrukos@mail.nih.gov
First published on 30th November 2016
Abstract
We probe the energy landscape governing the passage of α-synuclein, a natural “diblock copolymer”-like polypeptide, through a nanoscale pore. α-Synuclein is an intrinsically disordered neuronal protein associated with Parkinson's pathology. The motion of this electrically heterogeneous polymer in the β-barrel voltage-dependent anion channel (VDAC) of the mitochondrial outer membrane strongly depends on the properties of both the charged and uncharged regions of the α-synuclein polymer. We model this motion in two ways. First, a simple Markov model accounts for the transitions of the channel between the states of different occupancy by α-synuclein. Second, the detailed energy landscape of this motion can be accounted for using a drift-diffusion framework that incorporates the α-synuclein binding energy and the free energy cost of its confinement in the VDAC pore. The models directly predict the probability of α-synuclein translocation across the mitochondrial outer membrane, with immediate implications for the physiological role of α-synuclein in regulation of mitochondrial bioenergetics. Time-resolved measurements of the electrical properties of VDAC occupied by α-synuclein reveal distinct effects of the motion of the junction separating the differently charged regions of the polymer.
Introduction
The motion of biological macromolecules in nanometer-scale pores perforating thin membranes has received considerable recent attention, particularly in the context of DNA sequencing technologies.1–3 In most of these studies, a relatively large transmembrane potential drives uniformly anionic double- or single-stranded DNA molecules through artificial or biological pores which are in many cases engineered to enhance selectivity to individual DNA bases.4–6 The DNA molecules are detected and characterized based on their modulation of the pore conductance as they pass, or “translocate”, through the pore. The dynamics of the DNA–nanopore interaction have generally been studied in the context of either the capture7–9 or translocation10–14 processes in isolation. The free energy of the capture, or “insertion”, process has proven particularly difficult to determine using conventional techniques with uniformly charged polymers,9,15 primarily because the reverse process, “retraction” of the polymer, is observed only at very low transmembrane potentials16,17 or when using an independent counteracting force.18,19In this work, we use a naturally occurring polypeptide with a “diblock copolymer”-like architecture, the intrinsically disordered neuronal protein α-synuclein, to map the free energy landscape of the capture and escape processes involving VDAC, a β-barrel passive transport channel of the mitochondrial outer membrane.20,21 α-Synuclein, believed to be involved in Parkinson disease etiology,22,23 is 140 amino acids long (56 nm, based on a 0.4 nm contour length per amino acid24), with a 45-residue C-terminal tail (CTT) carrying 15 negative charges on the last 37 amino acids (∼1e− nm−1) and the nearly net neutral (∼−0.08e− nm−1) 95 N-terminal residues forming a region that can adopt an α-helical structure on membranes containing anionic lipids.25,26 The two distinct regions of differing linear charge densities (Fig. 1a), as well as the well-known membrane-binding properties of the uncharged N-terminal region, allow us to determine important elements of the free energy landscape governing the polymer–pore interaction. In particular, we evaluate the binding energy of this neurological disease-related protein to lipid membranes, as well as the free energy required to capture a molecule into an unoccupied open pore or into a pore already containing an α-synuclein molecule.
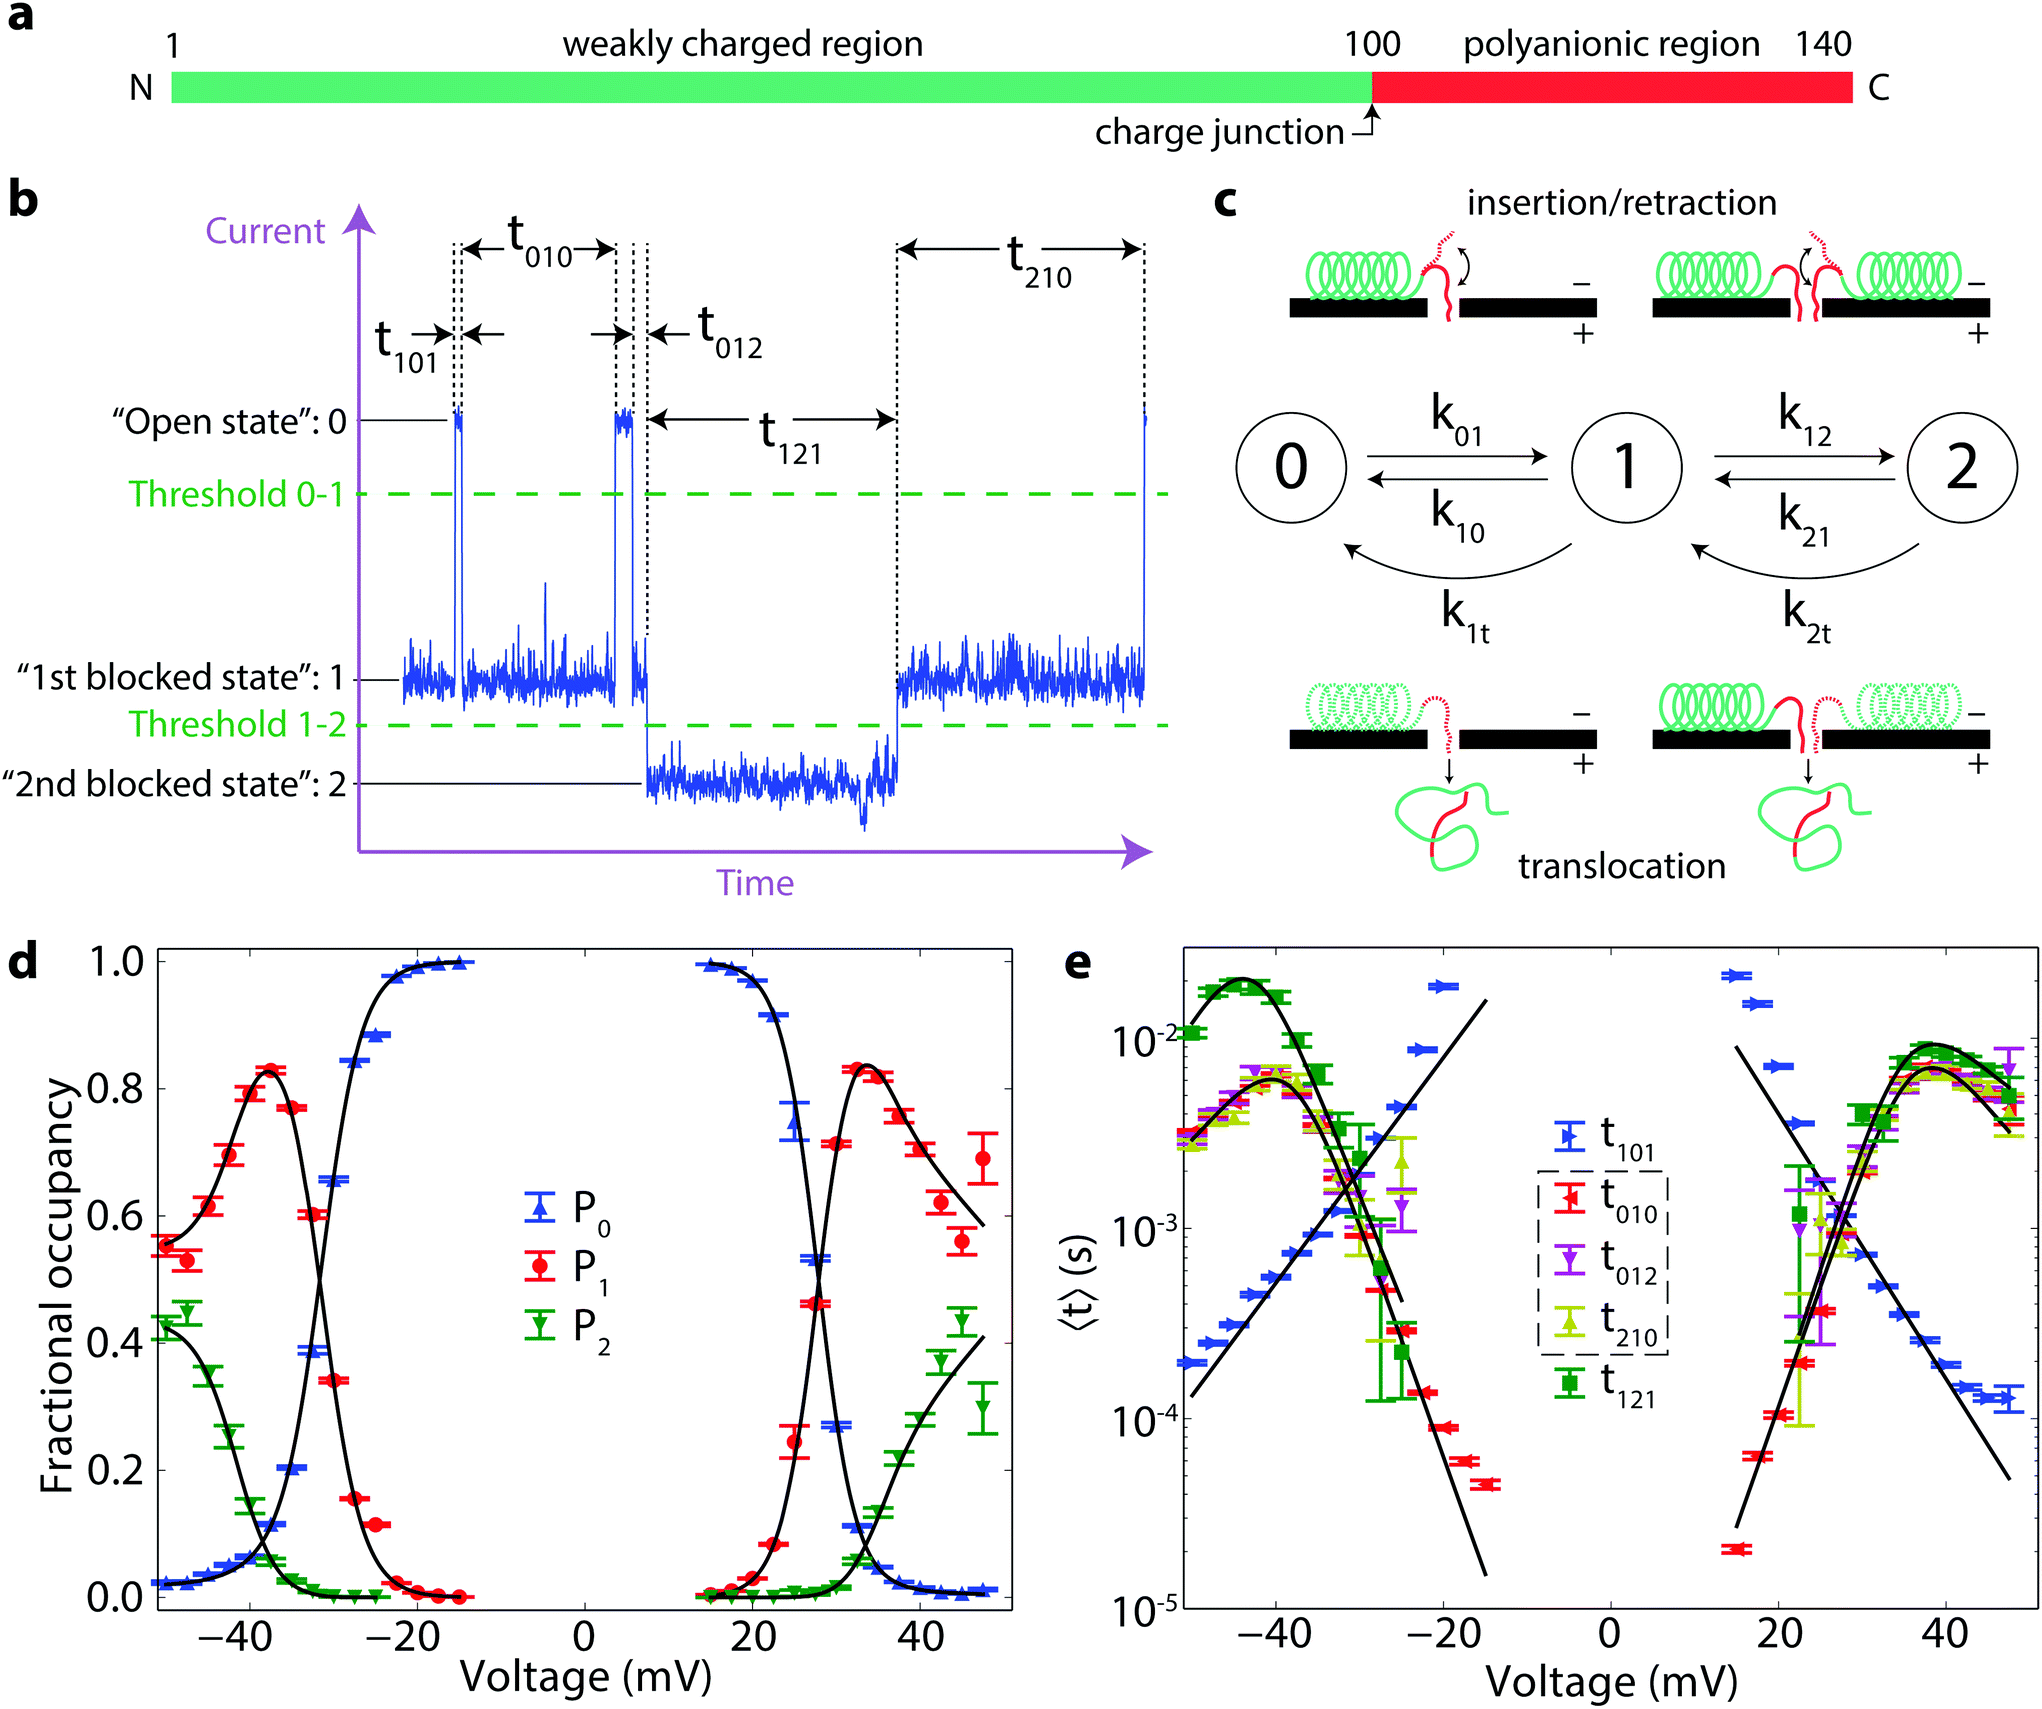 | ||
| Fig. 1 Markov model analysis of the α-synuclein–VDAC interaction. (a) Schematic of α-synuclein showing its diblock architecture. (b) Anatomy of blockage events. The states of different occupancy by α-synuclein—open state, first blocked state, and second blocked states—are denoted “0”, “1”, and “2”, respectively. The time record is divided by the transitions between states, shown as vertical dotted lines. Transitions are identified by a threshold crossing algorithm; thresholds are shown as horizontal dotted lines. The duration of each state is denoted as tisf, where i is the state preceding the transition, s is the state itself, and f is the state following the subsequent transition. (c) Markov model of α-synuclein dynamics. Left-to-right arrows denote insertion processes; straight right-to-left arrows retraction processes; and curved right-to-left arrows translocation processes. The insertion–retraction is depicted in the top insets, while the translocation is depicted in the bottom insets. (d, e) Experimentally determined probabilities of each of the three Markov states (d) and average times spent in each state (e) as functions of the applied transmembrane potential. In these experiments, α-synuclein was present on both sides of the membrane, and voltage polarities are defined as described in the Methods. Solid lines represent fits to the Markov model introduced in the text; error bars represent one standard deviation from the mean, as determined by bootstrap analysis. | ||
The interaction of α-synuclein with VDAC is revealed experimentally as a series of transient reductions in the ionic current through a single VDAC channel reconstituted into a planar diphytanoylphosphatidylcholine bilayer lipid membrane.27 These transient events, or “blockages,” were previously observed to have two notable features. First, the reduction of the pore conductance in the presence of α-synuclein was shown to take on multiple values, particularly at relatively high (50 nM, M = mol l−1) α-synuclein concentrations. Because this behavior was less frequent at low (1 nM) α-synuclein concentrations, it was supposed to arise from the simultaneous interaction of multiple α-synuclein molecules with VDAC. Second, the dwell time of α-synuclein in the VDAC channel exhibits a biphasic dependence on transmembrane potential. This observation was thought to indicate the onset of α-synuclein translocation through VDAC at potentials >40 mV.27
In the following, we model the data from single VDAC channel recordings considering three distinct processes involved the α-synuclein–VDAC interaction: insertion of the α-synuclein CTT into the VDAC pore, followed by either retraction of the CTT from the pore or translocation of the entire α-synuclein molecule through the pore. We find that a simple Markov model accounts for the transitions of a single VDAC channel between the states of different occupancy by α-synuclein molecules, while the retraction and translocation dynamics for a single molecule can be understood in the context of a one-dimensional drift-diffusion model. The latter requires only a few free parameters that encapsulate the physics of the drift-diffusion process. It yields the probability of translocation vs. retraction as a function of transmembrane potential, with implications for understanding the physiological role of α-synuclein in regulation of mitochondrial bioenergetics. Finally, both the Markov and drift-diffusion models are supported by measurements of the selectivity of the channel when it is transiently occupied by differently charged regions of the α-synuclein molecule.
Results and discussion
In order to characterize the experimentally observed blockage events in a systematic manner, we employ the categorization scheme shown in Fig. 1b. Each state is numbered according to the deviation of its conductance from the open pore conductance interpreted as states of different occupancy by α-synuclein, from zero to double occupancy; thus, the open state is “0”, the first blocked state is “1”, and the second blocked state is “2”. Events are detected using a threshold crossing algorithm and are categorized by the initial state i, the intermediate state s, and the final state f. The lifetimes of each event type are denoted tisf. The fractional occupancy of each state s is denoted Ps (Fig. 1d). These probabilities, and average times in Fig. 1e, are shown for α-synuclein at 50 nM. Notably, the lifetimes of states 1 and 2 demonstrate the same biphasic behavior but are quantitatively different. By contrast, the lifetime of state 1 seems not to depend on the identity of the initial and final states, i.e. 〈t010〉 = 〈t012〉 = 〈t210〉, where the brackets denote average values. These equalities, which point to time reversibility and a lack of system memory, suggest that the α-synuclein/VDAC interaction can be treated as a three state Markov process28 for this range of transmembrane potentials.Markov state model
Here we construct a simple Markov model that incorporates the ideas that α-synuclein can translocate through the VDAC channel, and that multiple blocked states arise from the simultaneous interaction of multiple molecules with the channel. A schematic of this model is shown in Fig. 1c. The insertion and retraction rates are denoted by ksf, where s and f have the same meaning as before. The translocation rate is denoted by k1t for transitions from state 1 to state 0; to allow for the possibility that the presence of a second molecule affects the translocation rate, the translocation transition from state 2 to state 1 is denoted k2t. Each rate is a function of voltage. This model also assumes that if two molecules are interacting with the pore (i.e. the system is in state 2) and one of them translocates or retracts, the system is now in state 1, regardless of which molecule left the pore. The governing equation for the state of the system is | (1) |
 at all times. The average lifetimes can be shown to be 〈t101〉 = k01−1, 〈ti1f〉 = (k10 + k12 + k1t)−1, and 〈t121〉 = (k21 + k2t)−1, while the stationary probabilities of the states are given by
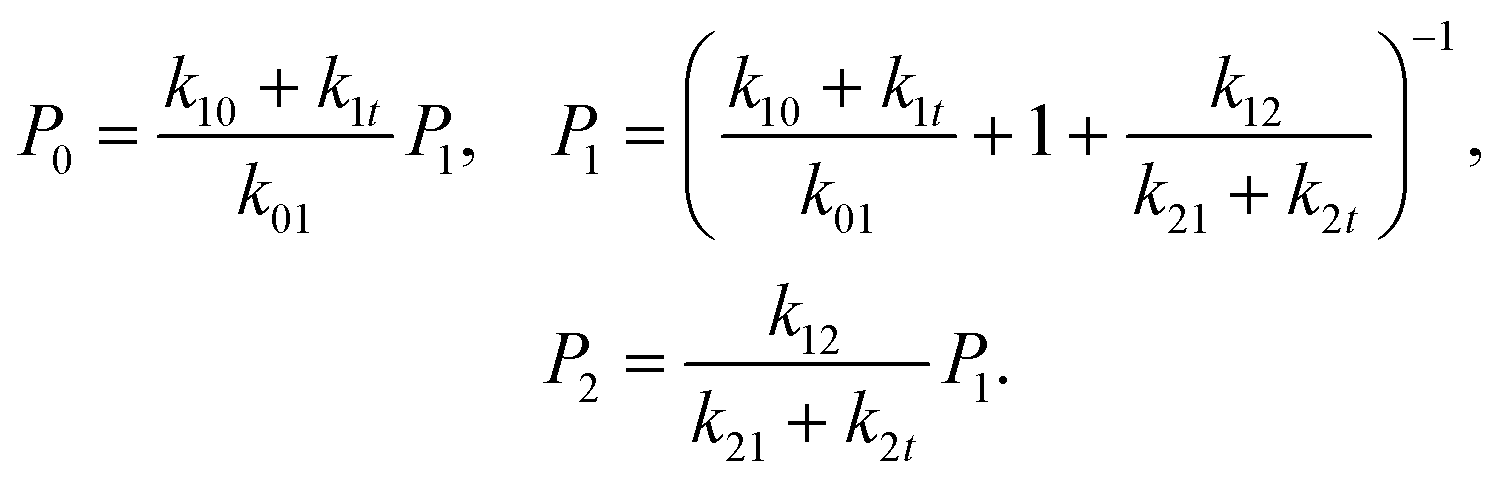 | (2) |
The voltage dependence of these rates can be approximated using transition rate theory.29 The presence of an energy barrier is plausible for all six rates: for the 0 → 1 and 1 → 2 transitions, there is an entropic cost to confine the peptide strand in the channel; for the 1 → 0 and 2 → 1 transitions at nonzero voltages, there is an electrostatic penalty to remove the strand from the channel; and for translocation, there is an energy penalty to unbind the α-synuclein molecule from the membrane. We therefore expect all of the rates to exhibit an exponential relationship with voltage of the form  , where k0sf is the zero-voltage rate, n is the effective number of charges that determines the change in transition state energy with absolute transmembrane potential |V|, e is the elementary charge, T is absolute temperature, and kB is the Boltzmann constant.
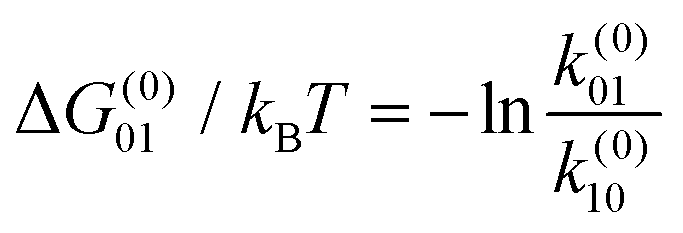
The result of optimizing this model to the experimental data is shown as the solid lines in Fig. 1d and e and the model parameter values are given in Table 1. Several quantities of interest can be immediately derived, including the energy ΔG(0)01 = −kBT![[thin space (1/6-em)]](https://www.rsc.org/images/entities/char_2009.gif) lnk(0)01/k(0)10 ≈ 13kBT required to insert the α-synuclein CTT into the channel. This energy includes steric, electrostatic, and entropic effects that influence CTT insertion. The partition coefficient between translocation and retraction also yields the difference in the energy barriers governing each of these processes, ΔΔG(0)0t = −kBTlnk(0)1t/k(0)10 ≈ 15kBT. This energy can be interpreted as the energy required to unbind the α-synuclein molecule from the membrane, which is needed for translocation to occur.
lnk(0)01/k(0)10 ≈ 13kBT required to insert the α-synuclein CTT into the channel. This energy includes steric, electrostatic, and entropic effects that influence CTT insertion. The partition coefficient between translocation and retraction also yields the difference in the energy barriers governing each of these processes, ΔΔG(0)0t = −kBTlnk(0)1t/k(0)10 ≈ 15kBT. This energy can be interpreted as the energy required to unbind the α-synuclein molecule from the membrane, which is needed for translocation to occur.
| Parameter | trans-Side capturedb | cis-Side capturedb |
|---|---|---|
| a Intervals shown are 95% confidence intervals. b See Methods for definitions. | ||
| Model parameters | ||
| log10(k(0)01 [s−1]) | 1.009+0.023−0.024 | 0.917+0.020−0.021 |
| log10(k(0)12 [s−1]) | −0.84+0.23−0.23 | −1.81+0.25−0.26 |
| log10(k(0)10 [s−1]) | 6.460+0.030−0.030 | 6.667+0.027−0.027 |
| log10(k(0)21 [s−1]) | 6.70+0.82−0.64 | 6.12+0.45−0.38 |
| log10(k(0)1t [s−1]) | −0.01+0.27−0.27 | 0.22+0.12−0.12 |
| log10(k(0)2t [s−1]) | 0.60+0.40−0.46 | −1.66+0.69−0.81 |
| n 01 | 4.142+0.050−0.049 | 3.526+0.040−0.037 |
| n 12 | 3.68+0.34−0.34 | 4.31+0.34−0.33 |
| n 10 | −7.520+0.067−0.068 | −7.35+0.06−0.05 |
| n 21 | −8.2+1.2−1.6 | −6.56+0.64−0.66 |
| n 1t | 2.86+0.39−0.39 | 2.64+0.16−0.15 |
| n 2t | 2.06+0.62−0.54 | 4.25+0.95−0.84 |
| Derived quantities | ||
|
12.552+0.064−0.062 | 13.239+0.050−0.046 |

|
17.3+1.8−1.3 | 18.3+1.2−1.0 |

|
14.90+0.59−0.59 | 14.84+0.26−0.25 |

|
14.1+1.3−1.0 | 18.0+1.3−1.2 |
At symmetric α-synuclein addition, the rate parameters for the capture of the first molecule do not depend strongly on voltage polarity and, therefore, on channel orientation in the membrane. In our experiments, positive voltages drive negatively charged CTTs of α-synuclein from the trans-side, and negative voltages drive them from the cis-side, of the VDAC pore (see Methods). At the α-synuclein concentration used in these experiments, both entrances of the channel capture α-synuclein molecules with similar efficiency. The rate parameters for the second molecule are likewise mostly independent of voltage polarity but do appear to be sensitive to the presence of the first molecule. In particular, ΔG(0)12 is 5kBT larger than ΔG(0)01, presumably due to the decreased entropy per molecule when two strands of α-synuclein CTTs are in the pore relative to a single strand.
This model provides compelling evidence that the interaction of α-synuclein with VDAC includes both a voltage-activated transient interaction, wherein the molecule is captured and then released to the same side, and a voltage-dependent translocation process. However, we do not expect a translocation process to be Markovian because it is fundamentally a drift-diffusion process. Indeed, in an experiment where the α-synuclein concentration was low (1 nM), suppressing the effect of multiple interactions, we note that at high voltages the t010 distributions are narrower than the single-exponential distributions expected for Markovian processes.27 Similar behavior was observed earlier for α-synuclein passage through another β-barrel channel, α-hemolysin, at relatively high applied potentials.30 This narrowing implies a departure from equilibrium processes and requires a more complex model for the translocation process.
Drift-diffusion model
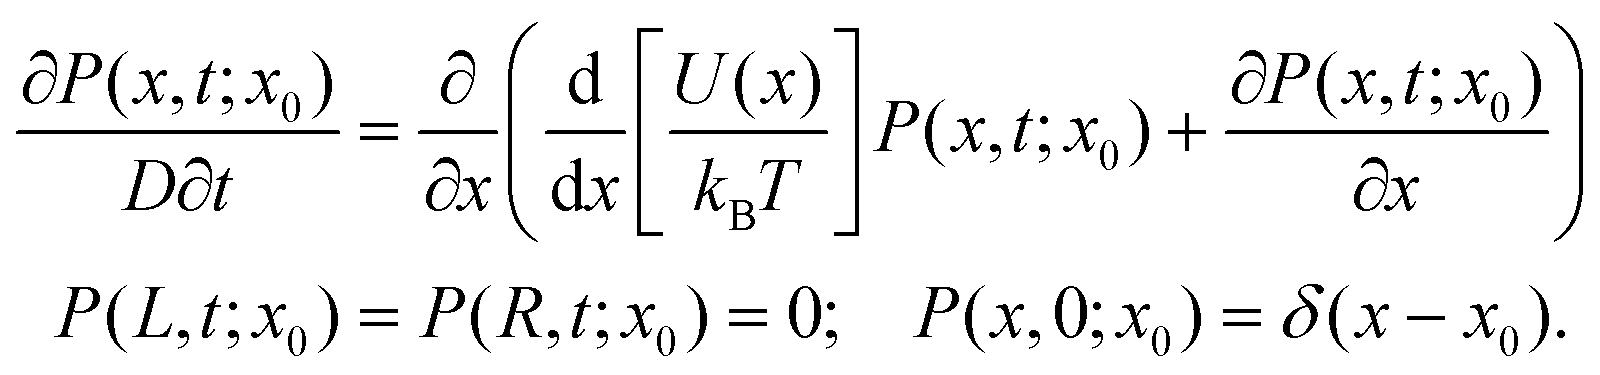
It has long been recognized that the escape time of polyelectrolytes from nanopores can be described by a one-dimensional free energy profile11 if the interaction time between the polyelectrolyte and the pore is significantly longer than the longest thermal relaxation time, or Zimm time.31 This condition is met for ssDNA in biological nanopores,12 for short dsDNA strands in a pressure-voltage trap,18 and for long dsDNA strands subjected to very weak forces.17 In each case, as well as for capture dynamics,7,9 a free energy modeling approach successfully described the stochastic dynamics at play. Here we use the term “quasipotential” for such a free energy profile because electrokinetic forces32,33 are not strictly conservative.In order to construct a quasipotential that describes the stochastic motion of a single molecule of α-synuclein in a VDAC channel, we parameterize the state of the α-synuclein molecule by the position x along the contour of the molecule that is located in the center of the VDAC channel. The interval of interest is then the length L of the molecule, which is taken to be 56 nm.24 Position x = 0 corresponds to the last amino acid of the C terminus being in the center of the VDAC channel, while position x = L means that the first amino acid at the N terminus is in the center when the translocation is almost complete. (The problem is perhaps more easily envisioned by imagining the pore diffusing along the length of α-synuclein. In this case the position x corresponds to the position of the pore along the molecule, the boundary at x = 0 to the completion of the retraction process, and the boundary at x = L to the completion of the translocation process.) The dynamics are then described by a one-dimensional Smoluchowski drift-diffusion equation for the probability distribution P(x,t;x0) that a molecule with initial position x0 is at position x after time t:
 | (3) |
Here D is the diffusion constant along the length of the molecule, which we assume to be position-independent and related to the drag coefficient by the fluctuation–dissipation relation.17 The absorbing boundary conditions encapsulate the improbability of a molecule spontaneously re-entering the channel after leaving by retraction at x = 0 or translocation at x = L. We have also introduced the quasipotential U(x) that contains all of the available information about the time-averaged forces acting on the molecule in the VDAC channel. The use of this potential requires that the α-synuclein–VDAC complex is in quasi-equilibrium, i.e. at each position x the α-synuclein molecule can sufficiently explore the configuration space available to the unbound parts of the molecule. This condition is satisfied if the Zimm time of the α-synuclein is much shorter than the average escape time 〈t010〉 measured in the experiment. Using the measured polypeptide persistence length of 0.3 nm, the Zimm time of α-synuclein is estimated to be ≈16 ns,31 while the escape times are milliseconds or longer. The condition of quasi-equilibrium also allows us to include an entropic term in the quasipotential, which for an infinitely thin nanopore is given by:11,12
 | (4) |
| UE(x) = σ(x)(V − V0)x. | (5) |
Here σ(x) is the position-dependent linear charge density on the α-synuclein molecule, V is the applied voltage, and V0 is a small voltage offset that occurs due to asymmetries that are not controlled experimentally. We note that α-synuclein has a charged C-terminal tail of length 16 nm, while the remainder of the molecule is weakly charged.25 The charge density function can therefore be simply written as:
 | (6) |
 | (7) |
The full quasipotential is then
| U(x) = UE(x) + UB(x) + US(x). | (8) |
The components of the quasipotential are broken down in Fig. 2a, while the voltage-dependence of the full quasipotential (using the optimized parameters) is shown in Fig. 2b with units of energy of kBT. The escape time distribution, including contributions from both retraction and translocation, is given by the flux of probability from the boundaries:
 | (9) |
 | ||
| Fig. 2 Drift-diffusion model of the motion of α-synuclein in the VDAC channel. (a) Construction of the quasipotential from electrostatic, binding free energy, and entropic considerations. Solid and dashed lines correspond to the quasipotential calculated respectively for positive and negative voltage polarities. (b) Voltage dependence of the quasipotential for positive (trans-side capture, solid curve) and negative (cis-side capture, dashed curve) voltage polarities. (c) Results of optimization to the drift-diffusion model showing the average duration of 010 events (center) and the duration histograms at selected transmembrane potentials (left and right panels). At high absolute potentials, the drift-diffusion model (solid lines) describes the histogram shapes better than a single-exponential function (dashed lines). Error bars represent one standard deviation from the mean. | ||
The quasipotential contains six free parameters: V0, σC, σN, Eb, wb, xb. Note that all of these parameters should be independent of voltage polarity, i.e. which side of the channel the α-synuclein is captured from, except xb, which depends on the geometry of the α-synuclein–VDAC complex and will be affected by the trans-membrane asymmetry of the VDAC channel. Therefore, we divide this parameter into two, one for negative polarities, xb−, and one for positive polarities, xb+. The complete problem also has one additional free parameter, D, for a total of eight free parameters. The “injection point” x0 is chosen to be the minimum of U(x) for x > 5 nm and x < 20 nm and is numerically implemented as a normalized Gaussian distribution with width 0.5 nm.
Eqn (3) was solved numerically with the backward Euler method using the finite element integration package FiPy.34 For compatibility with experiment, only the dwell times longer than 50 μs were calculated. The results of optimization of f(t;x0) to the experimentally determined t010 distributions for α-synuclein at 1 nM are shown in Fig. 2c. While the optimization is represented using the average time 〈t010〉, we emphasize that the model was optimized to the t010 histograms, a representative few of which are shown in the side panels. It is clear that at the higher potentials, the Markov state model (dashed lines) breaks down, and the drift-diffusion model is required to adequately describe the data. The optimized parameters, which yielded a reduced χ2 of 1.67, are shown in Table 2.
| Parameter | Value (95% CI) |
|---|---|
| a Intervals shown are 95% confidence intervals. b 1 nC m−1 = 1 pN mV−1 = 6.25e− nm−1. | |
| Model parameters | |
| V 0 [mV] | −0.24+0.10−0.10 |
|
σ
Cb [nC m−1] |
0.1559+0.0045−0.0037 |
|
σ
Nb [nC m−1] |
0.0070+0.0060−0.0038 |
| E b/kBT | 16.66+0.85−0.71 |
| w b [nm] | 3.66+0.40−0.35 |
| x b + [nm] | 13.28+0.33−0.23 |
| x b − [nm] | 14.03+0.37−0.25 |
| log10D [nm2 s−1] |
5.609+0.075−0.084 |
| Derived quantities | |
| D [μm2 s−1] | 0.407+0.077−0.072 |
| x b −–xb+ [nm] | 0.755+0.049−0.035 |
| Q C/e | −15.59+0.45−0.38 |
| Q N/e | −1.75+0.95−1.39 |
The charge of the C-terminal tail, QC, corresponds well to the net 14 negative charges expected from the amino acid sequence of α-synuclein.25 The net charge of the N-terminal region, QN, is expected to be slightly positive from the amino acid sequence; the small negative charge predicted by the model may indicate the presence of a small amount of electro-osmotic flow due to the native anion selectivity of the VDAC channel,35 which is preserved in the presence of a neutral polypeptide strand.
The effective diffusion constant, D ≈ 0.4 μm2 s−1, of the α-synuclein polypeptide in the VDAC pore, which has a diameter of about 2.7 nm,36 is smaller than that measured for dsDNA in solid state nanopores of 5–10 nm diameter, ≈10 μm2 s−1,17,18 and larger than that measured for ssDNA in α-hemolysin channels of 1.1 nm diameter37 ≈0.2 μm2 s−1.38,39 This hierarchy is reasonable from purely hydrodynamic considerations. By comparison, the effective free diffusion constant of the solubilized α-synuclein random coil is 114 μm2 s−1.40
Using this result, we can estimate the time required after capture for the system to find the quasipotential minimum. The speed of the C-terminal tail under the influence of the electric field is the ratio of the force σCV and the drag coefficient kBT/D. The maximum distance traveled to the potential minimum is the length of the CTT, LC = 16 nm. Thus the equilibration time is τeq ≈ LCkBT/σCVD. At 27.5 mV (the smallest potential considered here), this is 37 μs, which is less than the 60 μs minimum dwell time we can detect experimentally. This calculation justifies equating x0 to the minimum of the quasipotential.
The asymmetry between the escape times observed for positive and negative transmembrane polarities can be tentatively explained by simple geometric considerations. The difference in barrier position xb−−xb+ shows that approximately two more amino acids (≈ 0.8 nm) penetrate the pore when the molecule is captured at negative voltage polarities. This “penetration asymmetry”, which is small relative to the membrane thickness, is likely to arise from the known structural36,41 and functional42–44 asymmetries of the VDAC channel. Regardless of its origin, the penetration asymmetry has a profound effect on the energy barriers and rates for escape by either retraction or translocation, as can be seen by comparing the solid (V > 0) and dashed (V < 0) quasipotentials in Fig. 2b, which differ by several kBT at the potential minimum.
The absolute position of the barrier, near the junction between the charged and uncharged regions of the α-synuclein molecule, is of interest for several reasons. First, it explains why in the Markov model the charge nt, associated with translocation, is rather small, only 2–3 charges, so the barrier to translocation changes only slightly with voltage. Second, the height of the barrier to translocation corresponds directly to the free energy ΔΔG(0)0t ≈ 15kBT derived from the Markov model. These two estimates are in agreement with the reported micromolar-scale dissociation constants of α-synuclein to lipid membranes.45 Third, the density of ions in, and hence the conductance of, the pore should depend on the charge of the polypeptide strand inside the pore.46 Thus, if the molecule is trapped near the junction of the charged and uncharged region (the “charge junction” shown in Fig. 1a), we expect to see noise in state 1 as the position of the charge junction fluctuates across the pore. This increase in noise over the noise of the open state 0 is clearly observed in Fig. 1b.
Effect of polyanionic CTT on VDAC electrical properties
To further explore the effect of the charged polypeptide region on the electrical properties of the VDAC channel, we performed a measurement of the α-synuclein/VDAC interaction under a salt concentration gradient. In this case, the KCl concentration on the cis-side was 0.2 M and 1.0 M on the trans side. As shown in Fig. 3a, under these conditions the current level associated with each of the blocked states splits into two. The new states are denoted states 1–1 and 1–2 for the higher and lower current levels derived from state 1, respectively, and 2–1 and 2–2 for the higher and lower current levels derived from state 2. Fig. 3b shows I–V curves for each of the five levels, from which the ion selectivity associated with each state is determined (see Methods). For each of the blocked states, the higher-current state has similar anionic selectivity to the open channel; the lower-current state is cation selective. The selectivity is essentially reversed, while the conductances (the slopes of the I–V curves) of the higher- and lower-current states are very similar. These results can be understood using the qualitative scheme depicted in Fig. 3c, in which the presence of one anionic α-synuclein tail is sufficient to reverse the selectivity of the channel, while the presence of any number of uncharged polypeptide strands has little effect on the channel selectivity. Presumably due to inter-strand electrostatic repulsion, the state in which two anionic tails are simultaneously in the channel is not observed. Thus, the selectivity data provide crucial support to the drift-diffusion model by confirming its prediction of stochastic motion of the charge junction in the nanopore. The fact that both the first and second blocked states split under salt gradient conditions also validates the idea that multiple α-synuclein molecules can interact simultaneously with VDAC (Fig. 1c). | ||
| Fig. 3 Effect of α-synuclein on VDAC electrical properties. (a) Recording of the single-channel current under a salt concentration gradient, demonstrating that each of the two blocked states splits into two, for a total of five states including the open state. A histogram of the current level is shown at the far right. (b) I–V curves and analysis of the channel selectivity for the five states. Estimated 68% confidence intervals of the current values lie within the size of the data points. The uncertainty in the reported selectivities denotes half the 68% confidence interval. (c) Proposed position of the CTT for each of the states. The presence of the anionic CTT of α-synuclein in the channel reverses the selectivity of the channel, while the uncharged N-terminal region leaves the selectivity relatively unaffected. | ||
Translocation probability
The drift-diffusion model allows direct calculation of the probability of translocation ptrans (as opposed to retraction) of an α-synuclein molecule captured by the VDAC channel. This is accomplished by numerical evaluation of the expression for the probability of escape at x = L,28 . This probability, shown in Fig. 4, is strongly dependent on transmembrane potential, ranging from 10−9 at zero potential to almost 1 at 40 mV. This raises intriguing possibilities regarding α-synuclein's role in disease. In particular, α-synuclein has been shown to disrupt the function of complex I in the mitochondrial inner membrane.47 The present work shows that a very small increase in the polarization of the outer membrane48 could dramatically increase the flux of α-synuclein into the intermembrane space of mitochondria. Whether this mechanism has in vivo relevance remains to be seen.
 | ||
| Fig. 4 Probability that a captured molecule will translocate, demonstrating the sensitivity of this parameter to the transmembrane potential. | ||
Conclusions
In summary, we have shown that experimental observations of the dynamics of an α-synuclein molecule captured by the VDAC channel can be understood using free energy considerations that allow for the possibility of α-synuclein translocation as well as retraction. A simple Kramers-like description suffices for low transmembrane potentials in which the dynamics are dominated by the energy barriers associated with retraction and unbinding/translocation. For high transmembrane potentials, a drift-diffusion description is required to account for the experimental observations. The latter yields important insights into the detailed mechanism of the α-synuclein–VDAC interaction. It reproduces the charge of the α-synuclein CTT expected from the amino acid sequence, accounts for the asymmetry of the VDAC channel, yields the diffusion constant of a polypeptide inside the VDAC pore, provides an upper limit for the binding energy of the α-synuclein molecule to the membrane surface, and predicts an extreme sensitivity of the translocation probability to transmembrane potential. The multistep translocation of a-synuclein through the VDAC pore, and the accompanying changes in VDAC transport properties, are likely to be important mechanisms of mitochondrial regulation of the fluxes of both anionic and cationic signaling and metabolic ions. Our findings are also of particular relevance to the ongoing effort to decipher the physiological function of monomeric α-synuclein in the still unknown mechanisms of its involvement in Parkinson disease.To the best of our knowledge, we have for the first time directly linked the amino acid sequence of a natural polypeptide chain to its voltage-driven interaction with a nanopore. We emphasize that the well-defined electrical heterogeneity inherent in the blocky architecture of the α-synuclein polymer is crucial for the precise evaluation of the mechanistic features of its interaction with the transmembrane channel. In particular, the presence of a junction between the charged and uncharged regions of the polymer provides unprecedented sensitivity to the details of the free energy landscape of the translocation process.
Methods
Single channel recording under a salt concentration gradient
Single VDAC channel recordings were obtained as previously described.27 The side of the planar lipid bilayer to which VDAC was added during the reconstitution is the cis side; the opposite side is the trans side. Voltage polarities are defined to be positive when the cis side has the higher potential. To create the salt concentration gradient, the trans side was bathed with a 1 M KCl solution buffered with 5 mM HEPES at pH 7.4, while the cis side (to which α-synuclein was added) was bathed with a 0.2 M KCl solution under the same buffering conditions. Junction potentials with the Ag/AgCl electrodes were minimized by embedding the electrodes in 2 M KCl agarose salt bridges. Recombinant α-synuclein was a kind gift from Dr. Jennifer Lee.Current level and selectivity determination
Current recordings at each voltage were collected with a 4 μs sampling interval and median filtered (order 81). The filtered current data were then collected into histograms using 160 bins ranging from −20 to 140 pA. Peaks in the histograms, which correspond to discrete conductance levels (Fig. 3a), were selected manually and fit to a Gaussian function using a Levenburg–Marquardt algorithm. The uncertainty in the peak position was estimated from the covariance matrix of the Gaussian parameters at their optimized values. Lines were fit to the I–V curves plotted in Fig. 3b, and the selectivity of each state was calculated from the voltage intercept of each line using the Goldman–Hodgkin–Katz equation.49Optimizations
Unless otherwise specified, all optimizations were performed using the DREAM Markov Chain Monte Carlo (MCMC) algorithm50 implemented in the software package Bumps.51 The number of generations calculated was tuned to the complexity of the problem; for the optimization to the drift-diffusion model, the MCMC algorithm probed about 10000 generations of 16 parameter sets. The characteristic relaxation time of this system was about 100 generations. Other optimizations were less complex and converged within about 3000 generations. Confidence intervals were calculated from parameter distributions determined by sampling the last 500 generations. Calculations were performed on the Darter Cray XC3052 and the Bridges52,53 high performance computing systems.
Event discrimination and analysis
Current recordings were divided into regions by applied voltage. The data were then filtered using an order 3 median filter (the sampling interval was 20 μs). To identify transitions between state 0 and state 1, a threshold crossing algorithm was then applied to the filtered data, with the threshold level set at 80% of the state 0 current level. The direction of the transition was determined from the slope of the data at the transition. Transitions from state 1 to state 2 were similarly detected using a threshold level of 27% of the state 0 current level. Histograms of the event durations were calculated from the transition times as shown in Fig. 1b. Average event times and their uncertainties were determined from bootstrap distributions obtained from random resampling of the experimentally observed event time distributions.Acknowledgements
This work used the Extreme Science and Engineering Discovery Environment (XSEDE), which is supported by National Science Foundation grant number ACI-1053575. Specifically, it used the Darter Cray XC30 system and the Bridges system, which is supported by NSF award number ACI-1445606, at the Pittsburgh Supercomputing Center (PSC). D. P. H. acknowledges support from the NIH/NIST Research Associateship Program through the National Academies of Sciences. P. A. G., T. K. R., and S. M. B. were supported by the Intramural Research Program of the Eunice Kennedy Shriver National Institute of Child Health and Human Development, NIH. Certain commercial materials, equipment, and instruments are identified in this work to describe the experimental procedure as completely as possible. In no case does such an identification imply a recommendation or endorsement by NIST, nor does it imply that the materials, equipment, or instrument identified are necessarily the best available for the purpose.References
- D. Branton, D. W. Deamer, A. Marziali, H. Bayley, S. A. Benner, T. Butler, M. Di Ventra, S. Garaj, A. Hibbs, X. H. Huang, S. B. Jovanovich, P. S. Krstic, S. Lindsay, X. S. S. Ling, C. H. Mastrangelo, A. Meller, J. S. Oliver, Y. V. Pershin, J. M. Ramsey, R. Riehn, G. V. Soni, V. Tabard-Cossa, M. Wanunu, M. Wiggin and J. A. Schloss, Nat. Biotechnol., 2008, 26, 1146–1153 CrossRef CAS PubMed
.
- D. Deamer, M. Akeson and D. Branton, Nat. Biotechnol., 2016, 34, 518–524 CrossRef CAS PubMed
- J. J. Kasianowicz and S. M. Bezrukov, Nat. Biotechnol., 2016, 34, 481–482 CrossRef PubMed
- J. Clarke, H.-C. Wu, L. Jayasinghe, A. Patel, S. Reid and H. Bayley, Nat Nanotechnol, 2009, 4, 265–270 CrossRef CAS PubMed
- I. M. Derrington, T. Z. Butler, M. D. Collins, E. Manrao, M. Pavlenok, M. Niederweis and J. H. Gundlach, Proc. Natl. Acad. Sci. U. S. A., 2010, 107, 16060–16065 CrossRef PubMed
- S. Garaj, S. Liu, J. A. Golovchenko and D. Branton, Proc. Natl. Acad. Sci. U. S. A., 2013, 110, 12192–12196 CrossRef CAS PubMed
- M. Muthukumar, J. Chem. Phys., 2010, 132, 195101 CrossRef CAS PubMed
- M. Wanunu, W. Morrison, Y. Rabin, A. Y. Grosberg and A. Meller, Nat. Nanotechnol., 2010, 5, 160–165 CrossRef CAS PubMed
- N. A. Bell, M. Muthukumar and U. F. Keyser, Phys. Rev. E: Stat. Phys., Plasmas, Fluids, Relat. Interdiscip. Top., 2016, 93, 022401 CrossRef PubMed
- A. Grosberg, S. Nechaev, M. Tamm and O. Vasilyev, Phys. Rev. Lett., 2006, 96 Search PubMed
- W. Sung and P. J. Park, Phys. Rev. Lett., 1996, 77, 783–786 CrossRef CAS PubMed
- D. K. Lubensky and D. R. Nelson, Biophys. J., 1999, 77, 1824–1838 CrossRef CAS PubMed
- A. J. Storm, C. Storm, J. Chen, H. Zandbergen, J. F. Joanny and C. Dekker, Nano Lett., 2005, 5, 1193–1197 CrossRef CAS PubMed
- B. Lu, F. Albertorio, D. P. Hoogerheide and J. A. Golovchenko, Biophys. J., 2011, 101, 70–79 CrossRef CAS PubMed
- R. Kumar and M. Muthukumar, J. Chem. Phys., 2009, 131, 194903 CrossRef PubMed
- D. K. Lathrop, E. N. Ervin, G. A. Barrall, M. G. Keehan, R. Kawano, M. A. Krupka, H. S. White and A. H. Hibbs, J. Am. Chem. Soc., 2010, 132, 1878–1885 CrossRef CAS PubMed
- D. P. Hoogerheide, F. Albertorio and J. A. Golovchenko, Phys. Rev. Lett., 2013, 111, 248301 CrossRef PubMed
- D. P. Hoogerheide, B. Lu and J. A. Golovchenko, ACS Nano, 2014, 8, 7384–7391 CrossRef CAS PubMed
- U. F. Keyser, B. N. Koeleman, S. van Dorp, D. Krapf, R. M. M. Smeets, S. G. Lemay, N. H. Dekker and C. Dekker, Nat. Phys., 2006, 2, 473–477 Search PubMed
- M. Colombini, Mol. Cell. Biochem., 2004, 256, 107–115 CrossRef PubMed
-
T. K. Rostovtseva and S. M. Bezrukov, in Electrophysiology of Unconventional Channels and Pores, ed. A. H. Delcour, Springer, Switzerland, 2015, vol. 18, pp. 3–31 Search PubMed
- M. G. Spillantini, M. L. Schmidt, V. M. Y. Lee, J. Q. Trojanowski, R. Jakes and M. Goedert, Nature, 1997, 388, 839–840 CrossRef CAS PubMed
- A. B. Singleton, M. Farrer, J. Johnson, A. Singleton, S. Hague, J. Kachergus, M. Hulihan, T. Peuralinna, A. Dutra, R. Nussbaum, S. Lincoln, A. Crawley, M. Hanson, D. Maraganore, C. Adler, M. R. Cookson, M. Muenter, M. Baptista, D. Miller, J. Blancato, J. Hardy and K. Gwinn-Hardy, Science, 2003, 302, 841–841 CrossRef CAS PubMed
- S. R. K. Ainavarapu, J. Brujić, H. H. Huang, A. P. Wiita, H. Lu, L. Li, K. A. Walther, M. Carrion-Vazquez, H. Li and J. M. Fernandez, Biophys. J., 2007, 92, 225–233 CrossRef CAS PubMed
-
J. C. Rochet, B. A. Hay and M. Guo, in Molecular Biology of Neurodegenerative Diseases, ed. D. B. Teplow, Elsevier Academic Press Inc, San Diego, 2012, vol. 107, pp. 125–188 Search PubMed
- C. M. Pfefferkorn, Z. Jiang and J. C. Lee, Biochim. Biophys. Acta, 2012, 1818, 162–171 CrossRef CAS PubMed
- T. K. Rostovtseva, P. A. Gurnev, O. Protchenko, D. P. Hoogerheide, T. L. Yap, C. C. Philpott, J. C. Lee and S. M. Bezrukov, J. Biol. Chem., 2015, 290, 18467–18477 CrossRef CAS PubMed
-
N. G. van Kampen, Stochastic processes in physics and chemistry, Elsevier, Amsterdam, Boston, 3rd edn., 2007 Search PubMed
- P. Hanggi, P. Talkner and M. Borkovec, Rev. Mod. Phys., 1990, 62, 251–341 CrossRef
- P. A. Gurnev, T. L. Yap, C. M. Pfefferkorn, T. K. Rostovtseva, A. M. Berezhkovskii, J. C. Lee, V. A. Parsegian and S. M. Bezrukov, Biophys. J., 2014, 106, 556–565 CrossRef CAS PubMed
- B. H. Zimm, J. Chem. Phys., 1956, 24, 269–278 CrossRef CAS
- S. van Dorp, U. F. Keyser, N. H. Dekker, C. Dekker and S. G. Lemay, Nat. Phys., 2009, 5, 347–351 Search PubMed
- B. Lu, D. P. Hoogerheide, Q. Zhao and D. P. Yu, Phys. Rev. E: Stat. Phys., Plasmas, Fluids, Relat. Interdiscip. Top., 2012, 86, 011921 CrossRef PubMed
- J. E. Guyer, D. Wheeler and J. A. Warren, Comput. Sci. Eng., 2009, 11, 6–15 CrossRef CAS
- E. Blachly-Dyson, S. Z. Peng, M. Colombini and M. Forte, Science, 1990, 247, 1233–1236 CrossRef CAS PubMed
- R. Ujwal, D. Cascio, J. P. Colletier, S. Faham, J. Zhang, L. Toro, P. P. Ping and J. Abramson, Proc. Natl. Acad. Sci. U. S. A., 2008, 105, 17742–17747 CrossRef CAS PubMed
- L. Song, M. R. Hobaugh, C. Shustak, S. Cheley, H. Bayley and J. E. Gouaux, Science, 1996, 274, 1859–1866 CrossRef CAS PubMed
- D. K. Lathrop, E. N. Ervin, G. A. Barrall, M. G. Keehan, R. Kawano, M. A. Krupka, H. S. White and A. H. Hibbs, J. Am. Chem. Soc., 2010, 132, 1878–1885 CrossRef CAS PubMed
- J. Mathe, A. Aksimentiev, D. R. Nelson, K. Schulten and A. Meller, Proc. Natl. Acad. Sci. U. S. A., 2005, 102, 12377–12382 CrossRef CAS PubMed
- S. Nath, M. Deng and Y. Engelborghs, Methods Mol. Biol., 2012, 895, 499–506 CrossRef CAS PubMed
- J. Song and M. Colombini, J. Bioenerg. Biomembr., 1996, 28, 153–161 CrossRef CAS PubMed
- M. Zizi, C. Byrd, R. Boxus and M. Colombini, Biophys. J., 1998, 75, 704–713 CrossRef CAS PubMed
- T. K. Rostovtseva, N. Kazemi, M. Weinrich and S. M. Bezrukov, J. Biol. Chem., 2006, 281, 37496–37506 CrossRef CAS PubMed
- O. Teijido, S. M. Rappaport, A. Chamberlin, S. Y. Noskov, V. M. Aguilella, T. K. Rostovtseva and S. M. Bezrukov, J. Biol. Chem., 2014, 289, 23670–23682 CrossRef CAS PubMed
- A. R. Braun, M. M. Lacy, V. C. Ducas, E. Rhoades and J. N. Sachs, J. Am. Chem. Soc., 2014, 136, 9962–9972 CrossRef CAS PubMed
- R. M. M. Smeets, U. F. Keyser, D. Krapf, M.-Y. Wu, N. H. Dekker and C. Dekker, Nano Lett., 2006, 6, 89–95 CrossRef CAS PubMed
- L. Devi, V. Raghavendran, B. M. Prabhu, N. G. Avadhani and H. K. Anandatheerthavarada, J. Biol. Chem., 2008, 283, 9089–9100 CrossRef CAS PubMed
- V. V. Lemeshko, Biochim. Biophys. Acta, 2014, 1838, 1801–1808 CrossRef CAS PubMed
-
B. Hille, Ion channels of excitable membranes, Sinauer, Sunderland, Mass., 3rd edn, 2001 Search PubMed
- J. A. Vrugt, C. J. F. ter Braak, C. G. H. Diks, B. A. Robinson, J. M. Hyman and D. Higdon, Int. J. Nonlinear Sci. Numer. Simul., 2009, 10, 273–290 Search PubMed
-
P. A. Kienzle, J. Krycka, N. Patel and I. Sahin, Bumps (Version 0.7.5.4) [Computer Software], University of Maryland, College Park, MD, 2011 Search PubMed
- J. Towns, T. Cockerill, M. Dahan, I. Foster, K. Gaither, A. Grimshaw, V. Hazlewood, S. Lathrop, D. Lifka, G. D. Peterson, R. Roskies, J. R. Scott and N. Wilkins-Diehr, Comput. Sci. Eng., 2014, 16, 62–74 CrossRef
-
N. A. Nystrom, M. J. Levine, R. Z. Roskies and J. R. Scott, presented in part at the Proceedings of the 2015 XSEDE Conference: Scientific Advancements Enabled by Enhanced Cyberinfrastructure, St. Louis, Missouri, 2015
| This journal is © The Royal Society of Chemistry 2017 |