DOI:
10.1039/C6MD00462H
(Research Article)
Med. Chem. Commun., 2017,
8, 184-190
Synthesis, crystal structure, cytotoxicity and action mechanism of a Rh(III) complex with 8-hydroxy-2-methylquinoline as a ligand†‡
Received
13th August 2016
, Accepted 15th October 2016
First published on 25th October 2016
Abstract
A rhodium(III) complex, [Rh(MQ)(DMSO)2Cl2] (1), with 8-hydroxy-2-methylquinoline as the ligand was synthesized and characterized. Complex 1 exhibited cytotoxicity against BEL-7404, Hep-G2, NCI-H460, T-24, and A549 cell lines with IC50 values in the micromolar range (6.52–17.86 μM). Various experiments on the Hep-G2 cells showed that complex 1 caused cell cycle arrest at the S phase, downregulation of cdc25 A, cyclin A, cyclin B and CDK2, and upregulation of p21, p27 and p53. Furthermore, cytotoxicity mechanism studies suggested that complex 1-induced apoptosis was achieved via disruption of the mitochondrial function, which led to a significant loss of the mitochondrial membrane potential, an increase in the cellular levels of reactive oxygen species, cytochrome c, and apaf-1, and a fluctuation of the intracellular Ca2+ concentration. Taken altogether, complex 1 can trigger cancer cell death by inducing apoptosis through a mitochondrial dysfunction pathway.
1. Introduction
In the last few decades, inorganic metal complexes have had an enormous impact on modern medicine.1–3 Among them, cisplatin, carboplatin and oxaliplatin belong to one of the most important classes of chemotherapeutic agents for the treatment of solid tumors.4–6 They target nucleic acids inside the tumor cells and disrupt DNA replication and transcription. However, due to a lack of specificity for tumor cells, their severe side effects, including nephrotoxicity, hepatotoxicity, ototoxicity, neurotoxicity, and gastrointestinal toxicity, limit their applications. Notably, the intrinsic and acquired resistance in various tumor cells also limit the clinical efficacy of these drugs.7,8 Therefore, developing new generations of metal complexes capable of interacting with nucleic acids and triggering apoptosis is currently one of the most promising strategies to develop anticancer agents for chemotherapy.9–11
Metal complexes with an 8-hydroxy-quinoline scaffold have attracted great attention from medicinal chemists as they exhibit positive effects in treating many diseases, including neurodegenerative diseases12,13 and cancer.14,15 For example, Cu(II) complexes with 8-hydroxy-quinoline and its derivatives as ligands were shown to be active in the treatment of Alzheimer's disease.16–20 Since 8-hydroxy-quinoline possesses a superior chelating ability towards transition metal ions, a series of transition metal complexes with 8-hydroxy-quinoline and its derivatives as ligands have been synthesized and characterized recently. These complexes include quilamine chelators for Fe(II),21 glycosylated Cu(II) ionophores as prodrugs for β-glucosidase activation in targeted cancer therapies,22,23 Os(VI) complexes,24 clioquinol Cu(II) and Zn(II) complexes,25 hydroxyquinoline-containing complexes,26–28 and Ru(II) complexes.29,30 Chen and coworkers have reported a series of 8-hydroxy-quinoline metal complexes with high antitumor activity.31–37 Their findings suggested that 8-hydroxy-quinoline can coordinate with metal ions to form planar or partially planar coordination structures. These complexes can intercalate the neighboring bases of DNA, thereby blocking DNA replication and further inducing tumor cell death. In addition, a large number of Pt(II and IV) complexes with 8-hydroxy-quinoline and its derivatives as ligands were synthesized and shown to be cytotoxic to tumor cells.25,37–42 Their mechanisms of action, however, remain unexplored.
In the present study, a Rh(III) complex with 8-hydroxy-2-methylquinoline (H-MQ) as the ligand was synthesized and characterized by IR, ESI-MS, elemental analysis, NMR and single crystal X-ray diffraction analysis. The cytotoxicity of this complex towards many tumor cell lines was evaluated. A possible antitumor mechanism was proposed based on the results of a series of mechanistic studies.
2. Results and discussion
2.1. Synthesis
The reaction of H-MQ with RhCl3 in a CH3CN/DMSO (10![[thin space (1/6-em)]](https://www.rsc.org/images/entities/char_2009.gif) :1) solution under solvothermal conditions gave rise to [Rh(MQ)(DMSO)2Cl2] (1) (Scheme 1). The structure of complex 1 was determined by single-crystal X-ray diffraction analysis, UV-vis spectroscopy, elemental analysis, IR, ESI-MS and NMR (Fig. S1–S5‡).
:1) solution under solvothermal conditions gave rise to [Rh(MQ)(DMSO)2Cl2] (1) (Scheme 1). The structure of complex 1 was determined by single-crystal X-ray diffraction analysis, UV-vis spectroscopy, elemental analysis, IR, ESI-MS and NMR (Fig. S1–S5‡).
 |
| | Scheme 1 Synthetic route of complex 1. | |
2.2. Structural characterization of complex 1
Single-crystal X-ray diffraction analysis showed that the crystal structure of complex 1 belongs to the monoclinic crystal system, space group P21/n. The details of the crystallographic data and structure refinement parameters are summarized in Table S1.‡ Selected bond angles and distances are listed in Table S2.‡ As shown in Fig. 1, the Rh(III) center in complex 1 adopts an approximately six-coordinated octahedral geometry and is surrounded by one MQ ligand, two chlorine ligands and two DMSO ligands. The N1 and O1 atoms are from MQ and the other atoms (Cl1, Cl2, S1, and S2) are from chlorine and DMSO. The bite angles of the chelate ring, i.e., (N(1)–Rh(1)–O(1), N(1)–Rh(1)–S(1), and N1(1)–Rh(1)–Cl(1)), are 82.0(3)°, 168.2(3)°, and 88.1(2)°, respectively. The Rh–O1 distance [2.010(7) Å] is substantially shorter than the Rh–N1 distance [2.119(8) Å]. The bond lengths of the other ligands bonded to the Rh center are within the normal range.
 |
| | Fig. 1 ORTEP drawing of complex 1 with labels of the atoms. | |
2.3. Stability of complex 1 in solution
As shown in Fig. S3–S5,‡ the stability of complex 1 under physiologically relevant conditions (i.e., 10 mM TBS buffer with 1% DMSO, pH 7.35, and distilled water) was examined using UV-vis spectroscopy and ESI-MS. The time-dependent (0–48 h) UV-vis spectra of complex 1 are shown in Fig. S3 and S4.‡ It is evident that there were no obvious changes among the spectra, suggesting that the coordination of MQ to the metal ion remained intact within 48 h under these physiologically relevant conditions. As shown in Fig. S5,‡ ESI-MS analysis of complex 1 dissolved in the TBS buffer containing 5% DMSO revealed a base peak at 590.07, corresponding to [M–Cl–DMSO + CH3CN + H2O]+. After a 48 h incubation, the base peak of the sample was detected at 555.00, corresponding to [M–Cl–2DMSO + 2CH3CN + H2O]+. The ESI-MS result confirmed that the binding between Rh and MQ in complex 1 was not disrupted after the 48 h incubation.
2.4.
In vitro cytotoxicity study
The cytotoxicity of complex 1 was investigated in BEL-7404, Hep-G2, NCI-H460, T-24, A549 and HL-7702 cell lines via the MTT assay. The cytotoxicity of the starting compounds used in the synthesis of complex 1, i.e., H-MQ and RhCl3, was also measured. Cisplatin was used as a positive control. Each cell line was treated with 20 μM of each compound, followed by a 48 h incubation. As shown in Table S3,‡ the inhibitory rates of complex 1 against these cell lines are higher than those of H-MQ37 and RhCl3. The IC50 values were also calculated and summarized in Table S4‡ and Fig. 2. Complex 1 showed much lower IC50 values (6.52–17.86 μM) against the five tumor cell lines (i.e., BEL-7404, Hep-G2, NCI-H460, T-24, and A549) than H-MQ (107.56–187.54 μM),37 RhCl3 (>100 μM), and cisplatin (9.48–28.86 μM). Notably, the Hep-G2 cell line was the most sensitive tumor cell line to complex 1 with an IC50 value of 6.52 ± 0.83 μM, 21-fold and 1.5-fold lower than the corresponding IC50 values of H-MQ and cisplatin, respectively. Furthermore, the cytotoxicity of complex 1 against the Hep-G2 cell line was higher than that against the normal liver cell line HL-7702, indicating that complex 1 was more selective to the tumor cells. In addition, compared to the Pt(II) complex with a H-MQ ligand, complex 1 exhibited a higher cytotoxicity against the Hep-G2 and T-24 tumor cell lines.37
 |
| | Fig. 2 IC50 values (μM) of H-MQ, RhCl3, complex 1 and cisplatin on selected cell lines. | |
2.5. Cell apoptosis induced by complex 1
In order to examine the morphological changes (e.g. cell shrinkage, chromatin condensation, nuclear fragmentation, and formation of apoptotic bodies)43 caused by apoptosis, the Hep-G2 cells treated with H-MQ, complex 1, and cisplatin were stained with Hoechst 33258, respectively. As shown in Fig. 3, pronounced morphological changes corresponding to cell apoptosis, including chromatin condensation (brightly stained), formation of apoptotic bodies, and nuclear fragmentation, were observed in these cells. The number of apoptotic cell nuclei among the complex 1-treated cells was larger than the numbers of apoptotic cell nuclei among the H-MQ-treated cells and the cisplatin-treated cells under the same experimental conditions.
 |
| | Fig. 3 Morphological changes of the Hep-G2 cells treated by 6.5 μM of H-MQ (B), complex 1 (C) and cisplatin (D) for 24 h compared with the control group (A), respectively. Selected fields illustrating the occurrence of apoptosis are shown. The cells with condensed chromatin (brightly stained) were defined as apoptotic cells. The images were acquired using a Nikon Te2000 deconvolution microscope (magnification, 400×). | |
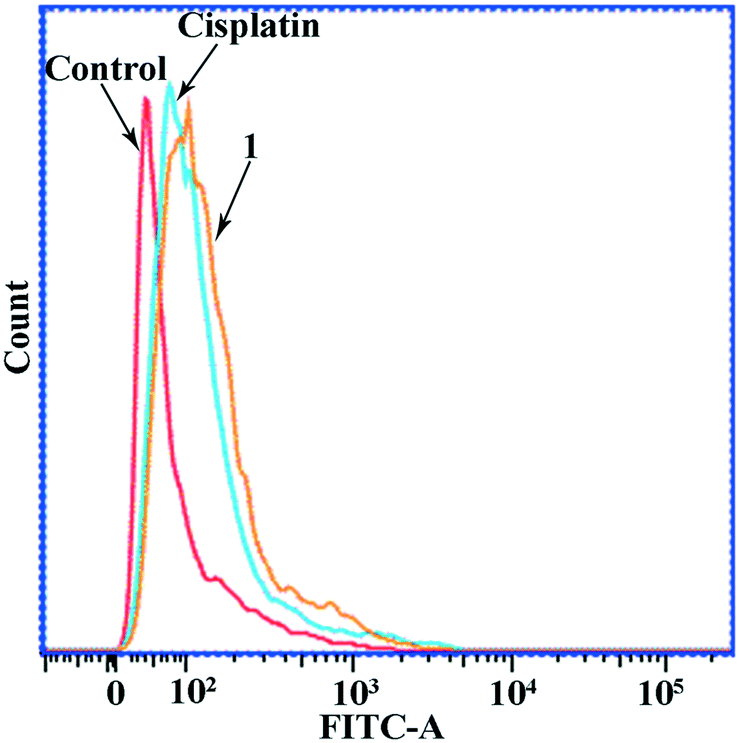
The cell apoptosis induced by these compounds was also investigated by examining phosphatidylserine on the outside of the Hep-G2 cell membrane surface. The apoptotic cells were stained by Annexin V–propidium iodide (PI) double staining, and then visualized by flow cytometry. As shown in Fig. 4, the population of the apoptotic cells (including the late apoptotic cells and early apoptotic cells, Q2 + Q3) was 23.48% in the Hep-G2 cells treated with complex 1. In contrast, the population of the apoptotic cells was determined to be 5.05% and 11.04% in the Hep-G2 cells treated with H-MQ and cisplatin, respectively. Because of the low cytotoxicity of H-MQ against the Hep-G2 cell line, only complex 1 and cisplatin were used in further studies as detailed below.
 |
| | Fig. 4 Annexin V–PI double staining assay on the Hep-G2 cells treated with H-MQ (6.5 μM), complex 1 (6.5 μM), and cisplatin (6.5 μM), respectively, for 24 h. | |
2.6. Alteration in the mitochondrial membrane potential
It is well known that the loss of the mitochondrial membrane potential (Δψ) is a limiting factor in the apoptotic pathway. It has been considered as a new antitumor target and is of high importance to the control of apoptosis.44 To further investigate the action mechanism of complex 1, we monitored the alteration in the mitochondrial membrane potential using a fluorescent probe, JC-1, in the Hep-G2 cells treated with complex 1. As shown in Fig. 5, fluorescence microscopy revealed that the cells in the negative control group showed intense red fluorescence with very weak green fluorescence. In contrast, the cells treated with complex 1 and cisplatin, especially with complex 1, exhibited bright green fluorescence with a marked decrease in red fluorescence, indicating that apoptosis was induced by these two compounds and that the mitochondrial membrane potential was lost in the apoptotic cells.
 |
| | Fig. 5 Collapse of the mitochondrial membrane potential in the Hep-G2 cells treated by 6.5 μM of cisplatin (B) and complex 1 (C) compared with untreated cells (A), for 24 h. The cells were stained with JC-1 and then imaged by florescence microscopy. Selected fields illustrating the live cells (orange-red) and apoptotic cells (green) are shown. The images were acquired using a Nikon Te2000 microscope (magnification, 200×). | |
2.7. Alteration in the expression levels of apoptosis-related proteins
Previous studies have demonstrated that the loss of mitochondrial membrane potential can upregulate the expression of cytochrome c and apoptotic protease activating factor-1 (apaf-1), which activate the caspase cascade by inducing the expression of caspase-3 and caspase-9.45,46 The expression of these apoptosis-related proteins was investigated using western blotting in the Hep-G2 cells treated with complex 1 and cisplatin, respectively. As shown in Fig. 6, compared with the untreated cells, a significant increase in the expression levels of cytochrome c, apaf-1 and caspase-3/9 was observed. The observation indicated that complex 1-induced apoptosis occurred through a caspase-3/9-dependent pathway.
 |
| | Fig. 6 Changes in the expression levels of apoptosis-related proteins. (A) Western blotting analysis of cytochrome c, apaf-1 and caspase-3/9 in the Hep-G2 cells treated with complex 1 (6.5 μM) and cisplatin (6.5 μM), respectively, for 24 h. (B) Densitometric analysis of the western blot bands of cytochrome c, apaf-1 and caspase-3/9 with β-actin as an internal standard. The relative expression level of each protein is represented by the ratio between the density of the corresponding protein band and the density of the β-actin band. The mean SD was calculated from three independent measurements. | |
2.8. Measurement of reactive oxygen species (ROS) generation
The formation of ROS is a crucial trigger in cell apoptotic pathways.47 The amount of ROS in the Hep-G2 cells treated with complex 1 was monitored using flow cytometry. As shown in Fig. 7, the Hep-G2 cells exposed to complex 1 and cisplatin, respectively, exhibited strong green fluorescence compared to the untreated cells, indicating a significant increase in the amount of ROS in these cells. Thus, our findings suggest that complex 1 disrupted the mitochondrial function and induced the formation of ROS, thereby inducing apoptosis.
 |
| | Fig. 7 Measurement of ROS generation by flow cytometric analysis of the Hep-G2 cells treated with complex 1 (6.5 μM) and cisplatin (6.5 μM), respectively, for 24 h. The results are presented as relative fluorescence intensities. | |
2.9. Complex 1-induced fluctuation of intracellular Ca2+
An increase of the intracellular Ca2+ concentration can disrupt the mitochondrial membrane potential and is recognized as a factor for cell apoptosis.48 We examined the effect of complex 1 on the intracellular Ca2+ concentration in Hep-G2 cells. As shown in Fig. 8, in the negative control, the level of intracellular Ca2+ was the lowest. In the Hep-G2 cells treated with complex 1 and cisplatin, respectively, the level of intracellular Ca2+ increased. Notably, the level of intracellular Ca2+ in the complex 1-treated cells was higher than that in the cisplatin-treated cells. These results are consistent with the results from the aforementioned apoptotic studies.
 |
| | Fig. 8 Effects of complex 1 (6.5 μM) and cisplatin (6.5 μM) on the intracellular Ca2+ level in Hep-G2 cells. After treatment with complex 1 (6.5 μM) or cisplatin (6.5 μM), respectively, for 24 h, the Hep-G2 cells were stained with Fluo-3 AM for 30 min and then analyzed by flow cytometry. The results are presented as relative fluorescence intensities. | |
2.10. Cell cycle arrest
Since cell apoptosis induction and cell cycle arrest are closely related,23 the Hep-G2 cells treated with complex 1 were examined by flow cytometry to probe whether cell cycle arrest occurred in these cells. As shown in Fig. 9, the population of the Hep-G2 cells treated with complex 1 at the S phase was determined to be 47.16%, higher than the values obtained in the cisplatin-treated cells (38.62%) and in the negative control (33.17%). Therefore, complex 1 effectively induced cell cycle arrest at the S phase in the Hep-G2 cells.
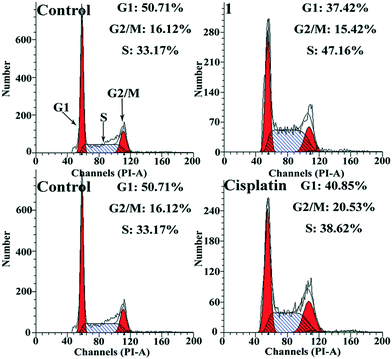 |
| | Fig. 9 Cell cycle arrest induced by complex 1 (6.5 μM) and cisplatin (6.5 μM), respectively, in Hep-G2 cells. | |
2.11. Effect of complex 1 on the expression levels of cell cycle regulators
It was recently reported that cdc25 A, cyclin A, and CDK2 collectively promote S phase progression.49 Using the western blot technique, we examined whether complex 1 altered the expression levels of these proteins. As shown in Fig. 10, the expression levels of cdc25 A, cyclin A and CDK2 decreased significantly upon incubation of the Hep-G2 cells with complex 1. The observed decrease was likely caused by the perturbation of the cell cycle and the observed cell cycle arrest at the S phase.50 Since the CDK activity can be controlled by a group of CDKIs, including p53, p21, and p27, we further examined the effect of complex 1 on the expression levels of these CDKIs. As shown in Fig. 10, compared with those of the negative control group, the expression levels of p21, p27, and p53 increased after the Hep-G2 cells were treated with complex 1. These results are consistent with the results of the cell cycle arrest study.
 |
| | Fig. 10 Changes in the expression levels of cell cycle regulators and CDKIs. (A) Western blotting analysis of the expression levels of cdc25 A, cyclin A, CDK2, p53, p21 and p27 in the Hep-G2 cells treated with complex 1 (6.5 μM) and cisplatin (6.5 μM), respectively, for 24 h. (B) Densitometric analysis of the western blot bands of cdc25 A, cyclin A, CDK2, p53, p21 and p27 with β-actin as an internal standard. The relative expression level of each protein is represented by the ratio between the density of the protein band and the density of the β-actin band. The mean SD was calculated from three independent measurements. | |
3. Experimental methods
3.1. Synthesis and characterization of [Rh(MQ)(DMSO)2Cl2] (1)
RhCl3 (0.1 mmol), H-MQ (0.1 mmol), 0.90 mL of CH3CN, and 0.1 mL of DMSO were placed into a thick Pyrex tube (ca. 25 cm in length). The tube containing the reaction mixture was quenched in liquid N2, degassed, and sealed. The reaction mixture was then heated to 80 °C and allowed to react for four days. The reaction product, [Rh(MQ)(DMSO)2Cl2] (1), was red brown crystals. Yield: 0.0423 g, 87%. Calculated element composition (%): C, 34.34; H, 4.13; N, 2.87. Experimental element composition: C, 34.30; H, 4.15; N, 2.80. Main IR peaks (KBr, cm−1): 3853, 3747, 3425, 3007, 2920, 1565, 1507, 1466, 1431, 1376, 1325, 1281, 1137, 1111, 1018, 975, 938, 876, 831, 758, 729, 681, 645, 523, 422. ESI-MS m/z = 590.07 ([Rh + MQ + Cl + DMSO + CH3CN + H2O]+). 1H NMR (500 MHz, DMSO-d6): 8.30 (d, J = 8.4 Hz, 1H), 7.44 (d, J = 8.4 Hz, 1H), 7.32 (t, J = 7.8 Hz, 1H), 7.07 (dd, J = 19.2, 7.7 Hz, 2H), 3.55 (s, 3H), 3.51 (s, 3H), 3.12 (s, 3H), 3.08 (s, 3H), 2.49–2.48 (m, 3H).
3.2. X-Ray crystallography
X-ray crystallographic data collection of single crystals of complex 1 was performed on a SuperNova CCD Area Detector equipped with graphite monochromated Mo-Kα radiation (λ = 0.71073 Å) at room temperature. The structure was solved by direct methods and refined using the SHELX-97 programs.51 The non-hydrogen atoms were located in successive difference Fourier synthesis. The final refinement was performed by full-matrix least-squares methods with anisotropic thermal parameters for non-hydrogen atoms on F2. The hydrogen atoms were added theoretically and riding on the concerned atoms. The parameters of data collection and refinements are summarized in Tables S1 and S2‡ together with the crystallographic data.
3.3. Materials, instruments, and other experimental methods
The materials, instrumentation, and protocols for the cell culture, MTT assay, cytotoxicity assay, fluorescence morphological examination, cell cycle analysis, apoptosis analysis, measurement of mitochondrial membrane potential, measurement of ROS generation, intracellular free Ca2+ detection, morphological characterization of cell apoptosis, and western blot analysis were reported in our previous work.52
4. Conclusions
In this paper, a rhodium(III) complex with 8-hydroxy-2-methylquinoline as the ligand, i.e., [Rh(MQ)(DMSO)2Cl2] (1), was synthesized and characterized. It exhibited high cytotoxicity against the tested tumor cell lines with IC50 values in the low micromolar range (6.52–28.13 μM) and relatively low cytotoxicity against the normal HL-7702 cell line. Notably, complex 1 displayed higher cytotoxicity against the Hep-G2 cell line than cisplatin. Further mechanistic studies demonstrated that complex 1 induced cell cycle arrest at the S stage in Hep-G2 cells, downregulated the expression of cdc25 A, cyclin A, cyclin B, and CDK2, upregulated the expression of p21, p27 and p53, and finally led to cell apoptosis. Cytotoxicity mechanism studies indicated that complex 1-induced apoptosis was likely caused by the disruption of the mitochondrial function, which led to a loss of the mitochondrial membrane potential and a series of apoptotic behaviors, including an increase of the cellular levels of ROS, cytochrome c, apaf-1, and bax, an increase of the intracellular Ca2+ level, etc. Taken altogether, complex 1 is a promising lead compound for anticancer drug development and it can induce apoptosis of tumor cells via disruption of the mitochondrial function.
Acknowledgements
This work was supported by the State Key Laboratory Cultivation Base for the Chemistry and Molecular Engineering of Medicinal Resources, Ministry of Science and Technology of China (CMEMR2014-B13), the Science and Technology Project of Hunan Province, China (No.2014FJ3012), the National Natural Science Foundation of China (Grants 21271051, 81473102, 21431001), IRT1225, CMEMR2012-A22, IRT-16R15, NNSF of Guangxi of China (2016GXNSFGA380005) and the Innovation Project of Guangxi Graduate Education (YCBZ2015024) as well as the “BAGUI Scholar” program of Guangxi Province of China.
Notes and references
- M. J. Clarke, F. Zhu and D. R. Frasca, Chem. Rev., 1999, 99, 2511–2534 CrossRef CAS PubMed.
- P. J. Dyson and G. Sava, Dalton Trans., 2006, 1929–1933 RSC.
- W. Liu and R. Gust, Chem. Soc. Rev., 2013, 42, 755–773 RSC.
- B. Rosenberg and L. Vancamp, Nature, 1969, 222, 385–386 CrossRef CAS PubMed.
- P. Saha, C. DescÔteaux, K. Brasseur, S. Fortin, V. Leblanc, S. P. Asselin and G. Bérubé, Eur. J. Med. Chem., 2012, 48, 385–390 CrossRef CAS PubMed.
- V. Hristo, S. M. Valiahdi, A. A. Legin, M. A. Jakupec, A. Roller, M. Galanski and K. K. Keppler, Eur. J. Med. Chem., 2011, 46, 5456–5464 CrossRef PubMed.
- E. Wong and C. M. Giandomenico, Chem. Rev., 1999, 99, 2451–2466 CrossRef CAS PubMed.
- M. A. Fuertes, C. Alonso and J. M. Pérez, Chem. Rev., 2003, 103, 645–662 CrossRef CAS PubMed.
- C. X. Zhang and S. J. Lippard, Curr. Opin. Chem. Biol., 2003, 7, 481–489 CrossRef CAS PubMed.
- S. H. Tian, F. M. Siu, S. C. F. Kui, C. N. Lok and C. M. Che, Chem. Commun., 2011, 47, 9318–9320 RSC.
- Y. Song, H. Xu, W. Chen, P. Zhan and X. Liu, Med. Chem. Commun., 2015, 6, 61–74 RSC.
- I. Cacciatore, C. Cornacchia, E. Fornasari, L. Baldassarre, F. Pinnen, P. Sozio, A. Di Stefano, L. Marinelli, A. Dean, S. Fulle, E. S. Di Filippo, R. M. L. La Rovere, A. Patruno, A. Ferrone and V. Di Marco, ChemMedChem, 2013, 8, 1818–1829 CrossRef CAS PubMed.
- K. E. S. Matlack, D. F. Tardiff, P. Narayan, S. Hamamichi, K. A. Caldwell, G. A. Caldwell and S. Lindquist, Proc. Natl. Acad. Sci. U. S. A., 2014, 111, 4013–4018 CrossRef CAS PubMed.
- L. B. O. Freitas, T. F. Borgati, R. P. Freitas, A. L. T. G. Ruiz, G. M. Marchetti, J. E. Crvalho, E. F. F. Cunha, T. C. Ramalho and R. B. Alves, Eur. J. Med. Chem., 2014, 84, 595–604 CrossRef CAS PubMed.
- X. Jia, F.-F. Yang, J. Li, J.-Y. Liu and J.-P. Xue, J. Med. Chem., 2013, 56, 5797–5805 CrossRef CAS PubMed.
- K. Sengupta, S. Chatterjee, D. Pramanik, S. G. Dey and A. Dey, Dalton Trans., 2014, 43, 13377–13383 RSC.
- V. Oliveri, A. Puglisi, M. Viale, C. Aiello, C. Sgarlata, G. Vecchio, J. Clarke, J. Milton and J. Spencer, Chem. – Eur. J., 2014, 19, 13946–13955 CrossRef PubMed.
- L. M. F. Gomes, R. P. Vieira, M. R. Jones, M. C. P. Wang, C. Dyrager, E. M. Souza-Fagundes, J. G. Da Silva, T. Storr and H. Beraldo, J. Inorg. Biochem., 2014, 139, 106–116 CrossRef CAS PubMed.
- L. Bica, J. R. Liddell, P. S. Donnelly, C. Duncan, A. Caragounis, I. Volitakis, B. M. Paterson, R. Cappai, A. Grubman, J. Camakris, P. J. Crouch and A. R. White, PLoS One, 2014, 9, e90070 CrossRef PubMed.
- J. Ceccom, F. Cosldan, H. Halley, B. Frances, J. M. Lassalle and B. Meunier, PLoS One, 2012, 7, e43105 CrossRef CAS PubMed.
- V. Core, S. Renaud, I. Cannie, K. Julienne, S. G. Gouin, O. Loreal, F. Gaboriau and D. Deniaud, Bioconjugate Chem., 2014, 25, 320–334 CrossRef PubMed.
- V. Oliveri, M. Viale, G. Caron, C. Aiello, R. Gangemi and G. Vecchio, Dalton Trans., 2013, 42, 2023–2034 RSC.
- V. Oliveri, M. Viale, C. Aiello and G. Vecchio, J. Inorg. Biochem., 2015, 142, 101–108 CrossRef CAS PubMed.
- Q. Tang, W.-X. Ni, C.-F. Leung, W.-L. Man, K. K.-K. Lau, Y. Liang, Y.-W. Lam, W.-Y. Wong, S.-M. Peng, G.-J. Liu and T.-C. Lau, Chem. Commun., 2013, 49, 9980–9982 RSC.
- C. M. Santos, S. Cabrera, C. Rios-Luci, J. M. Padron, I. L. Solera, A. G. Quiroga, M. A. Medrano, C. Navarro-Ranninger and J. Aleman, Dalton Trans., 2013, 42, 13343–13348 RSC.
- I. Correia, P. Adao, S. Roy, M. Wahba, C. Matos, M. R. Maurya, F. Marques, F. R. Pavan, C. Q. F. Leite, F. Avecilla and J. C. Pessoa, J. Inorg. Biochem., 2014, 141, 83–93 CrossRef CAS PubMed.
- S. Tardito, A. Barilli, I. Bassanetti, M. Tegoni, O. Bussolati, R. Franchi-Gazzola, C. Mucchino and L. Marchio, J. Med. Chem., 2012, 55, 10448–10459 CrossRef CAS PubMed.
- A. Barilli, C. Atzeri, I. Bassanetti, F. Ingoglia, V. Dall'Asta, O. Bussolati, M. Maffini, C. Mucchino and L. Marchio, Mol. Pharmaceutics, 2014, 11, 1151–1163 CrossRef CAS PubMed.
- L. Yang, J. Zhang, C. Wang, X. Qin, Q. Yu, Y. Zhou and J. Liu, Metallomic, 2014, 6, 518–531 RSC.
- M. Gobec, J. Kljun, I. Sosic, I. Mlinaric-Rascan, M. Ursis, S. Gobec and I. Turel, Dalton Trans., 2014, 43, 9045–9051 RSC.
- Y.-C. Liu, Z.-F. Chen, X.-Y. Song, Y. Peng, Q.-P. Qin and H. Liang, Eur. J. Med. Chem., 2013, 59, 168–175 CrossRef CAS PubMed.
- Z.-F. Chen, Y.-Q. Gu, X.-Y. Song, Y.-C. Liu, Y. Peng and H. Liang, Eur. J. Med. Chem., 2013, 59, 194–202 CrossRef CAS PubMed.
- Z.-F. Chen, Y. Peng, Y.-Q. Gu, Y.-C. Liu, M. Liu, K.-B. Huang, K. Hu and H. Liang, Eur. J. Med. Chem., 2013, 62, 51–58 CrossRef CAS PubMed.
- Z.-F. Chen, J.-H. Wei, Y.-C. Liu, M. Liu, Y.-Q. Gu, K.-B. Huang, M. Wang and H. Liang, Eur. J. Med. Chem., 2013, 68, 454–462 CrossRef CAS PubMed.
-
(a) Y.-C. Liu, J.-H. Wei, Z.-F. Chen, M. Liu, Y.-Q. Gu, K.-B. Huang, Z.-Q. Li and H. Liang, Eur. J. Med. Chem., 2013, 69, 554–563 CrossRef CAS PubMed;
(b) Y.-C. Liu, X.-Y. Song, Z.-F. Chen, Y.-Q. Gu, Y. Peng and H. Liang, Inorg. Chim. Acta, 2012, 382, 52–58 CrossRef CAS.
- H.-R. Zhang, Y.-C. Liu, T. Meng, Q.-P. Qin, S.-F. Tang, Z.-F. Chen, B.-Q. Zou, Y.-N. Liu and H. Liang, Med. Chem. Commun., 2015, 6, 2224–2231 RSC.
- Q.-P. Qin, Z.-F. Chen, J.-L. Qin, X.-J. He, Y.-L. Li, Y.-C. Liu, K.-B. Huang and H. Liang, Eur. J. Med. Chem., 2015, 92, 302–313 CrossRef CAS PubMed.
- K. H. Low, Z. X. Xu, H. F. Xiang, S. S. Y. Chui, V. A. L. Roy and C. M. Che, Chem. – Asian J., 2011, 6, 3223–3229 CrossRef CAS PubMed.
- M. Kato, Y. Ogawa, M. Kozakai and Y. Sugimoto, Acta Crystallogr., Sect. C: Cryst. Struct. Commun., 2002, 58, m147–m149 CrossRef.
- C.-Y. Yue, F.-L. Jiang, Y. Xu, D.-Q. Yuan, L. Chen, C.-F. Yan and M.-C. Hong, Cryst. Growth Des., 2008, 8, 2721–2728 Search PubMed.
- K. S. O. Ferraz, D. C. Reis, J. G. Da Silva, E. M. Souza-Fagundes, E. J. Baran and H. Beraldo, Polyhedron, 2013, 63, 28–35 CrossRef CAS.
- C.-H. Zhou and X. Zhao, J. Organometal. Chem., 2011, 696, 3322–3327 CrossRef CAS.
- B. Saha, A. Mukherjee, S. Samanta, S. Paul, D. Bhattacharya, C. R. Santra and P. Karmakar, Med. Chem. Commun., 2012, 3, 1393–1405 RSC.
- G.-H. Yao, L.-J. Ling, J.-F. Luan, D. Ye and P.-Y. Zhu, Int. Immunopharmacol., 2007, 7, 444–453 CrossRef CAS PubMed.
- D. Greena and G. Kroemerb, Trend. Cell. Biol., 1998, 8, 267–271 CrossRef.
- F. Carvallo-Chaigneau, C. Trejo-Solis, C. Gomez-Ruiz, E. Rodriguez-Aguilera, L. Macias-Rosales, E. Cortes-Barberena, C. Cedillo-Pelaez, I. Gracia-Mora, L. RuizAzuara, V. Madrid-Marina and F. Constantino-Casas, BioMetals, 2008, 21, 17–28 CrossRef CAS PubMed.
- X.-Z. Hu, Y. Xu, D.-C. Hu, Y. Hui and F.-X. Yang, Toxicol. Lett., 2007, 171, 19–28 CrossRef CAS PubMed.
- D. R. Laver, Biophys. J., 2007, 92, 3541–3555 CrossRef CAS PubMed.
- L. Busino, M. Donzelli, M. Chiesa, D. Guardavaccaro, D. Ganoth, N. V. Dorrello, A. Hershko, M. Pagano and G. F. Draetta, Nature, 2003, 426, 87–91 CrossRef CAS PubMed.
- J. W. Park, Y. J. Choi, M. A. Jang, Y. S. Lee, D. Y. Jun, S. I. Suh, W. K. Baek, M. H. Suh, I. N. Jin and T. K. Kwon, Cancer Lett., 2001, 163, 43–49 CrossRef CAS PubMed.
-
(a)
G. M. Sheldrick, SHELXTL-97, Program for refinement
of crystal structures, University of Göttingen, Germany, 1997 Search PubMed;
(b)
G. M. Sheldrick, SHELXS-97, Program for solution of crystal structures, University of Göttingen, Germany, 1997 Search PubMed.
-
(a) Q.-P. Qin, Z.-F. Chen, W.-Y. Shen, Y.-H. Jiang, D. Cao, Y.-L. Li, Q.-M. Xu, Y.-C. Liu, K.-B. Huang and H. Liang, Eur. J. Med. Chem., 2015, 89, 7787 CrossRef PubMed;
(b) H.-H. Zou, L. Wang, Z.-X. Long, Q.-P. Qin, Z.-K. Song, T. Xie, S.-H. Zhang, Y.-C. Liu, B. Lin and Z.-F. Chen, Eur. J. Med. Chem., 2016, 108, 112 CrossRef PubMed.
Footnotes |
| † The authors declare no competing interests. |
| ‡ Electronic supplementary information (ESI) available: Experimental section. CCDC No. 1498776 for complex 1 contains the supplementary crystallographic data for this paper. For ESI and crystallographic data in CIF or other electronic format see DOI: 10.1039/c6md00462h |
| § These authors contributed equally to this work. |
|
| This journal is © The Royal Society of Chemistry 2017 |
Click here to see how this site uses Cookies. View our privacy policy here. 
 a,
Hong
Liang
a and
Zhen-Feng
Chen
*a
a,
Hong
Liang
a and
Zhen-Feng
Chen
*a