
High-throughput metabolomics approach reveals new mechanistic insights for drug response of phenotypes of geniposide towards alcohol-induced liver injury by using liquid chromatography coupled to high resolution mass spectrometry†
Tianlei
Zhang
,
Aihua
Zhang
,
Shi
Qiu
,
Hui
Sun
,
Ying
Han
,
Yu
Guan
and
Xijun
Wang
*
Sino-US Chinmedomics Technology Cooperation Center, National TCM Key Laboratory of Serum Pharmacochemistry, Chinmedomics Research Center of State Administration of TCM, Laboratory of Metabolomics, Heilongjiang University of Chinese Medicine, Heping Road 24, Harbin, China. E-mail: xijunwangtcm@126.com; Fax: +86-451-82110818; Tel: +86-451-82110818
First published on 17th November 2016
Abstract
Alcohol-induced liver injury (ALD) shows obvious metabolic disorders, categorized by a wide range of metabolite abnormalities. High-throughput metabolomics technology appears to be an appropriate solution. In this study, a urine metabolic profile was assessed using a UPLC-Q-TOF/HDMS (liquid chromatography coupled to high resolution mass spectrometry) approach to investigate the underlying molecular mechanisms of ALD and the therapeutic effect of geniposide. The endogenous low-molecular-weight metabolites in the mouse model of ALD were observed and 48 specific biomarkers were identified. Geniposide was found to have a regulatory effect on 32 of them. Furthermore, targeted analysis of biomarkers showed clear separation between the model and geniposide treatment group. Fifteen biomarkers with high contribution to group differentiation were screened out. Also, a comprehensive analysis of a significant disturbance of multiple metabolic pathways indicated that geniposide could modify abnormal metabolism due to ethanol exposure, during which disorders relating to amino acid metabolism and the oxidative stress state could be alleviated. At the same time, accessory examinations, including plasma biochemical indicators and liver tissue pathological analysis, showed similar results. It was suggested that geniposide was effective as a hepatoprotective agent against ethanol-induced liver damage by re-balancing a wide range of metabolic disorders.
Introduction
Alcoholic beverages have been some of the most popular drinks in the world for thousands of years. It has been clearly confirmed that the metabolism of alcohol is harmful because during this progression a series of toxic substances are produced, but the elimination of them is difficult. A hangover is considered as one of the most common poisoning symptoms after drunkenness. Alcoholic liver disease (ALD) is a serious adverse consequence of excessive alcohol consumption. In most cases, it is not life-threatening. However, severe ALD is closely linked to hepatic fibrosis or “fatty liver”, and sometimes it even promotes liver cancer.1 Although the definite molecular mechanisms underlying ALD have not yet been entirely clarified, it is widely accepted that ALD mainly involves the systematic malfunction of metabolic pathways such as reactive oxygen species (ROS) stress, amino acid disorders and inflammatory reactions.2 Degeneration/necrosis of liver cells and hyperplasia of fibers can be found in the liver tissue of ALD patients in pathological tests. Disorders in clinical biochemistry indexes and symptoms in the nervous system could also be observed too, which indicate impairment of liver function and abnormalities in the central nervous system. Traditional medical measurement methods can only get us this far; deep understanding at the metabolic level is still poor.Metabolomics is a very useful tool in the profiling of low-molecular weight metabolites, which can reflect the state of biochemical networks. As is known, metabolites are a set of endogenous compounds produced by complex biochemical systems in vivo and significant changes in these substances can be observed under pathological conditions or with drug intervention. Recent progression in analytical techniques enables the accurate detection of a large amount of metabolites in a short period of time and comprehensive information of the metabolome from biosamples can be easily obtained from multivariate statistical analysis. Clinical diagnosis of ALD relies primarily on measurements of serum chemical parameters and histopathological analysis. But routine clinical examination of liver function based on serum, such as ALT and AST, is insensitive and laggard for early diagnosis. Serum chemical parameters elevate significantly only after substantial liver injury occurs. However, the application of the metabolomics approach has drawn wide attention in the field of disease diagnosis and drug effect evaluation since it allows the rapid identification of endogenous metabolites which directly reflect their biological state in vivo.3 The metabolites that are overproduced during ALD progression enter the urinary tract and be secreted into urine. For this reason, urine is an ideal source of biosamples to noninvasively characterize the condition of the liver.4 ALD specific biomarkers offer better test capability in clinical practice; also, these biomarkers may have additional links with other adverse outcomes.5 Deep level analysis of their endogenous production during pathogenesis offers a holistic overview of the integrated metabolic response of an organism to stimuli. It helps overcome limitations of traditional diagnosis and treatment systems.
Natural medicines are widely used for the prevention or treatment of various diseases.6 Geniposide belongs to the family of iridoid glycoside and it is the key component of Zhizi (Gardenia jasminoides Ellis), a famous traditional medicinal plant for the treatment of jaundice and liver disorders. It has been used for thousands of years (Chinese Pharmacopoeia Commission 2010) due to its extensive pharmacological activities. Also, based on our previous study on “Yinchenhao tang” (YCHT), one of the most important prescriptions in traditional Chinese medicine (TCM) that can be used for a variety of liver diseases, geniposide is the key pharmacodynamic base material of YCHT.7 However, the precise mechanism of geniposide towards ALD is still poorly understood and investigation is urgently needed. Thus, this study is aimed to fill this gap and uncover the potential mechanisms. Here in this article, an UPLC-Q-TOF-HDMS-based metabolomics approach integrated with a multivariate data program and pathway analysis was applied to investigate the ethanol-induced metabolomics disturbances in mice and the therapeutic effect of geniposide against ALD through the profiling of urinary metabolites.
Experimental methods
Reagents and assay kits
Absolute ethyl ethanol (analytically pure) was purchased from Beijing Chemical Works (Beijing, China). Methanol (high-performance liquid chromatography (HPLC) grade) was purchased from Fisher Scientific Corporation (Loughborough, UK); acetonitrile (ACN) (HPLC grade) was obtained from Merck (Darmstadt, Germany); formic acid was obtained from Honeywell Company (Morristown, New Jersey, USA); deionized water was purified by using a Milli-Q water ultra-pure water system (Millipore, Bedford, MA, USA) and used for the preparation of samples and the mobile phase; leucine enkephalin was purchased from Sigma-Aldrich (St. Louis, MO, USA). Geniposide (purify 99%) was purchased from the Tianjin Chemical Reagent Co. (Tianjin, China). Alanine aminotransferase (ALT) assay kit and aspartate aminotransferase (AST) assay kit were purchased from Biosino Company (Beijing, China); glutathione (GSH) assay kit, maleic dialdehyde assay (MDA) kit and alcohol dehydrogenase (ADH) assay kit were all purchased from Nanjing Jiancheng Biological Research Institute (Nanjing, China). All other reagents were of analytical grade.Animal experiments and sample collection
Male konmin mice (weighing 20 ± 2 g, 6–8 weeks of age) were purchased from the Shanghai Slac Experimental Animal Centre and housed in individual cages in a room with a 12 h light/dark cycle at a constant temperature of 24 ± 1 °C. A standard diet and water were freely given. Animal care and experimental procedures were approved by the Animal Care and Use Committee of Heilongjiang University of Chinese Medicine (HUCM-2014-05912) and conducted according to the principles expressed in the Declaration of Helsinki. All efforts were made to ameliorate the suffering of animals.After acclimatization in metabolism cages for one week prior to dosing, all mice were randomized into three groups with 6 mice in each as follows: a control group, model group and geniposide (Gen) group. A low ethanol concentration was not enough to generate qualitative lesions. In order to establish the model successfully and avoid the emergence of self-healing in the model group, we increased the concentration (60% v/v, 10 mL kg−1, equal to 4.896 g kg−1) of ethanol to simulate the drunken state of human. The mice in the model group and Gen group were orally administrated with 60% v/v ethanol (10 mL kg−1 body weight) once a day for 7 days to induce a liver injury model. The Gen group was administrated with 9 mg mL−1 geniposide solution (7 mL kg−1) once a day for the following 7 days. The control group was administrated the equivalent distilled water. The urine samples were collected daily (at 8:00 a.m.) at ambient temperature using mice metabolic cages every day and the cages and mice were corresponding one by one during the whole experiment period to avoid potential interferences. The volume range of urine was 500 μL–1.5 mL. All samples were then centrifuged at 13![[thin space (1/6-em)]](https://www.rsc.org/images/entities/char_2009.gif) 000 rpm at 4 °C for 10 min, after which the supernatants were transferred into a set of clean tubes and stored in liquid nitrogen until the metabolomics analysis. Fourteen urine samples were randomly selected from each group and mixed together as the “quality control” (QC) sample. The QC sample was used to optimize the conditions of UPLC-Q-TOF-HDMS, as it contained the most information of all the urine samples.
000 rpm at 4 °C for 10 min, after which the supernatants were transferred into a set of clean tubes and stored in liquid nitrogen until the metabolomics analysis. Fourteen urine samples were randomly selected from each group and mixed together as the “quality control” (QC) sample. The QC sample was used to optimize the conditions of UPLC-Q-TOF-HDMS, as it contained the most information of all the urine samples.
After the seven-day treatment course, the whole blood was collected from the orbital plexus 24 hours after the last administration and then left to clot at room temperature for 1 h. Blood samples were centrifuged at 3000 rpm, 4 °C for 10 min, then the serum were transferred into corresponding Eppendorf tubes and stored in liquid nitrogen for clinical biochemistry examinations with standard procedures. All animals were then sacrificed by cervical dislocation, after which their livers were obtained immediately and then divided into three parts for hematoxylin and eosin (H&E) staining, immunohistochemistry and TdT-mediated dUTP Nick-End Labeling (TUNEL) analysis.
Clinical biochemistry and histological morphology examinations
Clinical biochemistry analysis, including alanine aminotransferase (ALT), aspartate aminotransferase (AST), glutathione (GSH), maleic dialdehyde (MDA) and alcohol dehydrogenase (ADH), was conducted with standard methods. Obtained data were analyzed using the SPSS 19.0 software with a 2-tailed, 2-sample Student's t-test, and p < 0.05 was a reflection of statistical significance. The histological morphology examinations were done by the affiliated hospital of Heilongjiang University of Chinese Medicine. Microscopic examinations of H&E staining were conducted on the hepatic tissues of the control, model and Gen group. Image analysis was performed using Image-Pro Plus 5.0 software (Media Cybernetics, Bethesda, MD, USA). At the same time, activity of cysteinyl aspartate specific proteinase 3 (caspase-3), a marker undergoing apoptosis in cells, was detected by immunohistochemistry; TUNEL analysis was conducted to detect the distribution of apoptotic cells in the liver sections. Ten microscopic fields (200×) were observed for each section and were measured using a semi-quantitative scoring system. The results of caspase-3 and TUNEL were expressed as the surface density of positive cells. Obtained data above were analyzed using SPSS 19.0 software with 2-tailed, 2-sample Student's t-test, and p < 0.05 was a reflection of statistical significance.Metabolic profiling
Results and discussion
The ethanol gavage resulted in an obvious drunken state in the mice and provoked significant increases in serum levels of ALT, AST, ADH and MDA together with level decrease for GSH in model mice compared with the control groups. Treatment with geniposide effectively relieved all of the above mentioned imbalances, and significant differences were found on the indexes of AST, MDA and GSH compared with the model group (Fig. 1A). Histological analysis was performed in hepatic tissue from model group, control group and Gen group to examine the cytomorphology and cellular apoptosis of liver (Fig. 1C).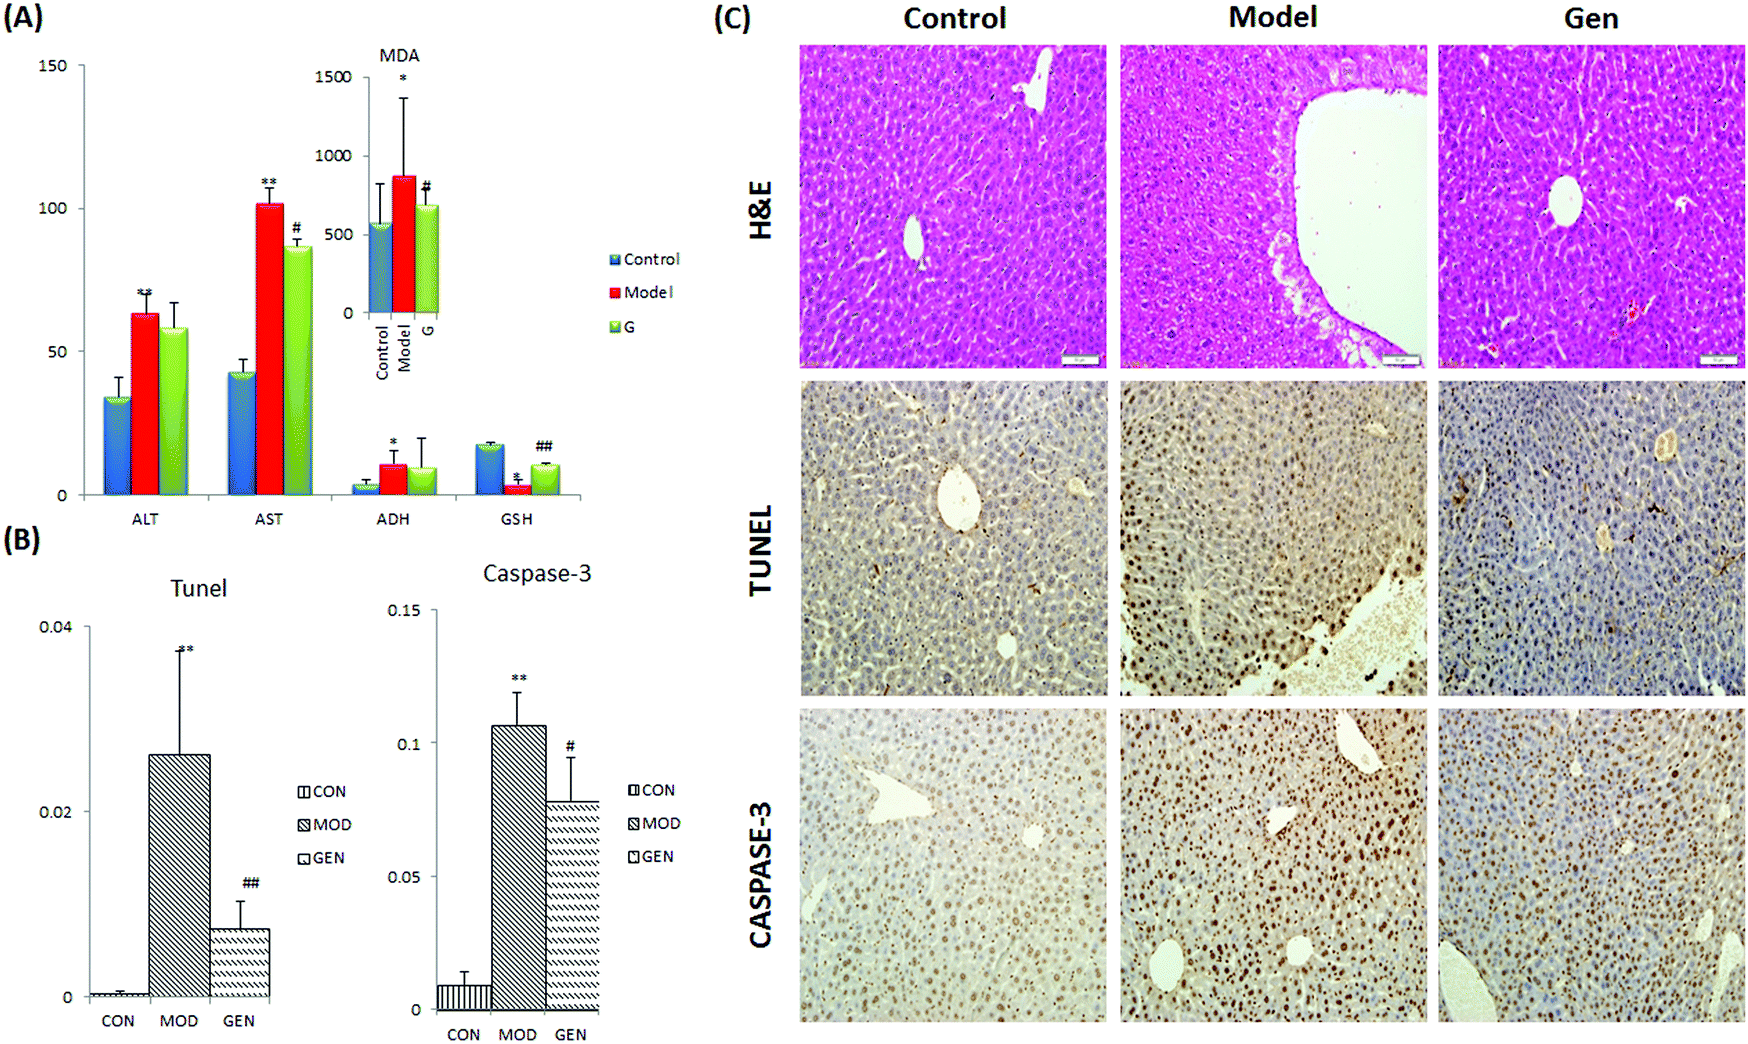 | ||
| Fig. 1 (A) The extent of liver injury and the therapeutic efficacy of geniposide were displayed in clinical biochemistry analysis: alcoholic liver injury resulted in significant increases in the serum level of ALT, AST, ADH and MDA together with a level decrease for GSH in model mice compared with the control groups. Geniposide effectively reversed all of the above mentioned abnormalities, and significant differences were found in the indexes of AST, MDA and GSH compared with the model group. (B) Area density of caspase-3 positive cells and apoptotic cells. The values are expressed as mean ± SD and were compared by Student's t-test. *p, 0.05; **p, 0.01; #p, 0.05, ##p, 0.01. (C) Representative photomicrographs of H&E staining specimens, caspase-3 and TUNEL assay (200×). H&E: liver tissue from the model group showed disorderly hepatocyte cords, severe fatty degeneration, spotty or focal necrosis and infiltration of inflammatory cells; hemorrhagic necrosis with foci of lymphomonocytic infiltration around fibrosis tissue can be seen. Immunohistochemistry: staining was positive for caspases-3 and TUNEL labeling (appearing brown) in liver sections. Observations indicated that the area density of positive cells was decreased by geniposide in both assays. | ||
Caspase-3 activity and the distribution of apoptosis liver cells were detected by using an immunohistochemistry method (Fig. 1C, TUNEL and CASPASE-3). As displayed in Fig. 1B, geniposide showed a significant regulation effect on caspase-3, the main executor caspase in apoptosis. The activity of caspase-3 was significantly elevated due to complex pathological changes induced by ethanol in the model group; while after treatment with geniposide, the activity of caspase-3 was significantly decreased. On the other hand, analyses of liver sections by the TUNEL assay clearly showed extensive apoptosis in model mice; likewise, geniposide could significantly reverse hepatocyte apoptosis. Observations indicated that the area density of positive cells was decreased by geniposide in both assays. These results suggest that the geniposide could improve liver tissue injury resulting from ethanol exposure and anti-apoptosis8 may play an important role in the liver-protective effect of geniposide.
The results of H&E staining (Fig. 1C, H&E) showed that hepatic tissue from the control group preserved the integrity of liver cell structure with neatly arranged hepatocytes. The structure of the liver lobule and sinusoid were clear, which were stained uniformly. No obvious inflammatory cells and swelling cells existed. On the contrary, disorders of hepatic sinuses and hepatic lobules were observed in the model group; necrosis of focal hepatocytes and infiltration of inflammatory cells were also found. Obvious hepatocyte swelling, vacuolization, and inflammatory cell infiltration were visible at the same time. On the other hand, geniposide showed a significant therapeutic effect on the injured liver: the degree of hepatocyte necrosis, portal inflammation and edema were minimized and minimal inflammatory cell infiltration was observed in the Gen group, which was comparable to normal liver histopathologically (Fig. 1C).
The methods of PCA, PLS and OPLS-DA are basic approaches which can be applied to intuitively embody the clusters of endogenous metabolites. The PCA method was introduced to distinguish and evaluate the status of each group. OPLS-DA and PLS-DA can remove some variations in the independent variables that are not related to the dependent variables, to reduce the complexity of the model and enhance the model forecast capability. The parameters of the model, such as R2Y (cum), Q2 (cum), and R2X (cum), were used to evaluate model quality. Furthermore, to identify the biomarkers and discriminate the metabolites, the OPLS-DA can clearly show the difference between the two groups. The OPLS-DA score plots (Comp1 R2X (cum) = 0.905509, Comp2 R2X (cum) = 0.905509 in positive mode and Comp1 R2X (cum) = 0.999239, Comp2 R2X (cum) = 0.999239 in negative mode) showed obvious reliability between the model group and the control group. PLS-DA model (Comp1 R2X (cum) = 0.978129, Comp2 R2X (cum) = 0.796399 in positive mode and Comp1 R2X (cum) = 0.952477, Comp2 R2X (cum) = 0.807364 in negative mode) was constructed to evaluate the degree of dispersion among the model group, control group and Gen group. The metabolites were further analyzed using web tools. Ultimately, 48 biomarkers were screened out and detailed information is summarized in Table S1 (ESI†).
In our study, the ALD model was established by intragastric administration with ethanol for 7 days to induce liver damage in mice. Significant behavioral differences were observed: after oral administration of ethanol, mice from model group showed biphasic responses with initially short excitation (restless and aggressive) and later inhibition (malaise and lethargy), and this transformation process may last several hours; however mice from the control group were active and healthy. The serum and liver tissue samples were examined to detect differences in clinical biochemistry indicators, tissue morphology and cell apoptosis among the control, model and Gen groups (Fig. 1). Ethanol significantly elevated the serum level of ALT, AST, MDA and ADH, and reduced the level of GSH, an important antioxidant that acts as a “free radical scavenger” in vivo, which suggested the occurrence of liver function damage, oxidative stress and lipid metabolism disorders. H&E staining observation of liver sections from the model group showed obvious pathological changes with swelling and focal necrosis of hepatic cells; while no significant abnormalities were observed in the liver tissues obtained from control mice. Furthermore, caspase-3 activity and the cell apoptosis were analyzed, and both of them were found to be much higher than the control group, which indicated significant apoptosis induced by ALD. However, after a 7 day treatment with geniposide, all the indicators had been reversed by varying degrees. It is known to us that the ALD model was successfully established and the hepatoprotective effect of geniposide was confirmed.
Urine metabolomics based on the UPLC-Q-TOF-HDMS was applied to reveal the underlying mechanisms of geniposide's hepatoprotective effect in ethanol-induced experimental liver damage. Metabolic profiling of urine samples was acquired by UPLC-HDMS in both positive and negative ion mode. To reveal the perturbation in the metabolome upon ALD modeling, orthogonal partial least square discrimination analysis (OPLS-DA), a supervised method, was constructed on the UPLC-MS dataset consisting of the control and model groups to examine group discrimination. Model and control groups could be separated completely in the OPLS-DA score plots (Fig. 2A and B), indicating significant metabolic variations between these two groups. High variation and prediction capability of the OPLS-DA model suggested that the models were valid and robust, implying that metabolic differences induced by pathological lesions played an important role in group separation.
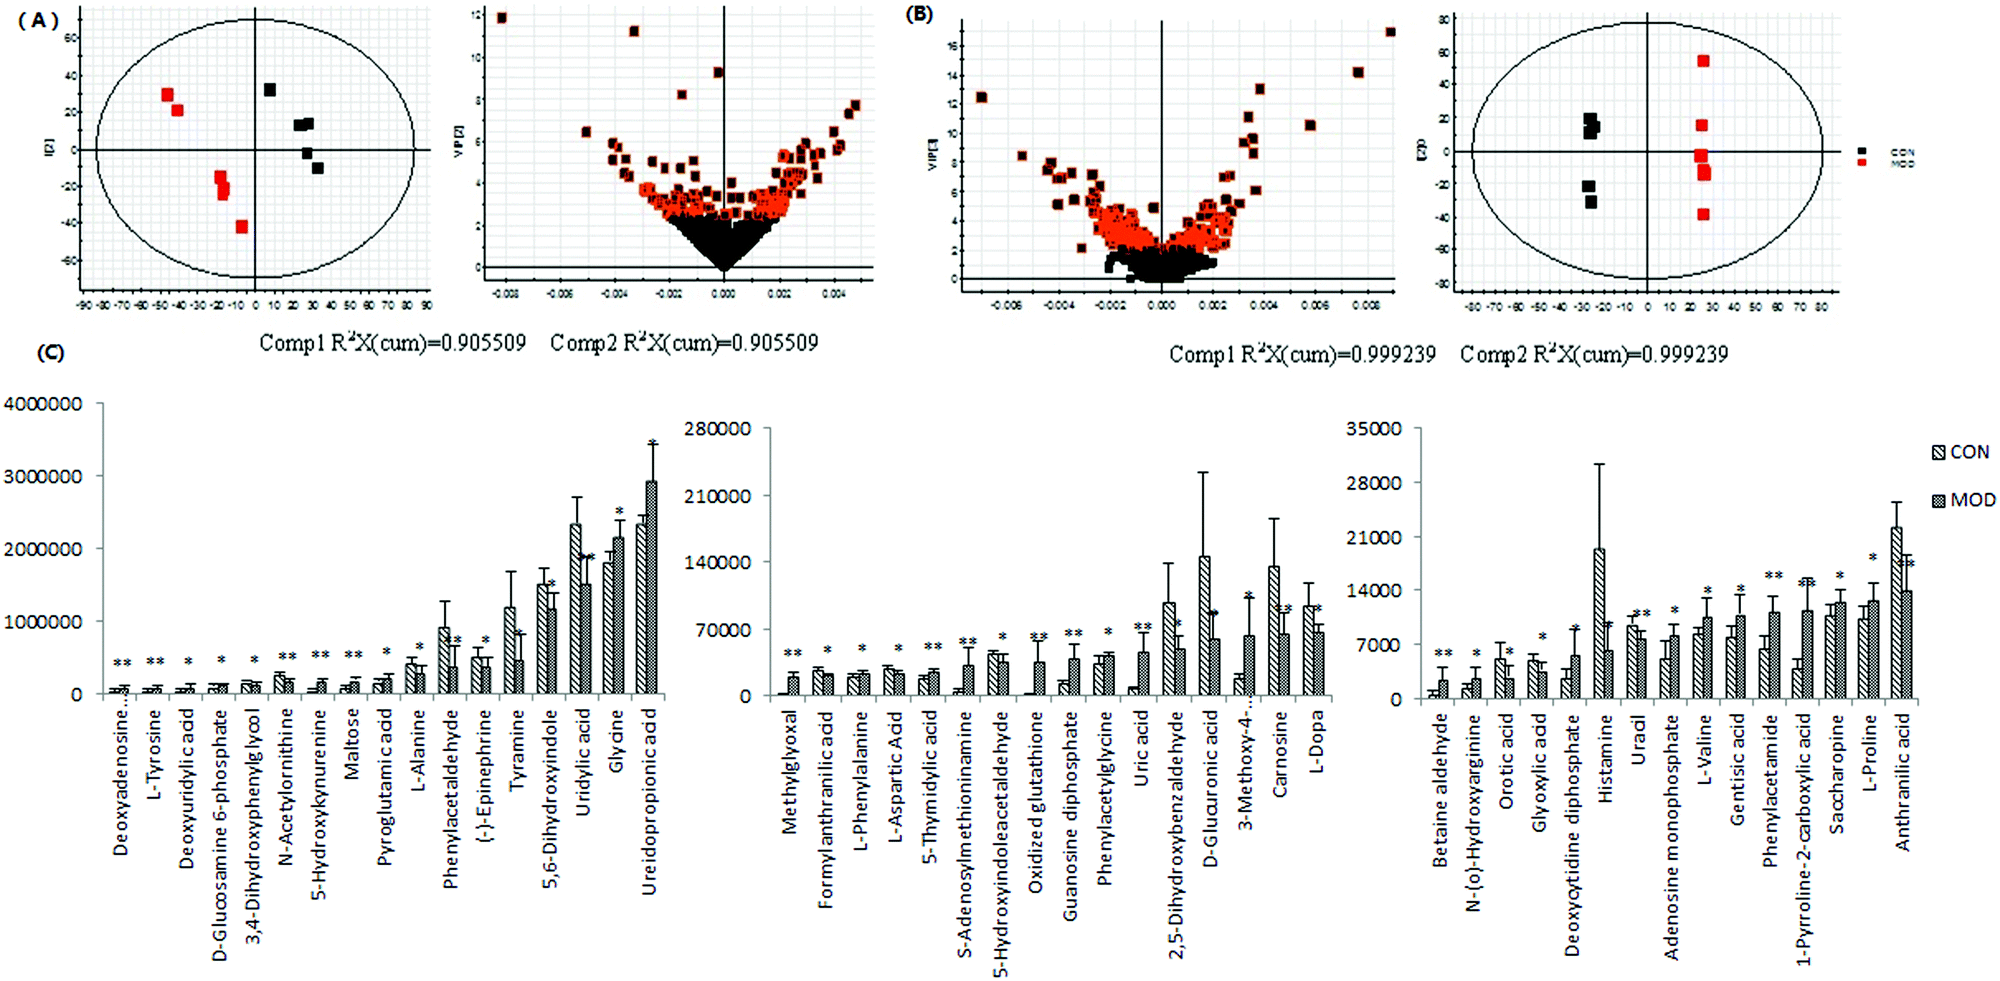 | ||
| Fig. 2 OPLS-DA and VIP score plots of control and model group in positive (A) and negative (B) mode. Histogram plots (C) show the relative signal intensities for marker metabolites for the control, model and Gen groups in the positive and negative mode. | ||
After multivariate statistical analysis, 48 biomarkers contributing to the metabolic differences between the control and model group were identified (Fig. 2C). These metabolites indicated that an abnormal metabolism occurred in the model animals. The ions identified by UPLC-MS are summarized in Table S1 (ESI†) with their corresponding retention time, m/z, ion mode and trends. In positive (Fig. 3A) and negative (Fig. 3B) mode, the PLS-DA score plots showed clustering of samples from all the three groups. Each point represented a rat urine metabolome. The spatial distance between data points indicated, to some degree, the scale of their metabolic differences. After the 7 day geniposide treatment, mice from Gen group exhibited different urine metabolic profiles compared with the model group. Samples from the Gen group were located in between the control and ALD model samples and a clear separation was observed in both score plots, suggesting that geniposide treatment reversed the changes in urine metabolites caused by ALD. Relationships of correlation matrix between clusters of 48 biomarkers using Pearson's linear correlation analysis, with the degree of change in control, Gen and model group, were shown in Fig. 4A. The color scale illustrated the magnitude and direction of correlation of these biomarkers among three groups. Red and blue indicated positive and negative correlations, respectively. The corresponding targeted PLD-DA was constructed based on these 48 biomarkers, which showed clear separation of the three groups (Fig. 4B). As shown in Fig. 4C the cluster diagram revealed that the three groups could be separated completely by these 15 metabolites with VIP scores >1.0. Geniposide showed a good regulatory effect on 11 out of those 15 (more than 73.33%) high contribution biomarkers, suggesting that the cluster separation is due to the therapeutic effect of geniposide (Fig. 5).
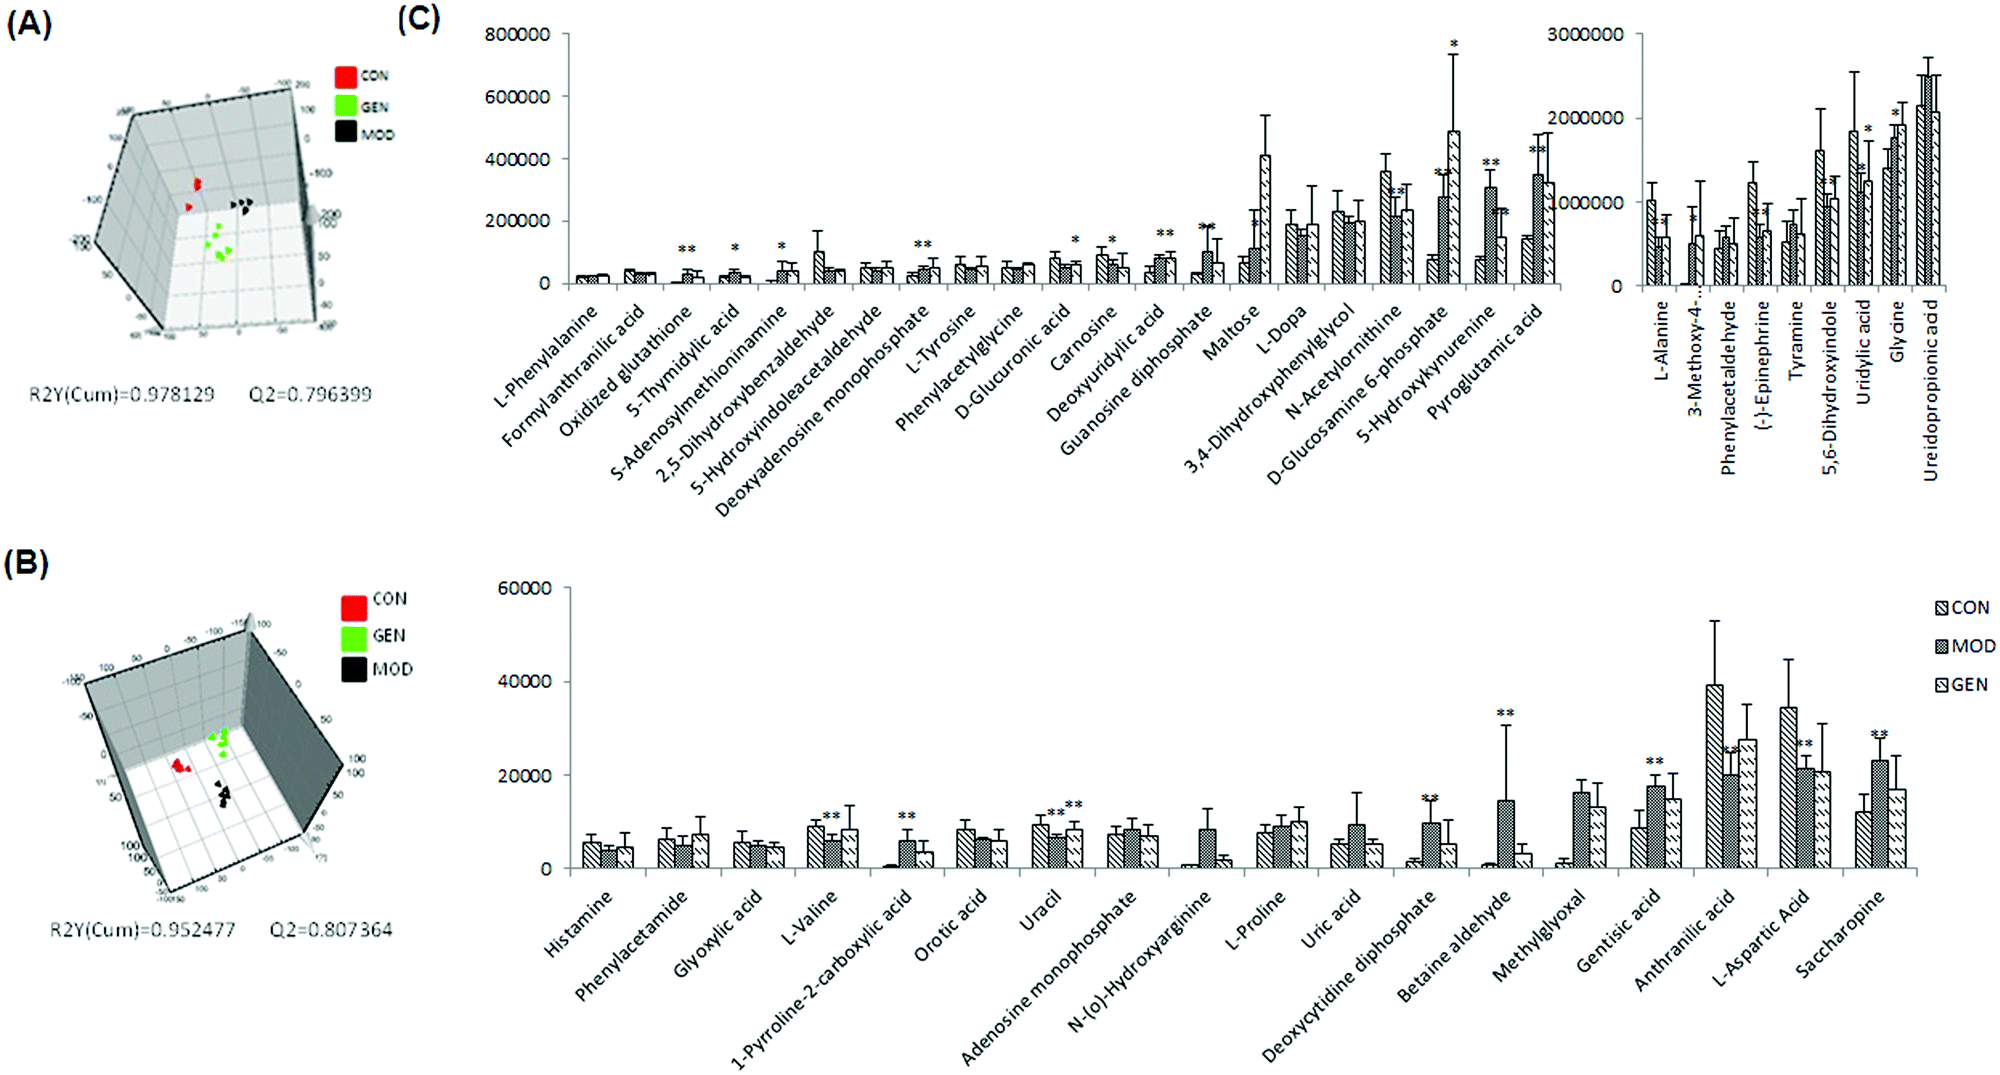 | ||
| Fig. 3 3D-PLS-DA score plots of control, model and Gen groups in positive (A) and negative (B) mode. Histogram plots (C) show the variations in the urine levels of the identified biomarkers in control, model and Gen groups. | ||
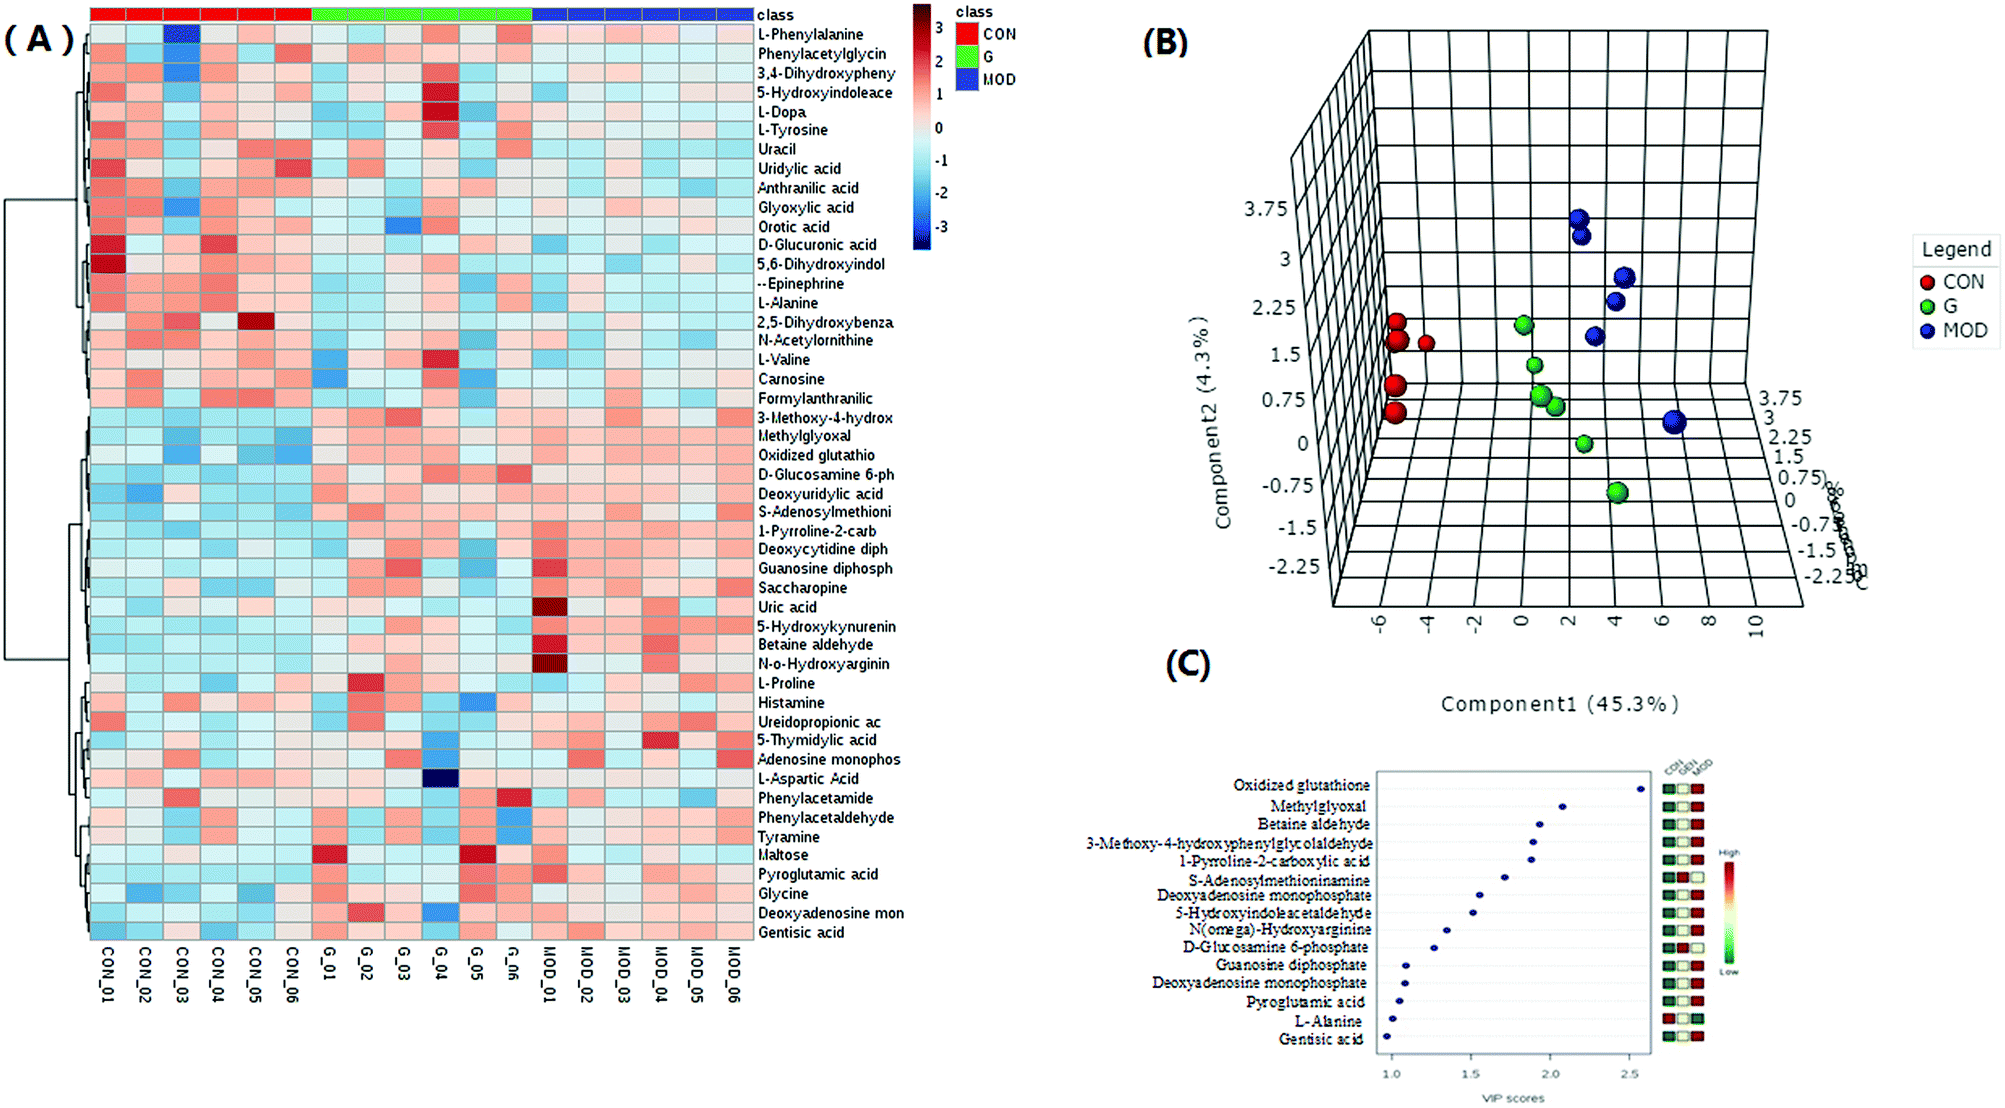 | ||
| Fig. 4 (A) Hierarchical clustering heat map and 3D-PLS-DA score plots (B) of the 48 differential metabolites, with the degree of change marked with colors including up-regulation (red) and down-regulation (blue). Columns represent individual experiments and rows represent each identified metabolites. (C) VIP scores with expression heat map from PLS-DA analysis. PLS-DA analysis was constructed with signature metabolites. Red, yellow and green indicated gradients, respectively. | ||
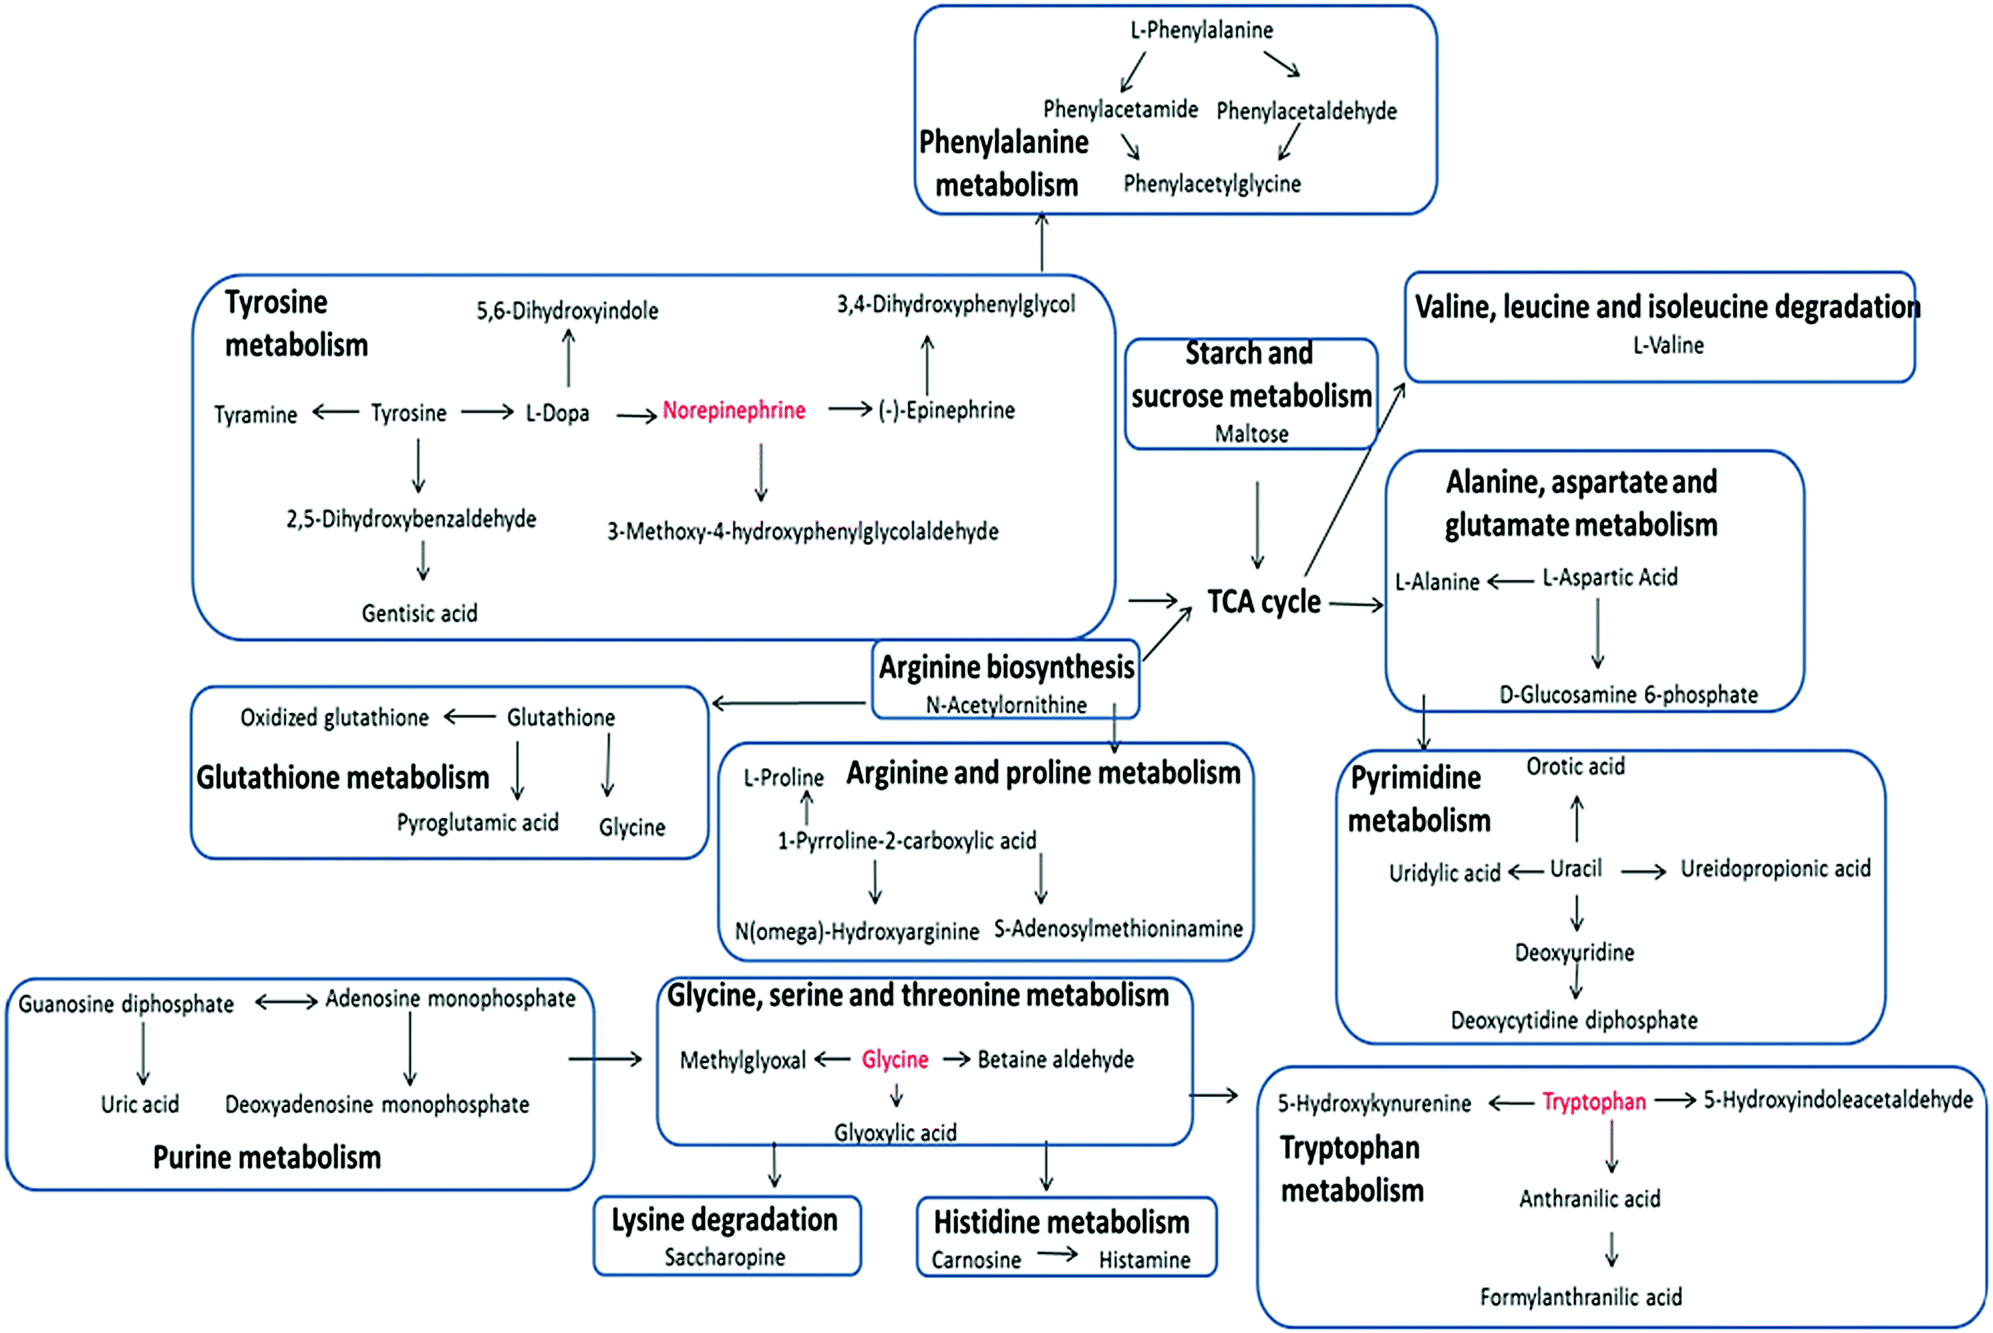 | ||
| Fig. 5 A schematic model that potential disturbed metabolic pathways. | ||
The liver is the most important organ in bio-metabolism, providing essential metabolic, exocrine and endocrine function.9 Therefore, metabolic disorders caused by liver disease are often extensive. Obvious disturbance of various endogenous metabolites could be detected in the metabolomics study. These biochemical changes were then interpreted with a combination of pathway analysis and published literature. Pathway analysis was conducted with by applying the MetPa software, a useful tool based on the high-quality KEGG metabolic pathways as the backend knowledge base, to clarify the most relevant pathways involved in a specific condition.10 Significant amino acid metabolic disorders, mainly including tyrosine metabolism, phenylalanine metabolism and tryptophan metabolism, were observed in the ALD network with higher scores. Obvious disturbances occurred during the pyrimidine metabolism, too, as detailed in Table S1 (ESI†). The results demonstrated that these pathways showed obvious perturbations over the time course of ethanol-induced liver injury and could contribute to disease progression. Geniposide showed protective effects on ALD by reversing most of the pathways mentioned above towards the control group.
ALD has become an important public health problem across the whole world. In recent years, more and more attention has been paid to the inner relationship between oxidative stress and pathological changes. Urine level of oxidized glutathione (GSSG) was much higher in the model group compared with the control group; however, the serum level of GSH was much lower in the model group in clinical chemistry analysis. GSSG is the oxidation product of GSH, which is a widely distributed free radical scavenger in vivo. And as a part of the pentose phosphate cycle, conversion of GSSG and GSH plays an important role in antioxidant.2 Glutathione accounts for the majority under physiological conditions; on the other hand, one of the most important characteristics of ethanolic liver disease is oxidative stress, which is believed to be responsible for the pathological changes in ALD.
Production of oxygen free radical (ROS) during the process of ethanol-induced liver injury is increased due to the promotion of mitochondrial respiratory chain circulation resulting from the reduction of the ratio of intracellular NAD/NADH. ROS can damage mitochondria by releasing cyt-C, a key apoptosis inducing factor in caspase activation, and overflow into the cytoplasm leading to peroxide damage in cells. Under normal physiological conditions, oxidative stress damage can be prevented by antioxidant defense substances like GSH and SOD. Antioxidant depletion resulting from excessive ROS accumulation could cause free radical damage and impairment of liver cell function. In our case, the reduction of the ratio of GSH/GSSG indicated decreased antioxidant capacity to some extent. Also, the serum level of MDA, an important indicator in the measurement of lipid peroxidation was significantly elevated in the model group, suggesting the accumulation of lipid peroxidation products result from oxidative stress. Additional evidence for this is the increased urine level of N(omega)-hydroxyarginine, a product of the arginine–nitric oxide pathway and it was the first intermediate in the process catalyzed by nitric oxide synthase. This should be the consequence of nitrification stress, which could be considered as NO-dependent oxidative stress. Furthermore, GSSG and N(omega)-hydroxyarginine were among the 15 high contribution biomarkers. And the VIP of GSSG was the highest of them. Methylglyoxal (MG), the second highest in the VIP scores of the 15 biomarkers, is a highly active two carbonyl compound, which is usually produced in the process of glucolysis, lipid peroxidation and threonine catabolism in vivo. Its accumulation is associated with various degenerative diseases, such as diabetes and arterial atherogenesis. The abnormally high level of methylglyoxal could cause the decline of mitochondrial function and the consumption of antioxidant enzymes, which could finally result in cytotoxicity in the liver. It is therefore reasonable to infer that MG should take some of the blame for the liver cell apoptosis, as described in the immunohistochemical analysis below.
The relationship between oxidative stress and liver damage is not only the direct damage of free radicals, but also the following cell apoptosis in liver tissue.11–15 Oxidative stress could cause the occurrence of hepatocyte apoptosis. Increasing attention has been paid to the role of apoptosis in ALD. It should be noted that the rate of apoptosis is closely associated with liver function. Therefore, anti-apoptosis is an effective strategy against ethanolic liver injury. In our study, the activity of caspase-3 was found to be significantly up-regulated and the further analysis of TUNEL indicated the widespread presence of apoptotic cells. The result of target prediction analysis (Table S2, ESI†) showed that Bcl-2 was one of the potential targets of geniposide. Bcl-2 could work as both an upstream regulator and downstream substrate of caspase-3 during the apoptosis process.16–18 Although we did not involve bcl-2 as one of our indicators, based on published documents and our experiment results, we can still reasonably infer that geniposide could reverse the abnormally high expression of caspase-3 through the regulation of bcl-2 and then cause restoration of the corresponding disordered pathway to normal levels.
The liver is the main site of amino acid metabolism, too. Generally speaking, when liver damage occurs, disorders of multi-amino acids metabolism can be significantly observed.19,20 In most cases, amino acid metabolism in liver cells is decreased resulting from impaired liver function, which led to the increase of amino acid concentration in the blood and even amino acids lost in urine. In our study, marked changes of amino acids, including phenylalanine, tyrosine, glycine, proline, valine, alanine and aspartate, were detected and most of them were significantly elevated in urine from the model group compared with the control group. In our study, the urine level of phenylalanine, tyrosine, glycine, valine and proline was much higher in the model group compared with the control group. Increased excretion of amino acids can also result in nutritional disorders, especially protein imbalance. As a raw material for the synthesis of GSH, accelerated metabolism of glycine was partly responsible for a decrease of GSH. Actually, as described in Table S1 (ESI†), most of the biomarkers were identified as metabolic intermediate substances involved in amino acid metabolism, which indicated that severe metabolic disorders occurred. These findings point to the participation of altered amino acid metabolism in the pathogenesis of ALD.21–23 Disorders in purine and pyrimidine metabolism were observed, too, suggesting that in the pathological process of ALD, the enzyme system was damaged due to hepatocyte injury. It is worth noting that the disorder of phenylalanine metabolism and tyrosine metabolism of the model mice directly led to abnormal urine levels of phenylacetaldehyde, phenylacetamide, dopa and epinephrine, which is an important sympathetic neurotransmitter in vivo. The decrease in urine levels of dopa and epinephrine was likely the consequence of the retention of sympathetic neurotransmitters in the blood. It is acknowledged that autonomic nerves play an important role in liver function, and sympathetic nerves are the main component of them. In fact, studies have shown that sympathetic nerve stimulation can aggravate the degree of liver injury by regulating the release of pro-inflammatory cytokines and the activity of Kupffer cells.24,25 The elimination of inflammation is important for the treatment of liver injury.
The results of potential targets and impacted signaling pathways of geniposide are displayed in Table S2 (ESI†). Seven potential target proteins were found in the target prediction analysis based on the network database, including glucagon, Bcl-2, hemeoxygenase 1, glutathione S-transferase Mu 1 (GSTM1), glutathione S-transferase Mu 2 (GSTM2), neuromodulin and phospholipase B1. Glutathione-S-transferases (GSTs) are key phase II detoxifying enzymes that play critical roles in protection against products of oxidative stress and against electrophiles by catalyzing the biological transformation of GSH in liver. It is one of the most important detoxification systems in liver. Combined with the above mentioned research results, it is evident that GSTs are one of the key molecular targets of the liver protective effect of geniposide. Over the course of treatment, the protection of oxidative stress and lipid peroxidation damage was determined greatly through the effect of geniposide on these enzyme activities. The impacted signaling pathways of these proteins were then found. A high correlation was found between these signaling pathways and some of the identified biomarkers. According to a biological significance analysis of key metabolites, 5 major relative signaling pathways, including neuroactive ligand–receptor interaction, apoptosis, hepatitis B, oxidative stress and NRF2 pathways were found to be involved in the underlying molecular mechanisms of the hepatoprotective effect of geniposide.
In summary, the liver is the major metabolic organ for ethanol but also the main target organ for alcoholic toxicity. Long-term and heavy drinking can lead to ALD, causing significant health burdens personally and socially. Studies of the endogenous protective mechanisms of active ingredients from TCM for liver protection against alcoholic liver injury is worthy of our attention. Our experiments demonstrated that, compared with the ALD model group, the geniposide-treated group showed a great improvement in clinical biochemical indicators and liver histology. Geniposide alleviated ethanol exposure-induced liver injury by ameliorating ethanol-induced increases in ALT, AST, MDA and ADH levels, and decreases in GSH content in serum. Moreover, geniposide showed a significant ability to resist apoptosis, supporting by reversing the overexpression of caspase-3 and decreasing area density of TUNEL positive cells. For addressing the mechanism of geniposide on ethanol-induced liver injury, a UPLC-Q-TOF-HDMS based analysis was applied to reveal the therapeutic effect of geniposide on the levels of the metabolome, thus exploring the key molecular mechanisms that underlie its hepatoprotective effect. Collectively, the results indicated that geniposide remarkably improved ethanol-induced liver injury by attenuating oxidative stress and rebalancing the disordered liver enzyme system, during which the disturbance of metabolism, including multiple amino acid metabolism, purine and pyrimidine metabolism, was corrected. OPLS-DA revealed an evident separation between the model and control samples; while after geniposide treatment, a clear separation among all three groups was observed and the Gen group was located in between the control and ALD model groups, suggesting an obvious recovery of metabolic abnormalities. After a joint analysis of biomarkers and clinical chemistry, it was confirmed that geniposide could reduce oxidative stress, which is evaluated by the decline of MDA levels and the rise of GSH/GSSG. Recent evidence shows that enhancing anti-oxidative activities by supplementing with antioxidants could effectively relieve alcoholic liver injury. Actually, antioxidants have been used in the treatment of ALD in some cases. The abnormal behavior of sympathetic neurotransmitters, such as epinephrine, can be corrected by geniposide treatment, too. In summary, these results indicated that geniposide effectively alleviated liver injury through anti-oxidative, anti-inflammatory and anti-apoptotic activities in mice exposed to ethanol. The pathogenesis of ALD is very complex, and the target point of geniposide is also vary wide; however, our metabolomics-based study provided novel insight about the effects and mechanisms of geniposide on ethanol-induced liver injury.
Competing financial interests
The authors declare no competing financial interests.Acknowledgements
This work was supported by grants from the Key Program of Natural Science Foundation of State (Grant No. 81430093, 81173500, 81373930, 81302905, 81102556, 81202639), the National Key Subject of Drug Innovation (Grant No. 2015ZX09101043-005, 2015ZX09101043-011), the Fund Project of Heilongjiang Provincial Department of Education (Grant No. 12521498), the Natural Science Foundation of Heilongjiang Province of China (H2015038), and the Youth Innovative Talent Program of Heilongjiang Province of China (UNPYSCT-2015118).References
- J. Liu, et al., The effects of insulin pre-administration in mice exposed to ethanol: alleviating hepatic oxidative injury through anti-oxidative, anti-apoptotic activities and deteriorating hepatic steatosis through SRBEP-1c activation, Int. J. Biol. Sci., 2015, 3, 569–586 CrossRef PubMed.
- X. Gao, et al., Systematic variations associated with renal disease uncovered by parallel metabolomics of urine and serum, BMC Syst. Biol., 2012, 6(suppl 1), S14 CrossRef CAS PubMed.
- T. Zhang, et al., Current Trends and Innovations in Bio-Analytical Techniques of Metabolomics, Crit. Rev. Anal. Chem., 2016, 46, 342–351 CrossRef CAS PubMed.
- A. Zhang, et al., Urinary metabolic profiling of rat models revealed protective function of scoparone against alcohol induced hepatotoxicity, Sci. Rep., 2014, 4, 6768 CrossRef PubMed.
- X. Wang, et al., Metabolomics and Proteomics Annotate Therapeutic Multiple Perturbed Pathways, PLoS One, 2013, 8, e71403 CAS.
- A. Zhang, et al., High resolution metabolomics technology reveals widespread pathway changes of alcoholic liver disease, Mol. BioSyst., 2016, 262–273 RSC.
- H. Dong, et al., Ingenuity pathways analysis of urine metabolomics phenotypes toxicity of Chuanwu in Wistar rats by UPLC-Q-TOF-HDMS coupled with pattern recognition methods, Mol. BioSyst., 2012, 1206–1221 RSC.
- S. Patel and S. Ahmed, Emerging field of metabolomics: big promise for cancer biomarker identification and drug discovery, J. Pharm. Biomed. Anal., 2015, 107, 63–74 CrossRef CAS PubMed.
- A. Zhang, et al., Metabolomics study on the hepatoprotective effect of scoparone using ultra-performance liquid chromatography/electrospray ionization quadruple time-of-flight mass spectrometry, Royal Society of Chemistry, 2013, vol. 7, pp. 353–361 Search PubMed.
- A. Halama, Metabolomics in cell culture – a strategy to study crucial metabolic pathways in cancer development and the response to treatment, Arch. Biochem. Biophys., 2014, 100–109 CrossRef CAS PubMed.
- E. S. Johnson, et al., Metabolomic Profiling Reveals a Role for Caspase-2 in Lipoapoptosis, J. Biol. Chem., 2013, 14463–14475 CrossRef CAS PubMed.
- O. A. Aboud, et al., Inhibition of PPARa Induces Cell Cycle Arrest and Apoptosis, and Synergizes with Glycolysis Inhibition in Kidney Cancer Cells, PLoS One, 2013, 8, e71115 Search PubMed.
- A. Irfan, et al., Assessment of temporal dose-toxicity relationship of fumed silica nanoparticle in human lung A549 cells by conventional cytotoxicity and 1H-NMR-based extracellular metabolomic assays, Toxicol. Sci., 2014, 138, 354–364 CrossRef CAS PubMed.
- A. Irfan, et al., Metabolite profiling reveals new insights into the regulation of serum urate in humans, Metabolomics, 2014, 141–151 Search PubMed.
- M. Zhou, et al., Transcriptomic and metabonomic profiling reveal synergistic effects of quercetin and resveratrol supplementation in high fat diet fed mice, J. Proteome Res., 2012, 4961–4971 CrossRef CAS PubMed.
- T. Luedde, et al., NF-κB in the liver—linking injury, fibrosis and hepatocellular carcinoma, Nat. Rev. Gastroenterol. Hepatol., 2011, 108–118 CrossRef CAS PubMed.
- A. Pellicoro, et al., Liver fibrosis and repair: immune regulation of wound healing in a solid organ, Nat. Rev. Immunol., 2014, 181–194 CrossRef CAS PubMed.
- L. Gao, et al., Caveolin-1 is essential for protecting against binge drinking-induced liver damage through inhibiting reactive nitrogen species, Hepatology, 2014, 687–699 CrossRef CAS PubMed.
- X. Wang, et al., Urine metabolomics analysis for biomarker discovery and detection of jaundice syndrome in patients with liver disease, Mol. Cell. Proteomics, 2012, 370–380 CAS.
- M. Saito, et al., The serum level of NX-DCP-R, but not DCP, is not increased in alcoholic liver disease without hepatocellular carcinoma, Cancer Biomarkers, 2016, 16, 171–180 CrossRef CAS PubMed.
- S. Harada, et al., Metabolomic profiling reveals novel biomarkers of alcohol intake and alcohol-induced liver injury in community-dwelling men, Environ. Health Prev. Med., 2016, 18–26 CrossRef CAS PubMed.
- X. Shi, et al., Hepatic and fecal metabolomic analysis of the effects of Lactobacillus rhamnosus GG on alcoholic fatty liver disease in mice, J. Proteome Res., 2015, 1174–1182 CrossRef CAS PubMed.
- S. K. Manna, et al., Application of mass spectrometry-based metabolomics in identification of early noninvasive biomarkers of alcohol-induced liver disease using mouse model, Adv. Exp. Med. Biol., 2015, 217–238 CrossRef.
- P. Stiuso, et al., Serum oxidative stress markers and lipidomic profile to detect NASH patients responsive to an antioxidant treatment: a pilot study, Oxid. Med. Cell. Longevity, 2014, 2014, 169216 CrossRef PubMed.
- S. Forcisi, et al., Solutions for low and high accuracy mass spectrometric data matching: a data-driven annotation strategy in nontargeted metabolomics, Anal. Chem., 2015, 8917–8924 CrossRef CAS PubMed.
Footnote |
| † Electronic supplementary information (ESI) available. See DOI: 10.1039/c6mb00742b |
| This journal is © The Royal Society of Chemistry 2017 |