
Modeling ion permeation through a bacterial voltage-gated calcium channel CaVAb using molecular dynamics simulations†
Jamal
Adiban
a,
Yousef
Jamali
b and
Hashem
Rafii-Tabar
*a
aDepartment of Medical Physics and Biomedical Engineering, Faculty of Medicine, Shahid Beheshti University of Medical Sciences, Tehran, Iran. E-mail: rafii-tabar@nano.ipm.ac.ir; Fax: +98 21-22439941; Tel: +98 21-22439941
bDepartment of Applied Mathematics, School of Mathematical Sciences, Tarbiat Modares University, Tehran, Iran
First published on 5th December 2016
Abstract
Activation of voltage-gated calcium channels by action potentials leads to the influx of Ca2+ ions. In this study, the ion permeation characteristics in bacterial voltage-gated calcium (CaVAb) channels were investigated using molecular dynamics simulations. Furthermore, the potential of mean force (PMF) calculations was evaluated to determine the free energy profile for the permeation of cations (Ca2+ and Na+) and anions (Cl−) in the CaVAb channel. The results showed that both Ca2+ and Na+ cations experienced a deep energy well, while the Cl− anion experienced a relatively high energy barrier at the center of the selectivity filter (site 2). Consistent with the experimental data, the results obtained from this study demonstrate that sites 2 and 3 displayed the highest and lowest affinities to Ca2+, respectively. These findings also indicate that Na+ can easily and quickly pass through the CaVAb channel in the absence of Ca2+, while Cl− ions lack this ability.
1. Introduction
Ion channels are pores in cell membranes that allow for the passive diffusion of ions. The channels often contain a highly selective transport system for particular ions, permitting individual ions to move due to the concentration gradient.1Voltage-gated calcium (CaV) channels, in response to action potentials, are activated in a variety of cell types, leading to the influx of calcium (Ca2+) ions. These ions act as secondary messengers in electrical signaling, promoting a number of different cellular events.2 Ca2+ signaling occurs in the entire life-history of an organism. It is widely believed that life begins with a sudden onset of Ca2+ during fertilization. This multifunctional system continues to control a wide variety of processes during development and adult life. In addition to fertilization, Ca2+ ions play an important role in gene expression, apoptosis, as well as cell proliferation and differentiation.3
A fundamental problem in the analysis of ion conduction through cell membrane channels is to find out how the channels can be highly selective and can simultaneously conduct millions of ions per second. Ca2+ ions pass through CaV channels at a rate of 106 per second, while Na+ conductance is approximately lower by 500-fold.4 Because the extracellular Na+ concentration is 70-fold higher than that of Ca2+, calcium channels need to be highly selective for Ca2+ over Na+, notwithstanding the fact that these two ions are roughly similar in size, each about 2 Angstroms in diameter. It is proposed that the ion selectivity of the CaV channel results from the high-affinity of Ca2+ binding to the selectivity filter, which prevents the influx of Na+. The rapid flow of the Ca2+ flux through the CaV channels seems to employ a knock-off mechanism in which the electrostatic repulsions between the Ca2+ ions in the selectivity filter overcome the strong binding of a single Ca2+ ion. Ionic repulsions between the adjacent Ca2+ ions at these sites allow rapid conduction despite the intrinsic high affinity for Ca2+ binding.4,5
CaV channels consist of a single ion-selective pore within the central part of four identical subunits. The central pore consists of two transmembrane sections S5 and S6, together with an interposing ‘pore (P)-loop’ from each domain in a four-fold pseudosymmetrical arrangement. Four voltage sensing modules, comprising S1–S4 transmembrane helices, are symmetrically organized around the central pore (Fig. 1a). CaV channels, closely related to voltage-gated Na+ (NaV) channels, are known to be members of the voltage-gated ion channel superfamily.6–8
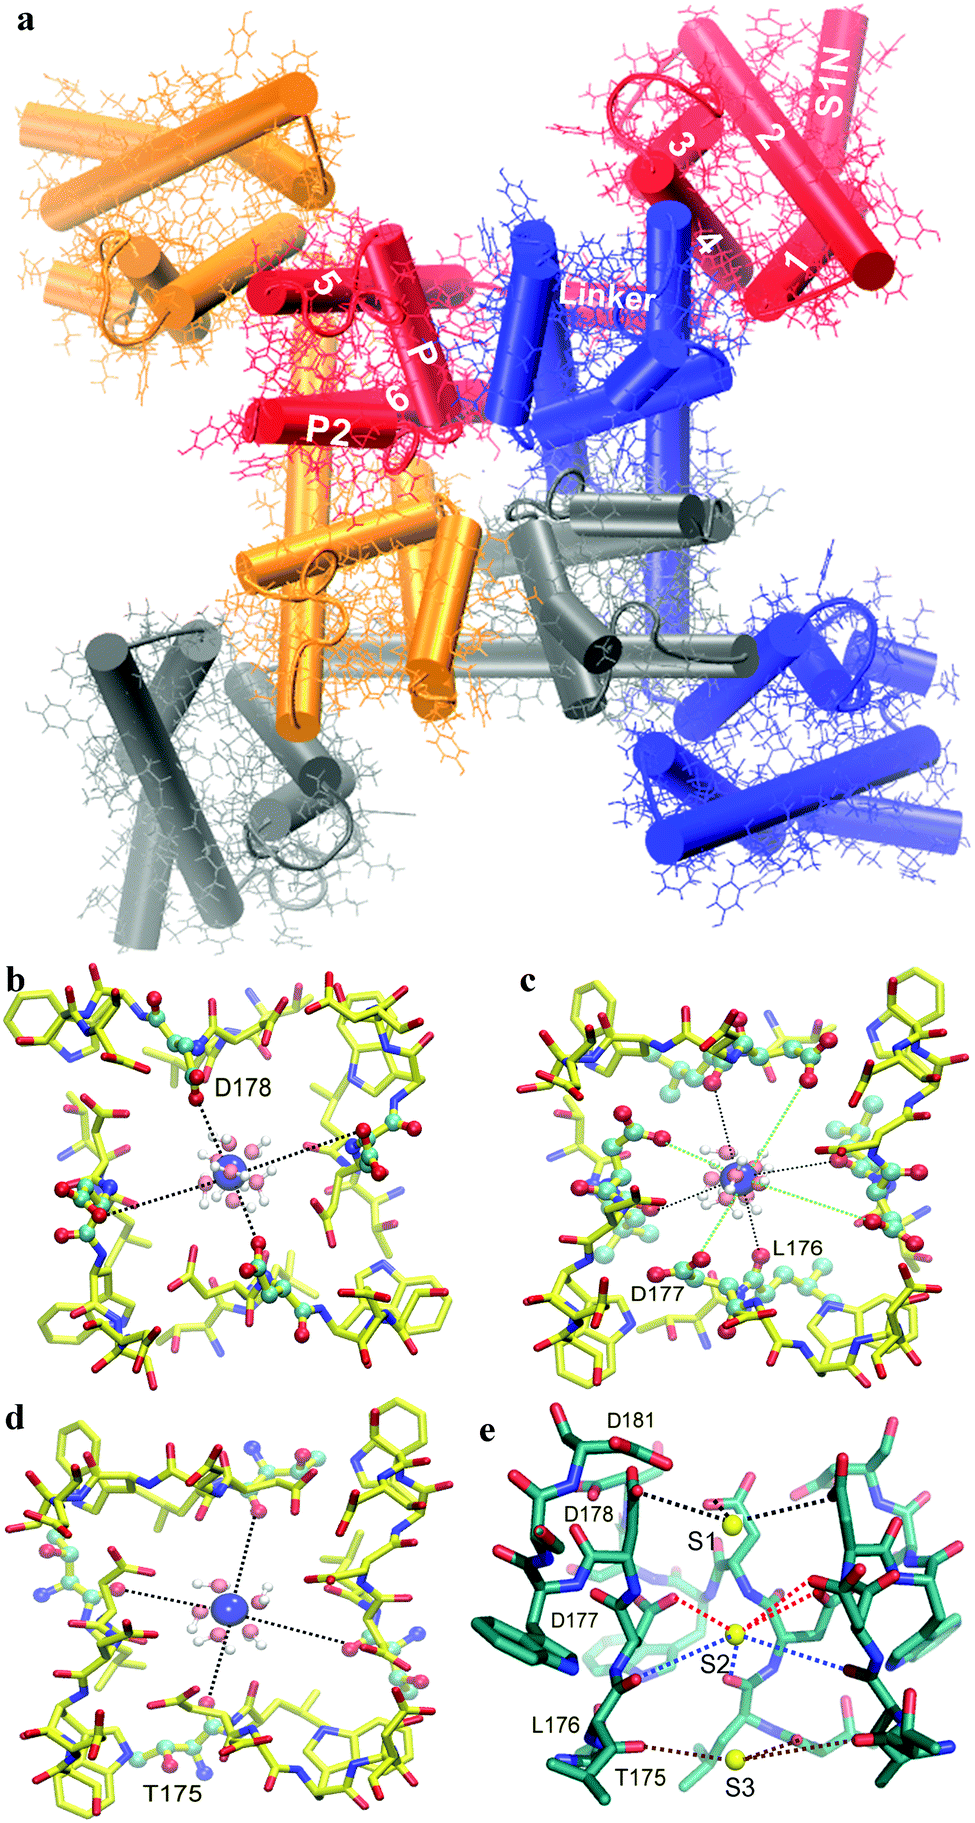 | ||
| Fig. 1 (a) Top view of the CaVAb channel structure. The structure of the transmembrane domain of a CaVAb channel with four subunits represented by different colors. The 1–6, transmembrane segments S1–S6 subunits are highlighted in white. Ca2+ binding sites in the selectivity filter of the CaVAb channel. The top view of binding site 1 (b), site 2 (c) and site 3 (d) in the selectivity filter. A symmetry-related backbone is shown by the yellow stick representation; the selected residues (D178, D177, L178 and T175) in the selectivity filter, Ca2+ ions and water molecules are illustrated in CPK, blue spheres as well as red and white CPK spheres, respectively. The interaction between Ca2+ and oxygen atoms is indicated by dashed lines for site 1 (black lines), site 2 (black and green lines) and site 3 (black lines). (e) Side view of the selectivity filter. The backbone and Ca2+ ions are shown in a green stick format and yellow spheres, respectively. The interaction between Ca2+ and oxygen atoms is indicated by dashed lines for site 1 (black lines), site 2 (red and blue lines) and site 3 (brown lines). For clarity, the subunit closest to the viewer is not shown. Graphics were rendered with VMD.38 | ||
An NaV channel from Arcobacter butzleri (NaVAb) has four pore motifs (175TLESWSM181), forming the ion selectivity filter.6 To make a CaVAb channel, the amino acids E177, S178 and M181 of the selectivity filter in the NaVAb channel (PDB code: 3RVY) are replaced by aspartic acid (Asp or D) (175TLDDWSD181). Unlike NaVAb that does not conduct extracellular Ca2+ ions, CaVAb mediates the influx of Ca2+ ions into the cells in a voltage-dependent fashion. The Ca2+ selectivity of CaVAb is primarily determined by the side chains of the amino acids in the selectivity filter.9
In the selectivity filter of CaVAb (175TLDDWSD181), there are three binding sites from the extracellular side to the intracellular side, including sites 1, 2 and 3 (Fig. 1e).9 At site 1, Ca2+ is surrounded by carboxyl groups of D178 located at the outer entrance to the selectivity filter. Further into the pore, there are four acidic side chains of D177 in the wall of the selectivity filter, as well as four side chains of L176 below, leading to the creation of site 2. Unlike site 1, the central Ca2+-binding site (site 2) is surrounded by four carboxylate oxygen atoms of D177 above and four backbone carbonyl oxygen atoms of L176 below. The third Ca2+ binding site (site 3) is located on the intracellular side of the pore, composed of four carbonyl oxygen atoms of L176 (Fig. 1). In CaVAb, permeating ions mainly interact with the amino acid side chains and backbone carbonyl groups in the ion selectivity filter through bound hydration water.9
Some theoretical models have been proposed to describe the mechanism of ion selectivity and conductance in Ca2+ channels.10–12 Although these models provide helpful insights into how Ca2+ channels may obtain high-throughput selectivity profiles, they are incapable of relating the structural parameters of the channel to its functional elements.13
The first attempt to determine the relationship between the observed functional properties of the Ca2+ channel and its structure, and to calculate the channel conductance, was made using the Poisson–Nernst–Planck (PNP) theory.14 Following that, the mechanisms of ion transport and selectivity in Ca2+ channels were examined using Brownian dynamics simulations. In that study, the channel was modeled as a rigid structure with fixed charges in the walls, assuming that the glutamate residues were considered to be responsible for ion selectivity.15
The X-ray images of membrane channels obtained from experimental studies provide an extensive amount of information about the channels.16 The aim of the present study is to investigate the ion permeation characteristics in the voltage-gated calcium channels. There are several methods for free energy calculation, among these algorithms single ion potential of mean force (PMF) calculations using the umbrella sampling (US) method has been widely used in the investigations of ion channel conduction and selectivity.17–21 In this study, molecular dynamics (MD) simulations and single ion PMF calculations were carried out to determine the free energy profiles for the permeation of cations (Ca2+ and Na+) and anions (Cl−), thus allowing the calculation of the relative free energies of each ion in the bacterial calcium channel CaVAb.
The paper is organized as follows. In Section 2 we provide the modeling methods used in this work. In Section 3 we report our results and discussions, and in Section 4 we provide our conclusions.
2. Methods
2.1 Construction of the MD systems
The initial crystal structure of the calcium channel (CaVAb) was obtained from the Protein Data Bank (PDB ID:4MVQ).9 Only the pore-forming region from residues 129 to 218 was included in the simulations.22 It should be noted that the pore is made up of four chains (A, B, C and D), and each chain of four identical chains, and residues 129 to 218 have been selected as the pore-forming region. The protein was embedded in an equilibrated membrane consisting of 151 1-palmitoyl-2-oleoylphosphatidylcholine (POPC) lipids using the g_membed tool,23 a part of the Gromacs package.24 Bulk water molecules were substituted by Ca2+ and Cl− ions to achieve an ionic concentration of 150 mM. For the simulations involving Na+, one Ca2+ ion was replaced with Na+, and one Cl− ion was removed to neutralize the system. The system was further equilibrated for the free energy simulations.All simulations were carried out using the Gromacs simulation software v.4.5.5.24 CHARMM-36 force fields25,26 were utilized for the lipids and protein, and the TIP3P model was used for the water molecules.27 Electrostatic interactions were calculated at each step by using the particle-mesh Ewald method28 with the short-range electrostatic interaction cut off of 1.4 nm. The LINCS algorithm29 was also used to constrain all H-bonds, allowing an integration step-size of 2 fs. In addition, the Lennard-Jones potential was used with a cutoff of 1.4 nm. The Nose–Hoover thermostat was used to keep the simulation temperature constant by separately coupling the protein, lipids and the solvent (water and ions) to a temperature bath at T = 300 K. Furthermore, the pressure was kept constant at 1 bar by using the Parrinello–Rahman barostat algorithm with a coupling constant of 1 ps. After minimization, the systems were equilibrated for 5 ns. The complete system consisted of the protein, 151 POPC, 7089 TIP3P-water molecules, 55 Ca2+ and 86 Cl− (for the system consisting of Ca2+ and Cl− ions) or 54 Ca2+, 85 Cl− and 1 Na+ (for the system consisting of Na+, Ca2+ and Cl− ions), yielding a system with approximately 47![[thin space (1/6-em)]](https://www.rsc.org/images/entities/char_2009.gif) 600 atoms, as illustrated in Fig. 2(a).
600 atoms, as illustrated in Fig. 2(a).
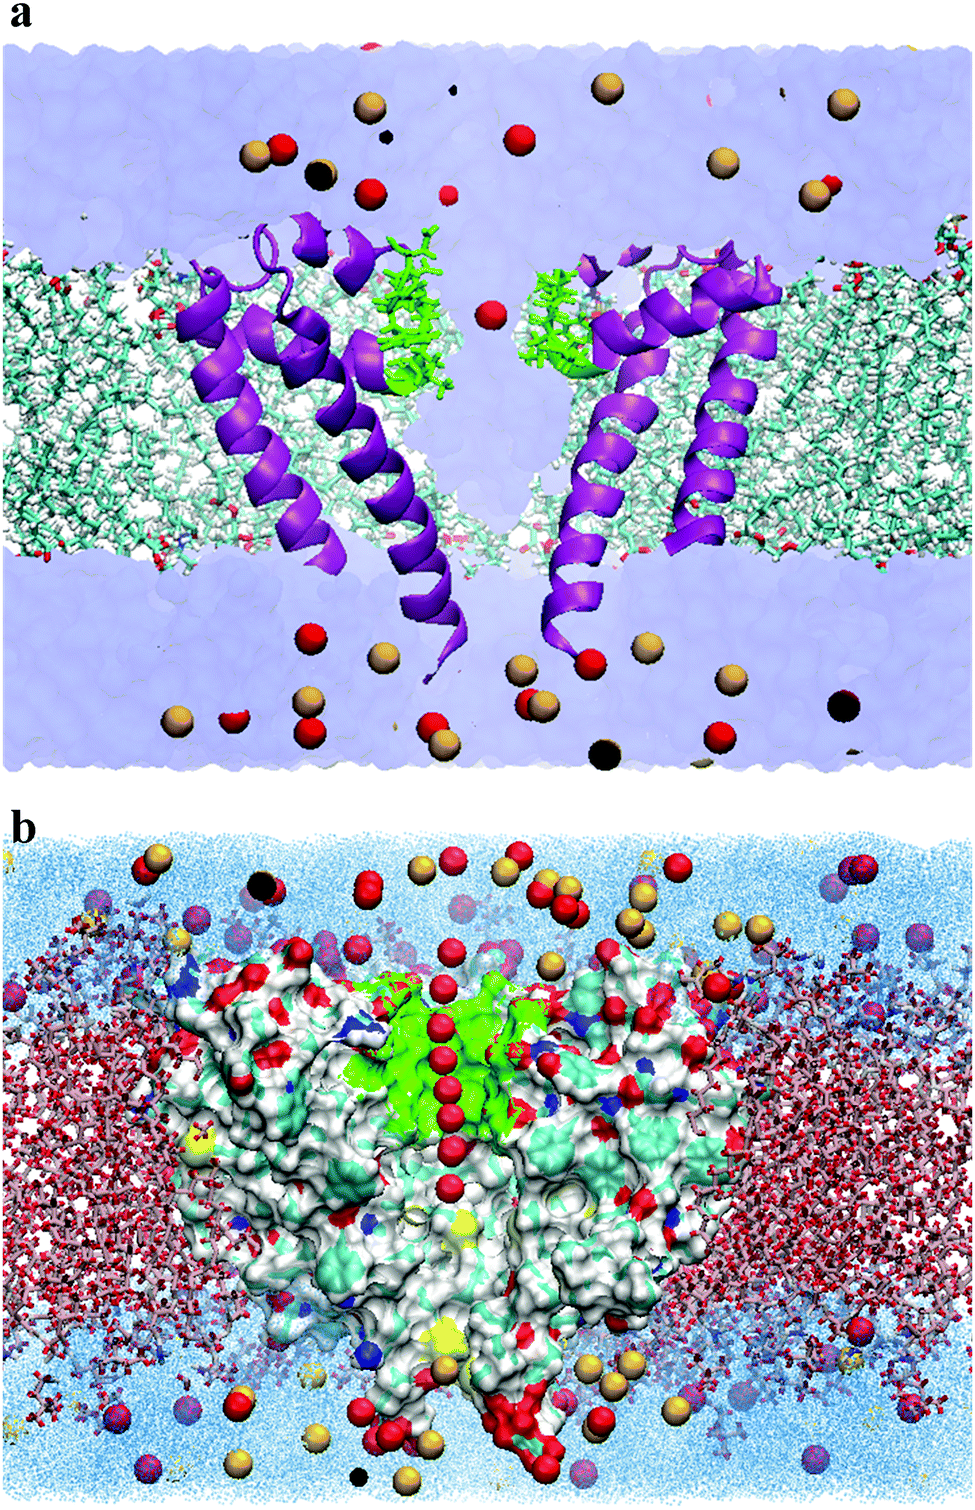 | ||
| Fig. 2 (a) Simulation system. A cross section of the simulation system is shown here. The CaVAb protein was embedded into a bilayer lipid containing POPC (in licorice representation), and solvated by TIP3P water (in Surf representation). Protein chains, selectivity filter, Ca2+ and Cl− are shown in purple, green, red and yellow, respectively. For clarity, only two of the four protein subunits are presented here. (b) Illustration of the reaction coordinates chosen for the umbrella sampling simulations. The analysis of the reaction pathway was undertaken as the principal axis of the protein channel, designed to be the z axis of the simulation box. The red balls indicate the position of the Ca2+ ions. Only a tiny fraction of all positions used as the reference position for the biasing potential is shown here. The lipid bilayer, the selectivity filter for ion permeation, water molecules, Ca2+, Cl− and protein are indicated by a licorice representation, green, dot representation, red, yellow and Surf representation, respectively. For clarity, the protein subunit closest to the viewer is not shown. The above graphics were rendered with VMD.38 | ||
2.2 Umbrella sampling
The umbrella sampling (US) method was applied to determine the potential of mean force (PMF) of ion permeation.30 Umbrella sampling simulations were used to achieve biased position histograms along the ion reaction coordinates. Since ion permeation has an activation barrier beyond 1.5kBT,31 classical MD simulations would not generate sufficient sampling. However, the umbrella sampling technique is a useful method to overcome this problem; the ion movement is restrained to positions along the reaction coordinates by using a biased potential.21The reaction pathway was determined as the principal axis of the protein channel, designed to be the Z axis of the simulation box (Fig. 2b). The entire pathway covering the range of [−8, 20] Å was divided into 0.7 Å intervals adding up to a total of 40 windows. The ion was subsequently placed into the center of each window, removing overlapping water molecules, followed by energy minimization. In all cases, ion positions were determined according to the center-of-mass (COM) of the channel selectivity filter.
The initial structures used in the window sampling were selected from the structures obtained during the last 5 ns of equilibration. During the umbrella simulation, a harmonic potential of 1000 kJ mol−1 nm−2 was used to restrain the sampled ion around the center of the window. Each umbrella window was simulated for 1.1 ns in the NPT ensemble. For the analysis, the first 100 ps was omitted as equilibration. The free energy profile was calculated using the g_wham tool, a part of the Gromacs software. The statistical error was estimated with 200 bootstrap iterations.32
3. Results and discussion
3.1 Structural stability
The protein conformational changes were analyzed by using RMSD with respect to its initial crystallographic structure. Based on the initial structure, the backbone conformational changes were measured over time. In all the simulations, the RMSD of the backbone atoms was about 1.5 Å, reflecting the stability of the channel (Fig. 3).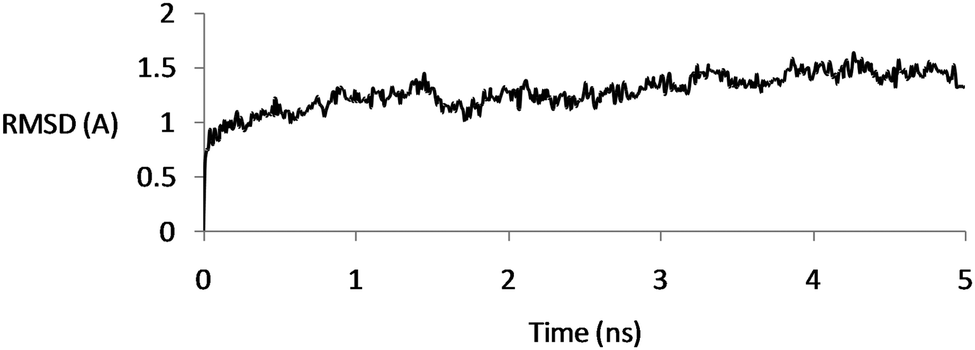 | ||
| Fig. 3 RMSD of the backbone atoms for the CaVAb protein according to its initial structure as a function of simulation time, demonstrating the stability of the structures. | ||
3.2 Potential of mean force of ions
In the present study, to evaluate the channel selectivity towards Ca2+, Na+ and Cl− ions, the free energy profiles (PMF) of these three ions were obtained using molecular dynamics simulation and the umbrella sampling method.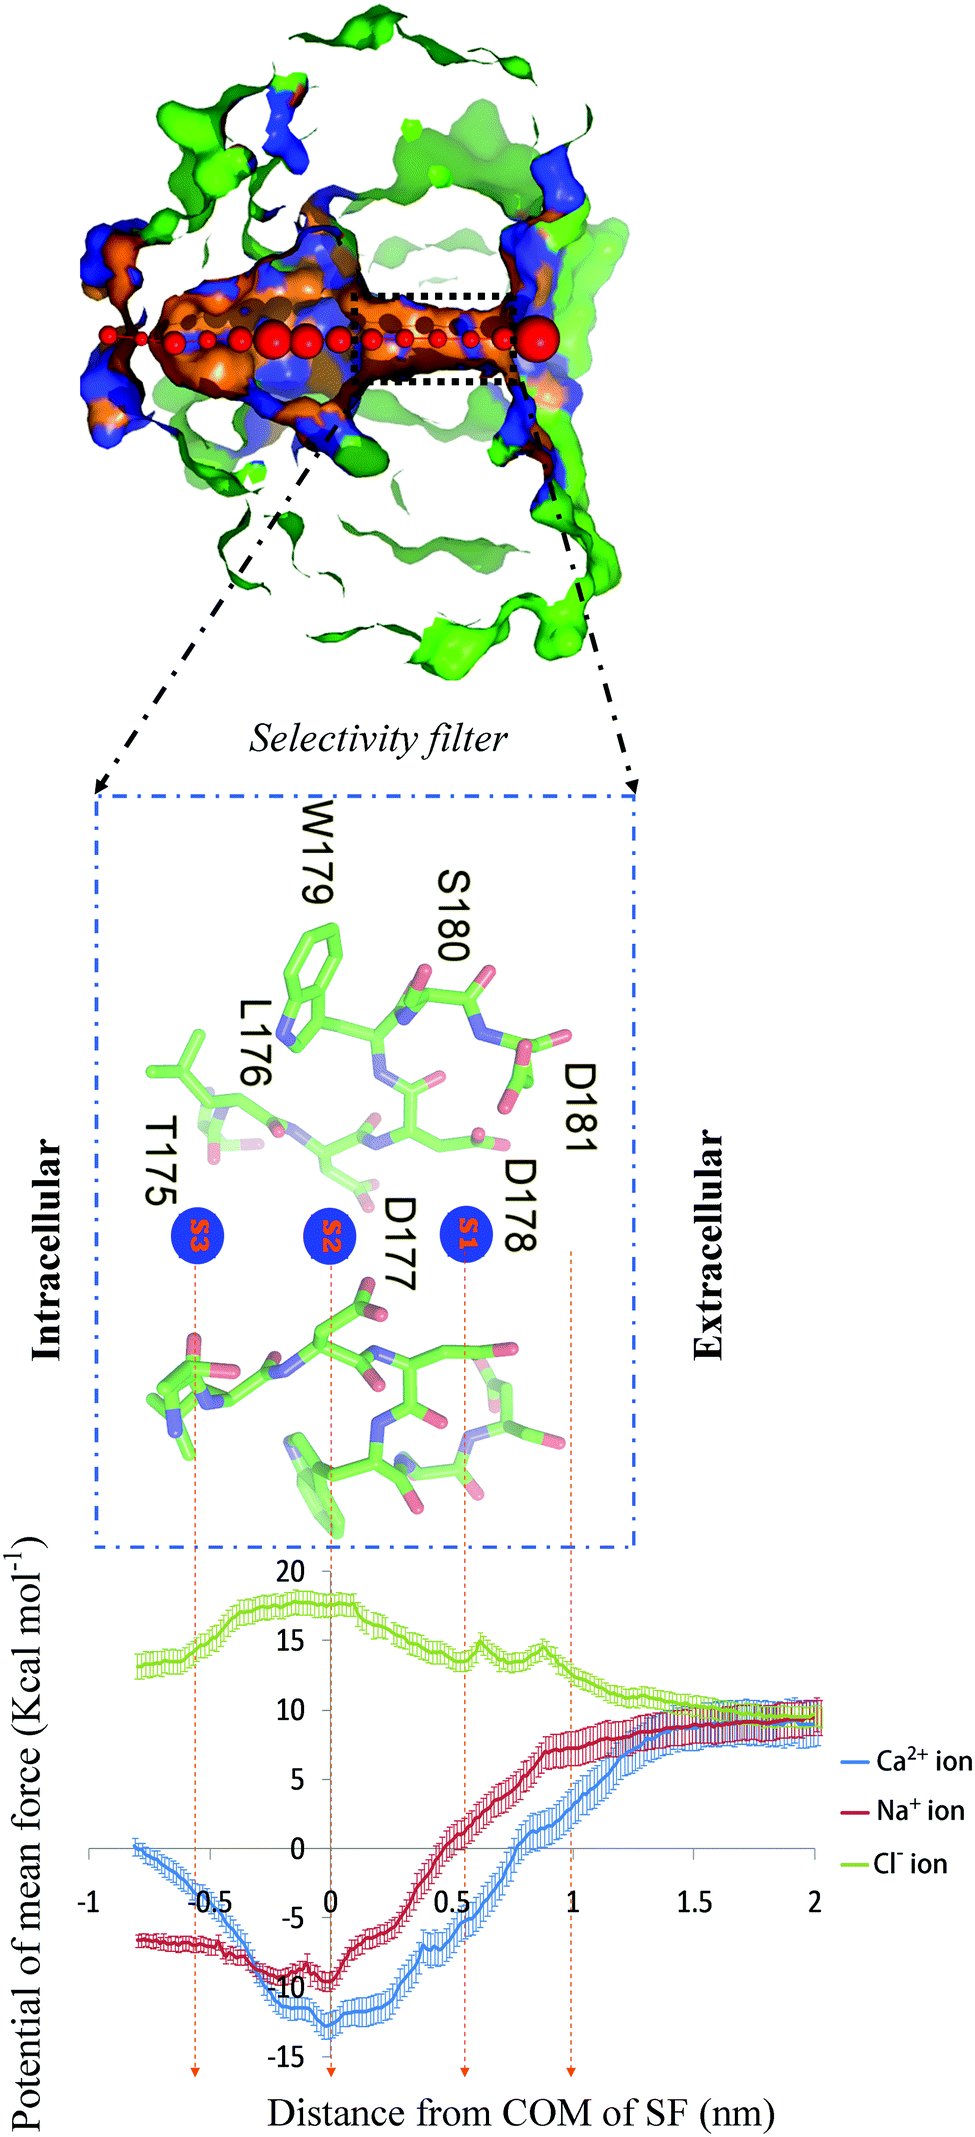 | ||
| Fig. 4 (top) PoreWalker39 output for the CaVAb channel. Visualization of a pore section from the CaVAb channel. Pore-lining atoms and residues are depicted in orange and blue, respectively. The remaining part of the protein is shown in green. Red spheres illustrate pore centers and their diameters are 1/10 of the pore diameter estimated at that position; the selectivity filter is indicated by the black dashed line box. (Middle panel) Side view of the selectivity filter. Residues in the selectivity filter 175TLDDWSD181 are shown in a green stick format, and the ion binding sites (S1, S2 and S3) along the ion pathway are illustrated by s1–3 in blue spheres. Only two subunits have been shown for clarity. (Bottom panel) The potential of mean force. The PMF for Ca2+ (blue), Na+ (red) and Cl− (green) calculated via umbrella sampling is shown as a function of the axial position of the ion, zeroed at the center of the selectivity filter. The ion is represented in bulk water on the right side of the graph and in the central cavity of the channel on the left hand side. The statistical error was estimated with 200 bootstrap iterations. | ||
While Ca2+ moves from the bulk to the center of the selectivity filter (about Z = 0 nm), the free energy decreases, but then increases until the end of the selectivity filter. In the PMF of Ca2+, there is a deep energy well (about 21.5 kcal mol−1 lower than the bulk value) at the center of the selectivity filter. For Ca2+ permeation, the lowest global minimum energy is in accordance with a conformation in which a Ca2+ ion is placed at site 2 adjacent to the D177 and L176 residues (about Z = 0 nm).
The energy state decreased (5 kcal mol−1 lower than the bulk value) at the point of the Ca2+ entry from the bulk into the opening of the selectivity filter (about Z = 1 nm). In this position, the ion is surrounded by four carboxyl oxygen atoms of D181. In fact, the presence of four negatively charged residues of D181, attracting positively charged Ca2+ ions, is the reason why the energy decreases. The energy continues to decrease with a relatively sharp gradient (14 kcal mol−1 lower than the bulk value) from the opening of the selectivity filter (Z = 1 nm) to the binding site 1 (Z = 0.6 nm). In this position, Ca2+ is surrounded by four carboxyl oxygen atoms of D178 located at a closer distance than the ion, resulting in a further decrease in the free energy (Fig. 1b). From this point (site 1) onwards, there is a continuous decrease in energy, until reaching the lowest minimum energy (21.5 kcal mol−1 lower than the bulk value) at binding site 2 (Z = 0 nm). At this site, the Ca2+ ion is surrounded by four carboxyl oxygen atoms of D177, and four carbonyl oxygen atoms of leu176 (L176) (Fig. 1c). In this region, four carboxyl oxygen and four carbonyl oxygen molecules are attractive enough to make a deep energy well and strongly hold the Ca2+ ion in the position. The energy increases steeply for the inward movement of the Ca2+ ion from site 2 until it reaches site 3. At site 3, the energy is 9.5 kcal mol−1 greater than the global energy minimum. In this position, Ca2+ is surrounded by carbonyl oxygen atoms of Thr175 (T175) (Fig. 1d). In fact, an approximately 9.5 kcal mol−1 energy barrier inhibits the Ca2+ ion from exiting its global energy minimum (site 2, Z = 0 nm) and reaching site 3 (Z = −0.6 nm).
The results from this study show that the Ca2+ cation experiences a deep energy well at the center of the selectivity filter. A deep energy well has also been observed in other ion channels.17,33 The lowest global minimum energy for Ca2+ is found at site 2 and in the vicinity of D177 and L176 residues (about Z = 0 nm). This deep energy well shows that the Ca2+ ion has the highest binding affinity towards site 2, revealing that the stabilization region of Ca2+ is at site 2 of the CaVAb channel. The evidence for this claim comes from the fact that the movement of calcium ions from site 2 (the center of the selectivity filter) to the binding site 3 (the internal end of the selectivity filter, Z = −0.6 nm) will result in an increase in the free energy, as compared to that of the global minimum energy. The Ca2+ ion has to overcome an energy barrier of about 9.5 kcal mol−1 to exit from the global minimum energy. The energy differences between Ca2+ ions occupying site 2 (global minimum energy) and Ca2+ ions occupying sites 1 (about Z = 0.6 nm) and 3 (about Z = −0.6 nm) were found to be 8.5 and 9.5 kcal mol−1, respectively, indicating that the affinity for site 1 of the Ca2+ ion is higher than that of site 3. Larger energy differences and, therefore, more affinity for site 1, seem to be due to more negative charges at this site. Also, results show that site 2 (the central site) and site 3 display the highest and lowest affinities to Ca2+ ions, respectively, consistent with the experimental data.9 It is proposed that three Ca2+ binding sites are required for ion permeation, and only site 2 binds to divalent cations with sufficient affinity to potentially block the channel.34 The intermediate affinity of sites 1 and 3 facilitates Ca2+ movement into and out of the central high affinity site, which can result in a high ion conductance.9 It is also proposed that the CaV channel ion selectivity results from the high-affinity Ca2+ binding to the selectivity filter that prevents the influx of Na+. On the other hand, at low Ca2+ concentrations, a single Ca2+ ion strongly attaches to this position (site 2), and inhibits the entry of Na+. In this study, because there is a single Ca2+ ion at the center of the selectivity filter (site 2), it is similar to low Ca2+ concentrations and the free energy graph shows blocking of the ion channel. At high Ca2+ concentrations, the rapid flow of the Ca2+ flux through the CaV channels seems to utilize a knock-off mechanism wherein the electrostatic repulsions between the Ca2+ ions in the selectivity filter overcome the strong binding of a single Ca2+ ion. Ionic repulsions between the adjacent Ca2+ ions at these sites allow rapid conduction despite the intrinsic high affinity for Ca2+ binding.4,5 The CaVAb selectivity filter is wide (6 Å diameter) and the ionic diameter of Ca2+ is about 2.2 Å. So, the distance between ion and carbonyl and carboxyl groups of ion-binding sites is large. For this reason, it is suggested that the Ca2+ ions bind to ion-binding sites (S1, S2 and S3) in a hydrated form through bound water molecules (Fig. 1b–d).9 The sites equivalent to sites S1 and S3 in the free energy graph (local minimum energy) are lost probably because the selectivity filter is wide and there is a hydrated form of ion in the selectivity filter.
Similar to the Ca2+ ion, when the Na+ ion moves through the bulk (Z > 1 nm) to the opening of the selectivity filter (Z = 1 nm), four negatively charged residues of D181 at the opening of the selectivity filter attract Na+ cations, and then the free energy is reduced, compared to the bulk (1.5 kcal mol−1 lower than the bulk value). While moving to site 1 (Z = 0.6 nm), Na+ is surrounded by four carboxyl oxygen atoms of D178 located at a closer distance than the ion, resulting in a further decrease in the free energy (6.5 kcal mol−1 lower than the bulk value). When reaching the center of the selectivity filter (site 2, Z = 0 nm), Na+ is surrounded by four carboxyl oxygen atoms of D177 and four carbonyl atoms of L176. The presence of such strong binding interactions leads to the formation of a deep energy well (19 kcal mol−1 lower than the bulk value) in this position. When reaching site 3, the energy (in the vicinity of the T175, Z = −0.6 nm) increases, as compared to the global energy minimum (16.5 kcal mol−1 lower than the bulk value). Like Ca2+, the PMF of Na+ exhibits a global minimum energy at site 2 (19 kcal mol−1 lower than the bulk value), where it is surrounded by the rings of carboxyl and carbonyl oxygen atoms. The value of the global minimum energy for Na+ is 2.5 kcal mol−1 lower than that for Ca2+, indicating that Ca2+ binds to the filter more tightly than Na+ does. Because Ca2+ is more electropositive than Na+, it binds more tightly to the selectivity filter, and blocks Na+ conductance at low Ca2+ concentrations, resulting in the preferential permeation of Ca2+ at higher Ca2+ concentrations.9 An approximately 2.5 kcal mol−1 energy barrier prevents the Na+ ion from exiting its global energy minimum configuration in the selectivity filter (site 2) and reaching site 3 (in the vicinity of T175, Z = −0.6 nm). To pass through from site 2 to site 3, the Na+ ion has to overcome a 2.5 kcal mol−1 energy barrier, while not only does Ca2+ have a larger global minimum energy than Na+ (2.5 kcal mol−1 deeper) at site 2, but also the energy level of site 3 for Ca2+ is 4.5 kcal mol−1 higher than that of Na+, resulting in the need for a higher energy (9.5 kcal mol−1) to move through this barrier and reach site 3. For this reason, Na+ seems to easily pass through CaVAb channels in the absence of Ca2+. In line with our results, other studies have consistently demonstrated that Na+ can pass through the channel higher than Ca2+ in the absence of Ca2+ ions.35–37 At low Ca2+concentrations, a single Ca2+ ion strongly attaches to this position (site 2), and inhibits the entry of Na+. On the other hand, at high Ca2+ concentrations, ionic repulsions between the adjacent Ca2+ ions at the binding sites allow rapid conductance, despite the intrinsic high affinity for Ca2+ binding.4,5
The PMF of Cl− steadily increases by staying close to the selectivity filter. In contrast to Na+ and Ca2+ cations, the free energy of Cl− anions continues to increase when the ion passes through the bulk to the center of the selectivity filter (site 2, Z = 0 nm) and then decreases when the ion moves to site 3 (Z = −0.6 nm).
When getting closer to the opening of the selectivity filter, a Cl− anion is surrounded by four negatively charged residues of D181, and repulsive forces between the negatively charged ions and aspartate residues increase (5 kcal mol−1 above the bulk value) the energy barrier. When a Cl− ion moves to site 1 (Z = 0.6 nm) and is surrounded by four negatively charged residues of D178, the energy barrier further increases (6 kcal mol−1 above the bulk value), until it finally reaches its maximum at the end of site 2 (Z = 0 nm) (9 kcal mol−1 higher than the bulk value). In this position, Cl− is surrounded by four carboxyl oxygen atoms of D177 and four carbonyl oxygen atoms of L176. The presence of high negative charges in this area leads to an increase in the energy barrier to its maximum value. When moving to site 3 (Z = −0.6 nm), Cl− ions are located in the vicinity of four carbonyl oxygen atoms of T175. The presence of less negative charges in this position is the reason why the energy barrier decreases. The energy difference between the bulk level energy of Cl− outside the selectivity filter and site 3 is approximately 5 kcal mol−1, but between the bulk level energy of Cl− outside the selectivity filter and site 1 is 6 kcal mol−1. The presence of more negative charges at site 1 can be the reason for this energy difference. To pass through site 2 to site 3, the energy reduction is about 4 kcal mol−1. An increase in the energy barrier when the anion moves to the depth of the channel, and a subsequent decrease in the energy barrier when the anion moves away from the center of the selectivity filter (Z = 0 nm) provide clear reasons why the ion is not located in the favorite position and lacks the ability to pass. However, under normal physiological conditions, a Cl− anion rarely reaches these binding points, because of the presence of the large energy barrier. Local energy peaks are found at the opening of the selectivity filter and site 1. A slight sudden increase, which reaches its maximum height in these positions, is in accordance with the two rings of the negatively charged residues of D181 and D178 at the opening of the selectivity filter and site 1, respectively, providing a repulsive force to the Cl− anion. In comparison with the PMF of Ca2+, the highest energy barrier for Cl− occurs at binding site 2, suggesting that negative charges of the D177 residue may play a major role in choosing Ca2+ over Cl− in the CaVAb channel. The energy barrier for Cl− and different well-depth ranges for Na+ and Ca2+ ions are directly related to the magnitude of the measured flow rates for each ion (Ca2+ > Na+ > Cl−).9
3.3 Interaction energy
In Fig. 5, the average ion–water and ion–protein interaction energies are displayed as a function of the ion position for Ca2+ and Na+ in the selectivity filter. Ion–water and ion–protein interactions are almost mirror images of each other. It is also found that there is an increase in the strong attractive interaction between the ion and the protein when the ion gets close to the ring of D177 and L176 (Z = 0 nm). As the ion continues to move through the center of the selectivity filter, the ion–protein and ion–water interactions become more and less negative, respectively.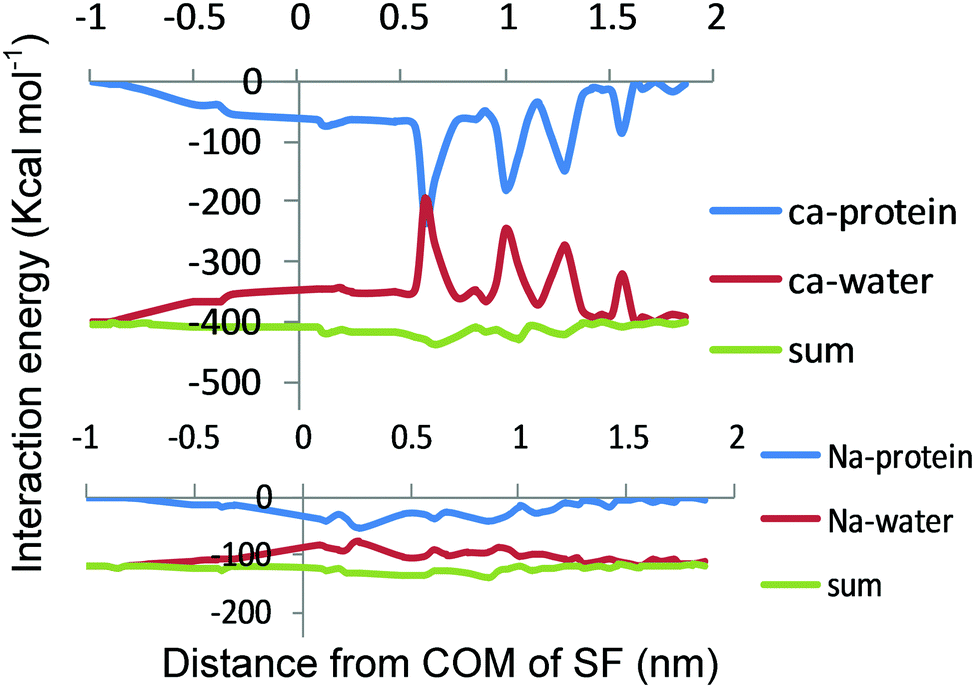 | ||
| Fig. 5 Interaction energies of the ions with water and protein. (top) The Ca2+–protein (blue) and Ca2+–water (red) interactions are plotted as a function of the axial position of the ion in the pore. (bottom) The Na+–protein (blue) and Na+–water (red) interaction is plotted as a function of the axial position of the ion in the pore. The sum of the ion–water and ion–protein interaction energies is shown for both Na+ and Ca2+ (green) as a function of the axial position of the ion in the pore. | ||
Where there is an energy well for Na+ and Ca2+ in the PMF (Z = 0 nm), the ion–protein energy interaction of both ions undergoes changes, demonstrating that the attractive ion–protein interaction increases in this region (becoming more negative), and, thereby, the water–ion interaction decreases (becoming less negative). However, the increased attractive ion–protein interaction in this region reflects the high affinity of these two cations for the selectivity filter. In addition, the higher ion–protein interaction energy for Ca2+ over Na+ in the selectivity filter is due to the stronger interactions of a Ca2+ divalent cation with the protein, representing the higher affinity of Ca2+ over Na+ for the selectivity filter. Because Ca2+ both binds more tightly to the filter and exhibits more affinity to the filter than Na+, it seems that Na+ ions lack the ability to block Ca2+ conductance. This is because of the fact that Na+ affinity to the channel should be higher than Ca2+ affinity to block the channel. As shown in Fig. 5, the sum of the ion–protein and the ion–water interactions is illustrated as single Na+ and Ca2+ ions passing through the pore. Since both interactions are almost mirror images of each other, their sum yields a relatively straight line. As expected, when the Cl− anion moves through the center of the selectivity filter the ion–protein energy interaction becomes less negative demonstrating that the repulsive ion–protein interaction increases in this region (Fig. S1, ESI†).
4. Conclusions
In the present study, it was demonstrated that Ca2+ and Na+ cations experience a deep energy well, while Cl− anions experience a relatively high energy barrier at the center of the selectivity filter (site 2) adjacent to the carbonyl oxygen atoms of D177 and carboxyl oxygen atoms of L176. In addition, the results from this study revealed that site 2 (the central site) and site 3 display the highest and lowest affinity to Ca2+, respectively. Because Ca2+ is more electropositive than Na+, the global minimum energy for Ca2+ is more than that for Na+, showing that Ca2+ binds more tightly to the filter. An increase in the energy barrier when the Cl− ions move to the depth of the channel provides a convincing reason as to why the ion is not located in the desired position and lacks the ability to pass.Financial and competing interest disclosure
The authors report no conflicts of interest in this work. The authors declared no competing financial interest.Acknowledgements
This work is a part of the PhD thesis of Jamal Adiban in the field of Medical Nanotechnology at the Department of Medical Physics and Biomedical Engineering, Faculty of Medicine, Shahid Beheshti University of Medical Sciences (SBMU). The authors would like to thank Dr Pezhman Sasanpour for useful discussions and the Institute for Research in Fundamental Sciences (IPM) for some technical support. H. Rafii-Tabar would like to thank the Iran Elite Foundation (Bonyade Nokhbegan) for a Chair in Nano-neuroscience.References
- C. J. Weir, Anaesthesiol. Intensive Care Med., 2013, 14, 410–416 CrossRef.
- W. A. Catterall, Cold Spring Harbor Perspect. Biol., 2011, 3, a003947 CrossRef PubMed.
- M. J. Berridge, P. Lipp and M. D. Bootman, Nat. Rev. Mol. Cell Biol., 2000, 1, 11–21 CrossRef CAS PubMed.
- W. A. Sather and E. W. McCleskey, Annu. Rev. Physiol., 2003, 65, 133–159 CrossRef CAS PubMed.
- W. Almers and E. McCleskey, J. Physiol., 1984, 353, 585–608 CrossRef CAS.
- J. Payandeh, T. Scheuer, N. Zheng and W. A. Catterall, Nature, 2011, 475, 353–358 CrossRef CAS PubMed.
- J. Payandeh, T. M. G. El-Din, T. Scheuer, N. Zheng and W. A. Catterall, Nature, 2012, 486, 135–139 CAS.
- X. Zhang, W. Ren, P. DeCaen, C. Yan, X. Tao, L. Tang, J. Wang, K. Hasegawa, T. Kumasaka and J. He, Nature, 2012, 486, 130–134 CrossRef CAS PubMed.
- L. Tang, T. M. G. El-Din, J. Payandeh, G. Q. Martinez, T. M. Heard, T. Scheuer, N. Zheng and W. A. Catterall, Nature, 2014, 505, 56–61 CrossRef PubMed.
- R. W. Tsien, P. Hess, E. W. McCleskey and R. L. Rosenberg, Annu. Rev. Biophys. Biophys. Chem., 1987, 16, 265–290 CrossRef CAS PubMed.
- T. X. Dang and E. W. McCleskey, J. Gen. Physiol., 1998, 111, 185–193 CrossRef CAS PubMed.
- J. Yang, P. T. Elllnor, W. A. Sather, J.-F. Zhang and R. W. Tsien, Nature, 1993, 366, 158–161 CrossRef CAS PubMed.
- E. W. McCleskey, J. Gen. Physiol., 1999, 113, 765–772 CrossRef CAS PubMed.
- W. Nonner and B. Eisenberg, Biophys. J., 1998, 75, 1287–1305 CrossRef CAS PubMed.
- B. Corry, T. W. Allen, S. Kuyucak and S.-H. Chung, Biophys. J., 2001, 80, 195–214 CrossRef CAS PubMed.
- J. N. C. Kew and C. H. Davies, Ion Channels: From Structure to Function, Oxford University Press, 2010 Search PubMed.
- M. Andersson, D. Mattle, O. Sitsel, T. Klymchuk, A. M. Nielsen, L. B. Møller, S. H. White, P. Nissen and P. Gourdon, Nat. Struct. Mol. Biol., 2014, 21, 43–48 CAS.
- H.-B. Xie, J. Wang, Y. Sha and M.-S. Cheng, Biophys. Chem., 2013, 180, 1–9 CrossRef PubMed.
- S. Ke, E.-M. Zangerl and A. Stary-Weinzinger, Biochem. Biophys. Res. Commun., 2013, 430, 1272–1276 CrossRef CAS PubMed.
- S. Fritsch, I. Ivanov, H. Wang and X. Cheng, Biophys. J., 2011, 100, 390–398 CrossRef CAS PubMed.
- J. Krüger and G. Fels, Proceedings of IWPLS, 2009, 9, 14–15 Search PubMed.
- B. Corry, PeerJ, 2013, 1, e16 Search PubMed.
- M. G. Wolf, M. Hoefling, C. Aponte-Santamaria, H. Grubmuller and G. Groenhof, J. Comput. Chem., 2010, 31, 2169–2174 CrossRef CAS PubMed.
- B. Hess, C. Kutzner, D. Van Der Spoel and E. Lindahl, J. Chem. Theory Comput., 2008, 4, 435–447 CrossRef CAS PubMed.
- J. B. Klauda, R. M. Venable, J. A. Freites, J. W. O'Connor, D. J. Tobias, C. Mondragon-Ramirez, I. Vorobyov, A. D. MacKerell Jr and R. W. Pastor, J. Phys. Chem. B, 2010, 114, 7830–7843 CrossRef CAS PubMed.
- A. D. MacKerell, M. Feig and C. L. Brooks, J. Comput. Chem., 2004, 25, 1400–1415 CrossRef CAS PubMed.
- W. L. Jorgensen, J. Chandrasekhar, J. D. Madura, R. W. Impey and M. L. Klein, J. Chem. Phys., 1983, 79, 926–935 CrossRef CAS.
- T. Darden, D. York and L. Pedersen, J. Chem. Phys., 1993, 98, 10089–10092 CrossRef CAS.
- B. Hess, H. Bekker, H. J. Berendsen and J. G. Fraaije, J. Comput. Chem., 1997, 18, 1463–1472 CrossRef CAS.
- G. M. Torrie and J. P. Valleau, Chem. Phys. Lett., 1974, 28, 578–581 CrossRef CAS.
- S. Edwards, B. Corry, S. Kuyucak and S.-H. Chung, Biophys. J., 2002, 83, 1348–1360 CrossRef CAS PubMed.
- J. S. Hub, B. L. De Groot and D. Van Der Spoel, J. Chem. Theory Comput., 2010, 6, 3713–3720 CrossRef CAS.
- C. Domene and S. Furini, Biochemistry, 2012, 51, 1559–1565 CrossRef CAS PubMed.
- E. McCleskey and W. Almers, Proc. Natl. Acad. Sci. U. S. A., 1985, 82, 7149–7153 CrossRef CAS.
- P. Kostyuk, S. Mironov and Y. M. Shuba, J. Membr. Biol., 1983, 76, 83–93 CrossRef.
- P. Hess, J. B. Lansman and R. W. Tsien, J. Gen. Physiol., 1986, 88, 293–319 CrossRef CAS PubMed.
- C.-C. Kuo and P. Hess, J. Physiol., 1993, 466, 629–655 CAS.
- W. Humphrey, A. Dalke and K. Schulten, J. Mol. Graphics, 1996, 14, 33–38 CrossRef CAS PubMed.
- M. Pellegrini-Calace, T. Maiwald and J. M. Thornton, PLoS Comput. Biol., 2009, 5, e1000440 Search PubMed.
Footnote |
| † Electronic supplementary information (ESI) available. See DOI: 10.1039/c6mb00690f |
| This journal is © The Royal Society of Chemistry 2017 |